Here we demonstrate a method to apply fluid shear stress to cancer cells in suspension to model the effects of hemodynamic stress on circulating tumor cells.
During metastasis, cancer cells from solid tissues, including epithelia, gain access to the lymphatic and hematogenous circulation where they are exposed to mechanical stress due to hemodynamic flow. One of these stresses that circulating tumor cells (CTCs) experience is fluid shear stress (FSS). While cancer cells may experience low levels of FSS within the tumor due to interstitial flow, CTCs are exposed, without extracellular matrix attachment, to much greater levels of FSS. Physiologically, FSS ranges over 3-4 orders of magnitude, with low levels present in lymphatics (<1 dyne/cm2) and the highest levels present briefly as cells pass through the heart and around heart valves (>500 dynes/cm2). There are a few in vitro models designed to model different ranges of physiological shear stress over various time frames. This paper describes a model to investigate the consequences of brief (millisecond) pulses of high-level FSS on cancer cell biology using a simple syringe and needle system.
Metastasis, or the spread of cancer beyond the initial tumor site, is a major factor underlying cancer mortality1. During metastasis, cancer cells utilize the circulatory system as a highway to disseminate to distant sites throughout the body2,3. While en route to these sites, circulating tumor cells (CTCs) exist within a dynamic fluid microenvironment unlike that of their original primary tumor3,4,5. It has been proposed that this fluid microenvironment is one of many barriers to metastasis4. There is wide agreement in the concept of metastatic inefficiency, i.e., that most CTCs entering the circulation either perish or do not form productive metastatic colonies6,7,8. However, why metastasis is inefficient from the perspective of an individual CTC is less certain and remains an active area of investigation. CTCs are detached from extracellular matrix, deprived of soluble growth and survival factors that may be present in the primary tumor, and exposed to the immune system and hemodynamic forces in a much different manner than in the primary tumor4. Each of these factors may contribute to the poor survival of CTCs, but their relative contributions are unclear. This paper addresses the question of how hemodynamic forces affect CTCs.
Studying the effects of hemodynamic forces on CTCs is quite challenging. Currently, there are no engineered in vitro systems that can replicate the entire spatiotemporal dynamics (heart to capillaries) and rheological properties of the human vascular system. Moreover, how CTCs experience the circulatory system is not entirely clear. Experimental evidence indicates that most cancer cells do not circulate continuously like blood cells. Rather, due to their relatively large size (10-20 µm in diameter), most CTCs become entrapped in capillary beds (6-8 µm in diameter) for variable lengths of time (s to days) where they may die, extravasate, or be displaced to the next capillary bed8,9,10,11. However, there is some evidence that CTC size may be more heterogeneous in vivo, and that smaller CTCs are detectable12. Therefore, based on distance and blood flow velocity, CTCs may only circulate freely for a matter of seconds between these periods of entrapment, although a quantitative description of this behavior is lacking13.
Furthermore, depending on where CTCs enter the circulation, they may pass through multiple capillary beds in the lung and other peripheral sites and through both the right and left heart prior to reaching their final destination. Along the way, CTCs are exposed to various hemodynamic stresses including fluid shear stress (FSS), compressive forces during their entrapment in the microcirculation, and potentially, traction forces under circumstances where they might exhibit leukocyte-like rolling along blood vessel walls14. Thus, both the ability to model the circulation and the understanding of the CTC behavior to be modeled is limited. Because of this uncertainty, any findings from in vitro model systems should be validated in an experimental vertebrate organism and ultimately, in cancer patients.
With the aforementioned caveats, this paper demonstrates a relatively simple model to apply FSS to cells in suspension to probe the effects of FSS on CTCs first described in 201215. FSS results from friction of blood flow against the vessel wall, which produces a parabolic velocity gradient under conditions of laminar flow in larger vessels. Cells experience higher levels of FSS near vessel walls and lower levels near the center of the blood vessel. Fluid viscosity, flow rate, and dimensions of the conduit through which the flow occurs influence FSS, as described by the Hagen-Poiseuille equation. This applies to blood flows behaving as Newtonian fluids, but does not hold for the microcirculation. Physiological FSS ranges over several orders of magnitude with the lowest levels in the lymphatics (<1 dyn/cm2) and the highest at regions around heart valves and atherosclerotic plaques (>500 dyn/cm2)5. Mean wall shear stress in arteries is 10-70 dyn/cm2 and 1-6 dyn/cm2 in veins16,17.
In the heart, cells may be exposed to turbulent flows around valve leaflets where very high-level, but very short-duration FSS may be experienced18,19. Although the bioprocessing field has long studied the effects of FSS on mammalian cells in suspension, this information may be of limited value for understanding the effects of FSS on CTCs as it generally focuses on much lower levels of FSS applied over a long duration20. As described below, using a syringe and needle, one can apply relatively high (tens to thousands dyn/cm2) FSS for a relatively short (milliseconds) duration to a cell suspension. Since the initial description of this model15, others have employed it to study the effects of FSS on cancer cells21,22,23. Multiple "pulses" of FSS can be applied to cell suspensions in a short period of time to facilitate downstream experimental analyses. For example, this model can be used to measure the ability of cells to resist mechanical destruction by FSS by measuring cell viability as a function of the number of pulses applied. Alternatively, the effects of FSS exposure on the biology of cancer cells can be explored by collecting cells for a variety of downstream analyses. Importantly, part of the cell suspension is reserved as a static control to compare the effects of FSS from those that might be associated with cell detachment and time held in suspension.
1. Cell preparation
2. Fluid shear stress exposure
3. Viability measurement
NOTE: Viability can be assessed using enzymatic assays (luciferase, resazurin, and WST-1), counting intact cells, flow cytometry, or by clonogenic assays.
Elevated resistance to FSS-induced mechanical destruction has been previously shown to be a conserved phenotype across multiple cancer cell lines and cancer cells freshly isolated from tumors relative to non-transformed epithelial cell comparators15,24. Here, additional cancer cell lines from a variety of tissue origins (Table 2) were tested to demonstrate that the majority of these cells display viability ≥ 20% after 10 pulses of FSS at 250 µL/s. The one exception is MiaPaCa2 cells, which were relatively sensitive to mechanical destruction from FSS (viability ≤ 10%). To adequately describe the FSS resistance profile of a cell line, n ≥ 3 biological replicates are recommended.
By way of comparison, all of the non-transformed epithelial cells examined have viability < 10% under these conditions15,24. Thus, while there is a range in FSS resistance observed, the majority of the cancer cell lines tested exhibit greater FSS resistance than non-transformed cells. Cancer cell lines can be derived from both primary tumor tissues and metastases. One could postulate that cells derived from metastases may exhibit greater FSS resistance as this phenotype may have been selected during metastatic dissemination. However, the FSS resistance level was shown to not depend on whether cells were derived from primary tumors or metastases15,24. Moreover, the levels of FSS resistance did not correlate with metastatic potential in a series of human prostate cancer cell lines15.
To test this further, BALB/c mammary epithelial cells with varying metastatic potential (4T1 = highly metastatic, 4T07 = weak to moderate metastatic potential, 67NR = no to low metastatic potential25,26) were used. This experiment revealed that FSS resistance is not correlated with metastatic potential (Figure 1). Moreover, both 4T1 and 4T07 cells exhibit a biphasic loss of cell viability-a greater loss of viability in pulses 1-2 than observed in subsequent pulses. This is typical of most cancer cell lines investigated by this group. In contrast, 67NR exhibits a more linear loss of cell viability as a function of FSS. Collectively, the data from Table 2 and Figure 1 demonstrate that FSS resistance is a property of transformed cells.
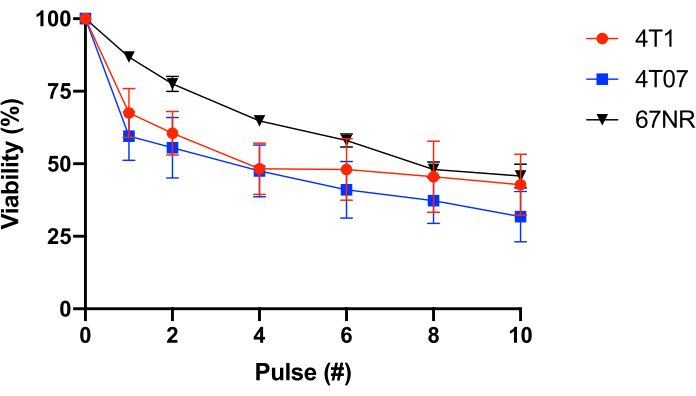
Figure 1: Fluid shear stress resistance of syngeneic BALB/c mammary epithelial cancer cells. Cells were exposed to FSS (30 G needle, 10 pulses@250 mL/s), and viability was measured using resazurin conversion (n = 4/cell line). While FSS exposure reduced the number of viable cells (p < 0.0001, 2-way ANOVA), and each cell line displayed different resistance profiles (p = 0.0446, 2-way ANOVA), there was no significant difference among cell lines after 10 pulses of FSS exposure (p = 0.2833, 2-way ANOVA). Abbreviations: FSS = fluid shear stress; ANOVA = analysis of variance. Please click here to view a larger version of this figure.
Shear (τ): | wall (maximum) | minimum | |||||||||||
Cell Diameter: | N/A | 10 µm | 15 µm | 20 µm | |||||||||
Needle Gauge: | 30 | 27 | 25 | 30 | 27 | 25 | 30 | 27 | 25 | 30 | 27 | 25 | |
Flow Rate (µL/s) | 20 | 507 | 220 | 116 | 32 | 10 | 4 | 48 | 16 | 7 | 64 | 21 | 9 |
50 | 1267 | 550 | 290 | 80 | 26 | 11 | 120 | 39 | 17 | 159 | 52 | 22 | |
100 | 2534 | 1100 | 580 | 159 | 52 | 22 | 239 | 79 | 33 | 319 | 105 | 45 | |
150 | 3801 | 1650 | 869 | 239 | 79 | 33 | 359 | 118 | 50 | 478 | 157 | 67 | |
200 | 5068 | 2200 | 1159 | 319 | 105 | 45 | 478 | 157 | 67 | 637 | 210 | 89 | |
250 | 6335 | 2750 | 1449 | 398 | 131 | 56 | 598 | 196 | 84 | 797 | 262 | 111 |
Table 1: Maximum shear stress (τwall) levels. The table lists the maximum wall FSS levels in dyn/cm2 for 30 G, 27 G, and 25 G needles at the flow rates of 20, 50, 100, 150, 200, and 250 µL/s. Shear stress levels were calculated using the Poiseuille equation (
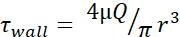
), available information for the inner diameter of each needle gauge, as well as the assumption that µ = 0.01 dyn·s/cm2. Minimum FSS levels for each size were calculated using 
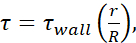
wherein r is the radius of cell, and R is the radius of the needle. Abbreviation: FSS = fluid shear stress; τ = shear; τwall = maximum shear; µ = viscosity; Q = volumetric flow rate.
Cell Line | Tissue Source | Species | Mean Viability (%) after 10 pulses |
TRAMPC1 | Prostate | Mouse | 40 |
4T01 | Breast | Mouse | 32 |
4T7 | Breast | Mouse | 43 |
67NR | Breast | Mouse | 46 |
66CL4 | Breast | Mouse | 28 |
RT4 | Bladder | Human | 62 |
W17-266-4 | Melanoma | Human | 46 |
HS852 | Melanoma | Human | 41 |
HS695 | Melanoma | Human | 41 |
A2058 | Melanoma | Human | 37 |
A375 | Melanoma | Human | 37 |
RPMI-7951 | Melanoma | Human | 35 |
SKMEL2 | Melanoma | Human | 29 |
A101D | Melanoma | Human | 28 |
MiaPaCa | Pancreatic | Human | 7 |
Table 2: Fluid shear stress resistance of various cancer cell lines. Each cancer cell line was exposed to fluid shear stress from the syringe and needle model (30 G needle, 10 pulses@250 mL/s) (n ≥ 3/cell line), and viability was measured either by luciferase activity or resazurin conversion.
This paper demonstrates the application of FSS to cancer cells in suspension using a syringe and needle. Using this model, cancer cells have been shown to be more resistant to brief pulses of high-level FSS relative to non-transformed epithelial cells15,22,24. Furthermore, exposure to FSS using this model results in a rapid increase in cell stiffness, activation of RhoA, and increased cortical F-actin and myosin II-based contractility24,27. Rapid mechano-adaptation (the ability of CTCs to become more or less stiff depending on the circumstances) may prevent the mechanical destruction of CTCs and facilitate other aspects of metastatic colonization24,28. Indeed, findings made using this in vitro model have been confirmed using experimental CTCs in animal models24. This rapid mechano-adaptation likely explains the bi-phasic loss of cell viability typically observed in this model (Figure 1), i.e., FSS-naïve cells are more susceptible to destruction than cells that have been exposed to even a single pulse of FSS. Taken together, this indicates that FSS induces rapid cell stiffening in cancer cells that protects them from subsequent pulses of FSS.
Although the RhoA-actomyosin axis is an important driver of FSS resistance15,21,24, there are likely other mechanisms involved29. Further evidence that cell stiffness is a key determinant of FSS resistance is that disruption of lamin A, which controls the structural integrity of the nucleus-the stiffest component of the cell, reduces FSS resistance in cancer cells using this model22. We are using this model to probe the mechanisms of FSS resistance in cancer cells further. Here, this model has been used to measure the capacity of various cancer cell lines to resist mechanical destruction by exposing cells to brief pulses of high levels of FSS. Although this is a relatively inexpensive, simple model to develop in the laboratory, with the most expensive element being the syringe pump, care must be taken to follow the protocol faithfully to obtain reproducible results. Multiple pulses of FSS can be applied to cells in a very short time, <10min. The total elapsed time for the experiment depends on the suspension volume, flow rate, pulse number, and the dexterity of the user transferring the suspension between pulses. With experience, a 5 mL suspension exposed to FSS with a 30 G needle for 10 pulses@250 µL/s can be processed in ~10 min. For most cell lines, there is minimal loss of viability due to being held in suspension for this length of time.
Because the exposure to FSS occurs relatively quickly, FSS is typically applied to cell suspensions in serum-free medium to reduce foaming of the samples. The difference in viscosity between 0-10% fetal bovine serum is negligible in this assay. However, it is critical to ensure physiologic levels of calcium in the medium in which the cells are sheared. Moreover, with regard to the methods for cell dissociation prior to FSS exposure, no difference in FSS resistance was detected in PC-3 cell suspensions prepared by trypsinization or treatment with non-enzymatic dissociation agents15. Cell concentration can be greater or less than 5 × 10⁵ cells/mL depending on downstream application needs. The response of PC-3 prostate cancer cells is similar in a range from 5 × 10⁴ to 5 × 105,15. However, the effects of cell concentration on viability after FSS exposure should be empirically determined.
For most applications envisioned with cultured cells, cell density should not significantly affect viscosity and therefore, the amount of FSS applied. Variables, such as the time for which the cells are held in suspension prior to FSS exposure, should be held constant across experimental replicates. As mentioned above, needle integrity is also critical. Lot variations have been noted in needles with respect to this assay over time. Hypodermic needles were designed for clinical use, not for the flow rates employed here. On rare occasions, the hub of the needle can be partially occluded, which during subsequent pulses, occludes the passage of suspension through the needle and ultimately, backflow around the syringe plunger. Further, it is very important to understand that dead/dying cells are exceptionally sensitive to FSS, as shown previously24. Therefore, if a particular cell line has a high level of dying cells, either as a routine characteristic or experimental manipulations (e.g., drug treatments), this will result in a very steep loss of cell viability that might not be completely normalized by comparison to the static control.
The application of FSS can be paired with other assays, such as immunofluorescence, pulldown assays, and western blotting, to study the effect of FSS on cancer cell biology 24. In principle, this model might also be used to explore the effects of high-level, short-duration FSS on other cell types including blood cells. Normal red blood cells and leukocytes are much more resistant to FSS applied in this way than even cancer cells, which stands to reason physiologically15. In fact, the level of FSS applied, using a 30 G ½" needle at a flow rate of 250 mL/s, brackets the range required for the disruption of the red cell membrane (based on millisecond application of force)30,31. One limitation of this model, or any that involve passing fluid through a conduit, is that the precise level of FSS that cells experience within the range from the maximum wall shear stress and the minimum at the center of the conduit is not known. Thus, at each pulse, all the cells do not experience the same level of FSS, and over repeated pulses, individual cells would be expected to experience different levels of FSS at each pulse within the range specified.
However, hydrodynamic focusing under the conditions employed in this model results in cells being directed toward the center of the flow, away from the wall, and thus toward lower FSS exposure32. Other models, such as cone and plate viscometers or Couette chambers, are better suited for the application of FSS at constant levels to a cell suspension. As mentioned above, it remains challenging to model FSS exposure of CTCs in vitro. This model is best suited to test the effects of high, but brief, exposure to FSS as might happen traversing the heart. Flow through arteries and veins results in longer exposure to lower levels of FSS. However, as mentioned, how long CTCs remain in continuous flow in the circulation is unclear, and most experimental evidence to date is consistent with short periods (seconds) of free flow punctuated by longer periods of entrapment in the microcirculation.
Models that expose cancer cells in suspension to lower levels of FSS (0.5-60 dyn/cm2) for longer durations (minutes to days) include cone and plate viscometers, Couette chambers, continuous flow loops, syringe with a tube extension, and microfluidic devices33,34,35,36,37. These have also been used to gain insights into how FSS might affect CTCs and have led to finding that exposure to FSS increases oxidative stress, cell proliferation and invasion, and stem cell-like characteristics in various cancer cell lines. It will be interesting to compare results derived from those models with the one described here. For example, using a continuous flow loop model, Xin et al. found that the ROCK-actomyosin axis promoted a loss of cell viability in cancer cell lines exposed to FSS (20 dyn/cm2) for 2-12h in stark contrast to the data described above38. Thus, biological context is very likely to matter for all of these in vitro models, reinforcing the need to translate findings about CTCs into in vivo models and ultimately, cancer patients.
The authors have nothing to disclose.
Development of the model demonstrated here was supported by DOD grant W81XWH-12-1-0163, NIH grants R21 CA179981 and R21 CA196202, and the Sato Metastasis Research Fund.
0.25% Trypsin | Gibco | 25200-056 | |
14 mL round bottom tubes | Falcon – Corning | 352059 | |
30 G 1/2" Needle | BD | 305106 | |
5 mL syringe | BD | 309646 | |
96-well black bottom plate | Costar – Corning | 3915 | |
Bioluminescence detector | AMI | AMI HTX | |
BSA, Fraction V | Sigma | 10735086001 | |
Cell Titer Blue | Promega | G8081 | |
crystal violet | Sigma | C0775 | |
D-luciferin | GoldBio | D-LUCK | |
DMEM | Gibco | 11965-092 | |
FBS | Atlanta Biologicals | S11150 | |
PBS | Gibco | 10010023 | |
Plate Reader | BioTek | Synergy HT | |
Sodium Azide (NaN3) | Sigma | S2002 | |
Syringe Pump | Harvard Apparatus | 70-3005 |