The present protocol involves the measurement and characterization of 3D shape deformation in underwater flapping fins built with polydimethylsiloxane (PDMS) materials. Accurate reconstruction of these deformations is essential for understanding the propulsive performance of compliant flapping fins.
Propulsive mechanisms inspired by the fins of various fish species have been increasingly researched, given their potential for improved maneuvering and stealth capabilities in unmanned vehicle systems. Soft materials used in the membranes of these fin mechanisms have proven effective at increasing thrust and efficiency compared with more rigid structures, but it is essential to measure and model the deformations in these soft membranes accurately. This study presents a workflow for characterizing the time-dependent shape deformation of flexible underwater flapping fins using planar laser-induced fluorescence (PLIF). Pigmented polydimethylsiloxane fin membranes with varying stiffnesses (0.38 MPa and 0.82 MPa) are fabricated and mounted to an assembly for actuation in two degrees of freedom: pitch and roll. PLIF images are acquired across a range of spanwise planes, processed to obtain fin deformation profiles, and combined to reconstruct time-varying 3D deformed fin shapes. The data are then used to provide high-fidelity validation for fluid-structure interaction simulations and improve the understanding of the performance of these complex propulsion systems.
In nature, many fish species have evolved to use a variety of body and fin motions to achieve locomotion. Research to identify the principles of fish locomotion has helped drive the design of bioinspired propulsion systems, as biologists and engineers have worked together to develop capable next-generation propulsion and control mechanisms for underwater vehicles. Various research groups have studied fin configurations, shapes, materials, stroke parameters, and surface curvature control techniques1,2,3,4,5,6,7,8,9,10,11,12. The importance of characterizing tip vortex generation and wake inclination to understand thrust generation in single- and multi-fin systems has been documented in numerous studies, both computational and experimental13,14,15,16,17,18. For fin mechanisms made of compliant materials, shown in various studies to reduce wake inclination and increase thrust17, it is also essential to capture and accurately model their deformation time-history to pair with the flow structure analysis. These results can then be used to validate computational models, inform fin design and control, and facilitate active research areas in unsteady hydrodynamic loading on flexible materials, which need validation19. Studies have used direct high-speed image-based shape tracking in shark fins and other complex objects20,21,22, but the complex 3D fin shape often blocks optical access, making it difficult to measure. Thus, there is a pressing need for a simple and effective method to visualize flexible fin motion.
A material widely used in compliant fin mechanisms is polydimethylsiloxane (PDMS) due to its low cost, ease of use, ability to vary stiffness, and compatibility with underwater applications23, as described extensively in a review by Majidi et al.24. In addition to these benefits, PDMS is also optically transparent, which is conducive to measurements using an optical diagnostic technique such as planar laser-induced fluorescence (PLIF). Traditionally within experimental fluid mechanics25, PLIF has been used to visualize fluid flows by seeding the fluid with dye or suspended particles or taking advantage of quantum transitions from species already in the flow that fluoresce when exposed to a laser sheet26,27,28,29. This well-established technique has been used to study fundamental fluid dynamics, combustion, and ocean dynamics26,30,31,32,33.
In the present study, PLIF is used to obtain spatiotemporally resolved measurements of shape deformation in flexible fish-inspired robotic fins. Instead of seeding the fluid with dye, the underwater kinematics of a PDMS fin are visualized at various chordwise cross-sections. Although planar laser imaging can be performed on regular cast PDMS without additional fluorescence, modifying PDMS to enhance fluorescence can improve the signal-to-noise ratio (SNR) of the images by reducing the effects of background elements, such as the fin mounting hardware. PDMS can be made fluorescent by employing two methods, either by fluorescent particle seeding or pigmentation. It has been reported that, for a given part ratio, the former alters the stiffness of the resultant cast PDMS34. Therefore, a nontoxic, commercially available pigment was mixed with transparent PDMS to cast fluorescent fins for the PLIF experiments.
To provide an example of using these fin kinematics measurements for computational model validation, the experimental kinematics are then compared with values from the coupled fluid-structure interaction (FSI) models of the fin. The FSI models used in the computations are based on the first seven eigenmodes computed using the measured material properties for the fins. Successful comparisons validate fin models and provide confidence in using the computational results for fin design and control. Further, the PLIF results demonstrate that this method can be used to validate other numerical models in future studies. Additional information about these FSI models can be found in prior work35,36 and in fundamental texts of computational fluid dynamics methods37,38. Future studies can also allow for simultaneous measurements of solid deformations and fluid flows for improved experimental studies of FSI in robotic fins, bioinspired soft robots, and other applications. Furthermore, because PDMS and other compatible elastomers are widely used in various fields, including sensors and medical devices, visualizing deformations in flexible solids using this technique can benefit a larger community of researchers in engineering, physics, biology, and medicine.
1. Fin fabrication
2. Experimental setup and trials
3. Image analysis
4. Reconstruction of 3D deflection
A trapezoidal fish-inspired artificial pectoral fin was cast in two different materials (PDMS 10:1 and 20:1, both mixed with fluorescent dye) out of a mold, each with a rigid leading-edge spar inserted into the leading quarter chord (Figure 2 and Figure 3). Tensile testing of the two fin materials (Figure 3) yielded elastic moduli of 0.38 MPa and 0.82 MPa for the PDMS 20:1 and PDMS 10:1 fins, respectively, with an R2 of 0.99 for both measurements (see Supplementary Figure 2 for the corresponding stress-strain curves).
To capture the motion of the fin, the camera was placed such that the micrometer-to-pixel ratio in the focused field of view was 125 µm/pixel. A delay generator was wired and programmed to trigger the laser and camera at 30 equally spaced time intervals per fin stroke based on a single trigger signal at the midpoint of each fin stroke. The fin was positioned such that the laser sheet passed through a chordwise section of the fin. This was done for eight spanwise positions from 1.876 cm to 13.132 cm from the root of the fin geometry (Figure 2).
For each cross-section, 200+ images were obtained for each of 30 stroke positions (phases). The programmed kinematics yielded a stroke amplitude of ±43° and a pitch amplitude of ±17° (Figure 7A,B). Due to the opaque rigid spar, the fin cross-section was not visible at every time step (Figure 6), but these occlusions were sparse and did not affect the overall 3D reconstructions. Following the image sorting, averaging, thresholding, binarization, and tracing, a 3D representation was constructed. This 3D reconstruction was compared with the results of the FSI model and the structure of a rigid fin model. The LE position in the flexible cases was assumed to be the same as that of the LE in the rigid fin for the same shape. However, the substantial reduction in the overall stiffness going from the rigid to the soft fin resulted in spanwise loading, adding a non-negligible deflection along with the LE for the present design.
Figure 7C,D illustrates these comparisons at two positions in the stroke, one in the middle of the upstroke (t = 0 s) and one in the middle of the downstroke (t = 0.567 s). The figure demonstrates the chordwise curvature induced by fluid pressure on the PDMS 10:1 fin, leading to a mean normalized chord displacement of the trailing edge at the longest chord section of displacement/chord (d/c) = 0.36 in mid upstroke and d/c = 0.33 in the mid downstroke, as measured in the experiments. This compares with d/c = 0.44 in mid upstroke and d/c = 0.39 in mid downstroke from the CFD simulations with the FSI model. The results also demonstrate some spanwise deflection along the leading edge in the experiments, which was not modeled for the simulations.
Further comparisons were made between the shape deformations of the PDMS 10:1 and PDMS 20:1 fins (Figure 8A). At the middle of upstroke (t = 0 s,) the trailing edge displacement at the longest chord section was measured as d/c = 0.36 for the PDMS 10:1 fin and d/c = 0.51 for the PDMS 20:1. Finally, Figure 8B shows the reconstructed 3D fin shapes from the PLIF, FSI, and rigid cases in the mid-upstroke (t = 0.567s). This demonstrates the capability of the present technique to provide high-fidelity validation for FSI simulations.
In addition to measurements of the deformation time-history, as detailed previously, direct measurements of thrust and mechanical power provide valuable data for analyzing fin propulsive performance. For the kinematics presented, the PDMS 10:1 fin produced a stroke averaged thrust of Fx = 0.51 N, measured with a strain gauge load cell, and an average total power of Pm = 2.38 W, measured with current and voltage sensors. Thrust and hydrodynamic power computed from the CFD simulation for the PDMS 10:1 field yielded Fx = 0.50 N and Ph = 0.49 W. The PDMS 20:1 fin produced an experimentally measured stroke averaged thrust of Fx = 0.48 N and an average power of Pm = 2.30 W. The hydrodynamic power comprised approximately 20% of the total power, while mechanical losses in the motor were a larger contributor to power consumption. As such, the differences in hydrodynamic power and efficiencies could have varied significantly between fins of different material properties, but the total power remained relatively consistent.
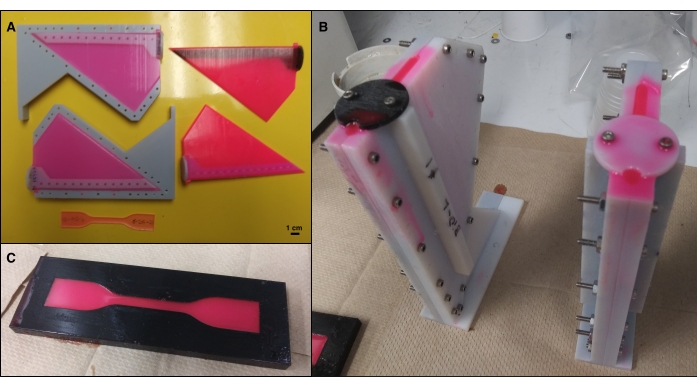
Figure 1: Custom plastic molds to cast the fins (A and B) and tensile test specimens (C). The molds and rigid spars for the fins were 3D printed in rigid plastic (black and gray), and the fins and tensile test specimens were cast from PDMS mixed with a fluorescent dye (pink). Please click here to view a larger version of this figure.
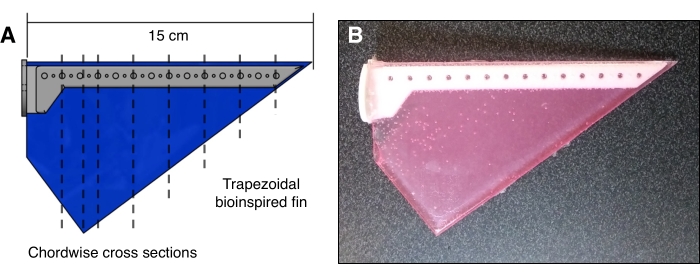
Figure 2: Bioinspired fin planform geometry used in experiments. (A) CAD model illustrating the rigid spar (gray) and PDMS fin (blue), with dashed black lines indicating the chordwise cross-sections used in planar laser-induced fluorescence (PLIF) experiments. (B) Fluorescent PDMS fin (pink) with a rigid plastic spar (white). Please click here to view a larger version of this figure.
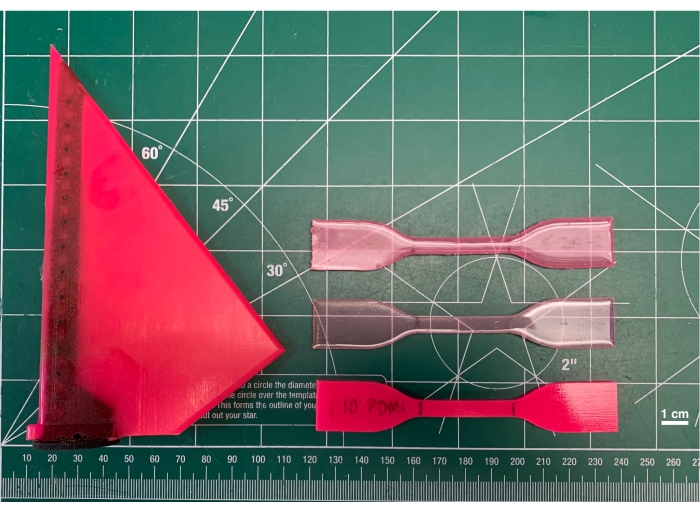
Figure 3: Example of a finished fin and tensile testing specimens. Mold-casted PDMS fin with a black rigid spar (left) and three examples of Type IV specimens (right) for tensile testing to obtain the material properties of each batch of fluorescent PDMS. Please click here to view a larger version of this figure.
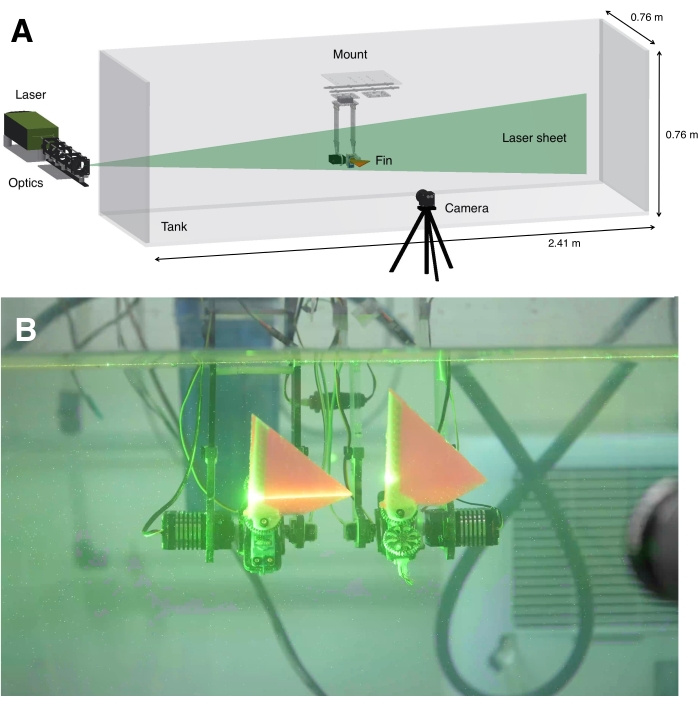
Figure 4: Experimental setup. (A) 3D CAD view of the experimental setup with the laser and optics, green laser sheet, tank, fin mounted to a platform, and camera. (B) An example image showing the mounted fins in the tank, with the laser turned on and a camera visible on the far right. Although two fins are shown in this tandem fin setup, which can obtain the kinematics for future studies of fin-fin interactions, PLIF measurements were recorded for only the front fin in this study. Furthermore, the image contains ambient light to visualize the setup, but the ambient lights were turned off during all experiments to improve the signal-to-noise ratio. Please click here to view a larger version of this figure.
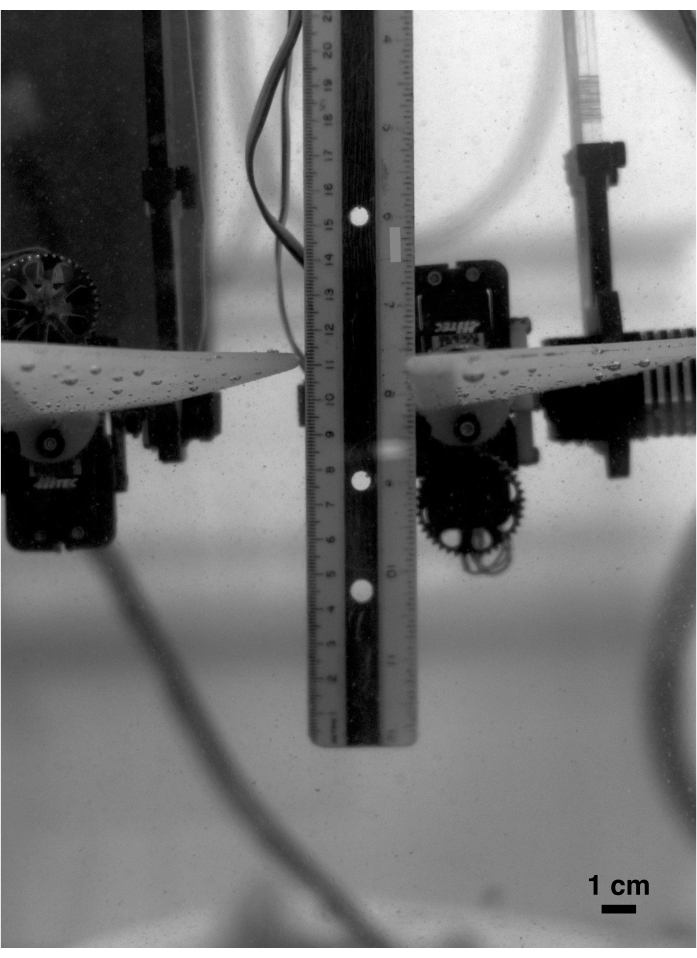
Figure 5: Calibration image. Before running the experiments, calibration images were obtained using a standard ruler to measure the micrometer-to-pixel ratio. Please click here to view a larger version of this figure.
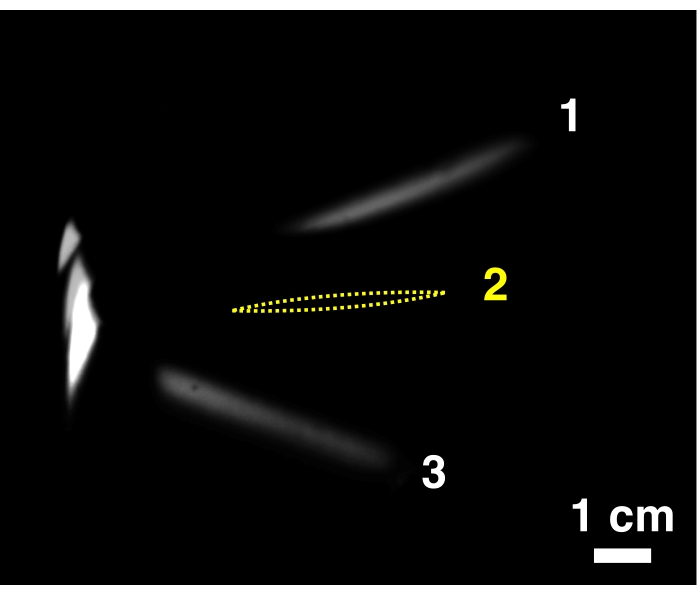
Figure 6: Fin images of three time steps overlaid, with a representative example of fin occlusion at one time step. The fin cross-section is visible in Steps 1 and 3, whereas the opaque rigid spar occludes the fin at Step 2, where an estimate of the fin position is drawn in yellow. Please click here to view a larger version of this figure.
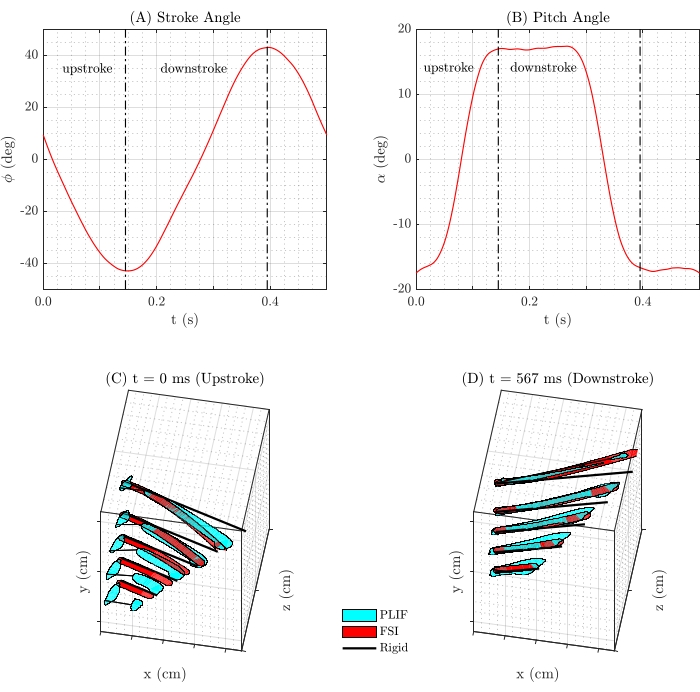
Figure 7: Fin kinematics. (A) The stroke amplitude (±43°) and (B) pitch amplitude (±17°) of the fin kinematics over time. A comparison of the PDMS 10:1 fin (light blue), FSI data of the PDMS 10:1 fin (red), and rigid fin (black) to illustrate the difference in fin positions at two time-steps in the (C) upstroke and (D) downstroke. Please click here to view a larger version of this figure.
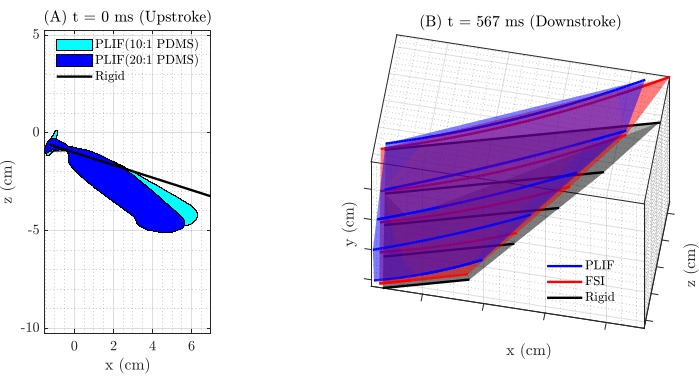
Figure 8: Comparison of fin deformation. (A) A comparison of the PLIF method of obtaining fin kinematics at one example time-step to demonstrate the effects of stiffness on fin deformation. The PLIF measurement for the more compliant 20:1 PDMS fin (dark blue) shows more deformation than the more rigid 10:1 PDMS fin (light blue), and both show substantial differences from a rigid fin (black). (B) 3D reconstructed fin shapes from the PLIF for 10:1 PDMS, FSI for 10:1 PDMS, and rigid cases at one example time-step to compare the surface fits. Please click here to view a larger version of this figure.
Supplementary Figure 1: Software interface for the delay generator. The user interfaces for software to control the delay generator, with settings to produce PLIF images at 30 Hz by coordinating the timing of the two laser heads and camera with the fin trigger. Please click here to download this File.
Supplementary Figure 2: Tensile test results for PDMS. Stress-strain curves for two mixes of PDMS (20:1, a more flexible mix with an elastic modulus of 0.38 MPa, and 10:1, a more rigid mix with an elastic modulus of 0.82 MPa). Please click here to download this File.
Supplementary Coding File 1: "Assembly2.stl" is an assembly of files to 3D print the custom fin molds. Please click here to download this File.
Supplementary Coding File 2: "SimpleFin-AR3Bio-soft-v2-fin2c.stl" is the STL file to print the fin insert, a rigid portion of the fin that serves as the attachment to the servo. Please click here to download this File.
Supplementary Coding File 3: "SimpleFin-AR3Bio-soft-v2b-moldL.stl" is the left half of the 3D print mold for the flexible fin. Please click here to download this File.
Supplementary Coding File 4: "SimpleFin-AR3Bio-soft-v2b-moldR.stl" is the right half of the 3D print mold for the flexible fin. Please click here to download this File.
Supplementary Coding File 5: "ASTM-TestPiece-Mold-v2b-TypeIV_Flat_DIN53504.stl" is the 3D print mold to create Type IV specimens for tensile testing. Please click here to download this File.
Planar laser-induced fluorescence is typically used to visualize aqueous flows by seeding the fluid with dye, which fluoresces when exposed to a laser sheet25,26. However, using PLIF to visualize deformations in compliant materials has not been previously reported, and this study describes an approach for obtaining time history measurements of high-resolution shape deformation in flexible solid fins using PLIF. Comparing these fin measurements with FSI simulations validates the numerical models and provides further confidence in using computational results for fin design and control.
Among the limitations of PLIF for compliant materials, deformation characterization includes occlusion due to opaque elements in the structure (the leading-edge rigid spar in this study). Additionally, the PLIF technique is affected by total internal reflection (TIR), which occurs when the local incidence angle of the light at the PDMS-water interface exceeds the associated critical value. Although the cast PDMS fins are optically transparent, they have a much higher refractive index (1.49) than water (1.33), leading to optical distortion and occlusion with a critical angle of 63.5°. Therefore, when there is a large deformation (e.g., near the ends of the fins in the present study), the local incidence angle may exceed 63.5°. Consequently, the incident laser beam is reflected back into the fin, resulting in a much larger "fluorescent area" on the captured image, which affects the image quality and shapes detected from this technique. One method to resolve this issue for future studies is to use an optical index-matched working fluid, such as sodium iodide (NaI) solution40. However, this is deemed out of scope for the present study as this issue does not affect most fin cross-sections.
When optical index matching is not feasible, the concentration of fluorescent pigment during casting may be adjusted to mitigate this effect. Higher concentrations of the fluorescent dye can improve the SNR, but if there is too much pigment and the curvature (deflection) of the fin is high, the effect of the internal reflection can be too strong. This can cause image dilation for those profiles. In addition, strong considerations should be made to determine the optimum laser incidence angle with respect to the expected dominant deflection (if any) to minimize the effect of internal reflections. To illustrate, the cross-sectional profiles vary for the up and down strokes. In the latter, as the light refracted through the LE-side of the fin, it underwent multiple internal reflections at subsequent chordwise locations, making the profile shape significantly dilated. For the upstroke, the incident light did not interact with the rigid or flexible parts of the fins more than once, resulting in a crisp profile. This variation precludes a general profile mask from being algorithmically generated, as the extent of transmission and reflection varies during the stroke cycle as well. Although the image analysis considers a dynamic threshold to address this, it is still challenging to generate a cross-sectional envelope automatically.
The concave surface is more prone to internal reflections than the convex side. Hence, an alternative approach for obtaining a more accurate centerline profile was explored by offsetting the convex surface by the half-mean fin thickness. However, the resultant profile did not vary significantly compared to that obtained by the least-square fit.
Furthermore, the tensile testing and subsequent curve fitting assume a linear stress-strain relationship for small strains39. However, this assumption is not valid for larger deformations, affecting the calculated eigenfrequencies used as inputs to the FSI model. Efforts to obtain a more accurate FSI prediction by accounting for such nonlinear effects are deemed out of the present scope but relevant for future studies.
Thus, this study has demonstrated the effect of fin stiffness on bioinspired robotic fins and validated the computational models. Pairing these measurements of solid deformations with the simultaneous measurement of fluid flows as described in other PLIF studies25, future studies will improve the experimental analysis of FSI in robotic fins, bioinspired soft robots, and other applications by integrating dyes that fluoresce at various wavelengths and multiple cameras. Due to the wide use of PDMS in other research fields24, this PLIF technique of visualizing deformations in flexible solids has the potential to benefit communities of researchers in engineering, physics, biology, and medicine.
The authors have nothing to disclose.
This research was supported by the Office of Naval Research through a US Naval Research Laboratory (NRL) 6.2 base program and performed while Kaushik Sampath was an employee of the Acoustics Division at NRL and Nicole Xu held an NRC Research Associateship award in the Laboratories for Computational Physics and Fluid Dynamics at NRL. The authors would like to acknowledge Dr. Ruben Hortensius (TSI Inc.) for technical support and guidance.
ADMET controller | ADMET | MTESTQuattro | |
Axon II | Society of Robots | Microcontroller for the fin hardware | |
Berkeley Nucleonics Delay Generator | Berkeley Nucleonics Corp | Model 525 | BNC delay generator and software |
BobCat Cam Config | Imperx | Camera settings software | |
CCD camera | Imperx | B2340 | 4 MegaPixel |
COMSOL | COMSOL Inc | Commercial structural dynamics software for fluid-structure interaction modeling | |
D646WP Servo | Hitec | 36646S | 32-Bit, Digital, High Torque, Waterproof Servo for the fin pitch rotation |
D840WP Servo | Hitec | 36840S | 32-Bit, Multi Purpose, Waterproof, Steel Gear Servo for the fin stroke rotation |
Electric Pink fluorescent pigment | Silc Pig | PMS812C | |
EverGreen (532 nm dual pulsed Nd:YAG laser system) | Quantel | EVG00070 | Laser head and power supply, 70 mJ |
Force transducer | ADMET | SM-10-961 | 10 lbf load cell |
FrameLink Express | Imperx | Camera capture software | |
Longpass fluorescence filter | Edmund Optics | 560 nm | |
MATLAB | MathWorks | Software for image analysis | |
Planetary centrifugal mixer | THINKY MIXER | AR-100 | |
Silicone rubber compounds | Momentive | RTV615 | Clear PDMS |
Stratasys J750 | Stratasys | 3D printer, polyjet | |
Universal testing machine | ADMET | eXpert 2611 | Table top model |
VeroBlack | Stratasys | 3D printer material to build the molds | |
VeroGray | Stratasys | 3D printer material to build the molds |