Caenorhabditis elegans is a powerful model to examine the molecular determinants driving host-microbiome interactions. We present a high throughput pipeline profiling the single animal levels of gut microbiome colonization together with key aspects of the C. elegans physiology.
The composition of the gut microbiome can have a dramatic impact on host physiology throughout the development and the life of the animal. Measuring compositional changes in the microbiome is crucial in identifying the functional relationships between these physiological changes. Caenorhabditis elegans has emerged as a powerful host system to examine the molecular drivers of host-microbiome interactions. With its transparent body plan and fluorescent-tagged natural microbes, the relative levels of microbes within the gut microbiome of an individual C. elegans animal can be easily quantified using a large particle sorter. Here we describe the procedures for the experimental setup of a microbiome, collection, and analysis of C. elegans populations in the desired life stage, operation, and maintenance of the sorter, and statistical analyses of the resulting datasets. We also discuss considerations for optimizing sorter settings based on the microbes of interest, the development of effective gating strategies for C. elegans life stages, and how to utilize sorter capabilities to enrich animal populations based on gut microbiome composition. Examples of potential applications will be presented as part of the protocol, including the potential for scalability to high-throughput applications.
Animal evolution is under constant microbial influence1. From diverse microbes in the environment, animal hosts acquire specific partners2 that extend the capabilities of the host and drive its physiology and susceptibility to disease3. For example, metagenomic analyses of the gut microbiome uncovered enriched metabolic classes of microbial genes that may confer greater energy harvest and storage in obese mice4, many of which are also found in the human gut microbiome5. There is still a great need to establish causal relationships and pinpoint the molecular determinants of the microbiome impact, though progress has been hampered by the microbiome complexities and tractability of host systems to large-scale screening.
The model organism C. elegans provides a platform to advance molecular understanding of links between microbiome and host physiology. C. elegans possesses 20 intestinal cells with a mucosal layer and villi structures. These cells are equipped with abundant chemoreceptor genes that sense microbial products and produce antimicrobial molecules that potentially regulate their gut colonizers6,7. This conserved biology of C. elegans has led to a tremendous number of discoveries in host signaling that regulate gut microbes, including insulin signaling, TGF-beta, and MAP Kinase8,9,10.
C. elegans utilize microbes as both their diet for growth during development and microbiome as adults. With old age, some microbes may over-accumulate in the gut lumen and the host-microbe relationship shifts from symbiosis to pathogenesis11. In their natural habitats, C. elegans encounters a wide array of bacterial species12,13. Sequencing 16S rDNA from representative samples collected in natural habitats (rotten fruits, plant stem, and animal vectors) revealed that the natural microbiome of C. elegans is dominated by four bacterial phyla: Proteobacteria, Bacteroidetes, Firmicutes, and Actinobacteria. Within these divisions lies great variation in the diversity and richness of bacteria based on the habitat12,13,14,15. Several defined communities have been established, including the 63-member (BIGbiome)16 and 12-member (CeMbio) collections representing the top microbiome genera created for the C. elegans research community17. Both microbiomes and component strains can have a diverse impact on the physiology of C. elegans such as body size, growth rates, and stress responses9,16,17. These studies provide resources and examples to establish C. elegans as a model for microbiome research.
Here a large particle sorter (LPS) based workflow (Figure 1) is presented that utilizes the C. elegans system to simultaneously measure microbiome composition and basic measures of host physiology at the population scale. From the microbial side, the workflow is adaptable to assemble a defined microbiome or single microbes to test the robustness and plasticity of the community with increasing microbial interactions. From the host side, the workflow enables high throughput assays to measure colonization levels of fluorescent microbes in the microbiome and host physiological readout in terms of development, body size, and reproduction. Taken together, the C. elegans microbiome model enables high throughput screens to pinpoint the metabolic and genetic determinants modulating host physiology.
1. Preparation of microbiome mixture
2. Preparation of synchronized C. elegans for growth on the microbiome
3. Collecting worm population for gut microbiome analyses
4. Setting up the large particle sorter and autosampler
5. Analysis of C. elegans features and gut microbiome levels per animal
6. Sorting of C. elegans animals by gut microbiome features
Defining adult and larvae population gates
Here, synchronized C. elegans L1s were grown on an NGM plate seeded with E. coli OP50 (Eco), a standard laboratory diet. C. elegans populations were collected for LPS analysis after 96 h or 120 h of growth at 20 °C (Figure 2A). A dot plot of extinction (EXT, a proxy of body density) versus time-of-flight (TOF, a proxy of body length) creates two visually separated clouds of animals. Each dot represents a single animal where higher EXT and TOF values are observed from adults compared to larvae (Figure 2B). These two parameters are valuable inferences for population growth and physiology. For example, a density plot of larvae TOF can visualize the distribution of larval stages. Progenies from 2-day-old adults were dominated by L1 and L2 stages with a TOF below 200, while most progenies from 3-day-old adults reached L3 and L4 stages (Figure 2C). Additionally, 2D density and box-whisker plots are useful to visualize changes in adult body size and density since values of TOF and EXT increase on Day 3 compared to Day 2 when grown on E. coli (Figure 2D–F). This relationship is typically a linear one during adulthood, but some changes in physiology may impact one feature more than another (e.g., adults without eggs may have lower EXT values without affecting TOF).
Profiling gut microbiome composition using fluorescently tagged microbes
In order to illustrate different levels of colonization, we compare a dominant colonizer of the natural C. elegans microbiome dTomato-tagged Ochrobactrum BH3 (Och) and green fluorescent protein (GFP)-tagged E. coli OP50. These two were seeded individually and in an equal mixture based on OD (1:1 mix) on the NGM plate. Synchronized C. elegans L1s were grown on the three conditions and collected at 120 h to examine colonization dynamics in 3-day-old adults (Figure 3A). 2D density and box-whisker plots showed that there are differences in adult TOF and EXT values when C. elegans is grown on Ochrobactrum BH3 and mix cultures (Figure 3B–E). Gut colonization of bacteria can be inferred by the fluorescence level detected in the individual nematodes. Box-whisker plots of red fluorescent readings show increased Ochrobactrum BH3 colonization in the mix condition than in Ochrobactrum BH3 alone. In contrast, green-fluorescent values indicate lower OP50 colonization in the mix condition than in OP50 alone. Similar trends are observed in TOF-normalized fluorescent signals, which removes the effect of body size and reduces variation within the population (Figure 3F–I). For a defined microbiome with multiple fluorescent-tagged microbes, a dot plot can illustrate colonization patterns for these microbes. For example, in the two-member mix microbiome, a dot plot of red fluorescent protein (RFP) versus GFP channels shows that worms are heavily skewed toward the y-axis (RFP), suggesting OP50 colonization is low in most worms while levels of Ochrobactrum BH3 colonization are evenly distributed in the population (Figure 3J). Similarly, a dot plot of RFP versus EXT can reveal the relationship between Ochrobactrum BH3 colonization levels and host development such as body density (Figure 3K). In addition, the differences in reproduction patterns can be observed by plotting the density plot of the respective larvae population on the three conditions (Figure 3L).
Enrichment for targeted populations based on microbiome colonization
The 3-day-old adults grown on the two-member mix microbiome exhibit a wide range of RFP intensity, indicating individual variations in Ochrobactrum BH3 colonization within the group (Figure 4A). To further separate these sub-groups, sorting gates for high and low RFP were manually drawn to sort 15 individuals from each gate into a 96-well plate, as shown by the RFP image of the whole well (Figure 4B). Under higher magnification, overlay images of bright fields and RFP channels confirm that the sorting method selects high and low Ochrobactrum BH3-colonized worms, which allows for further characterization of phenotypic consequences and molecular drivers (Figure 4C).
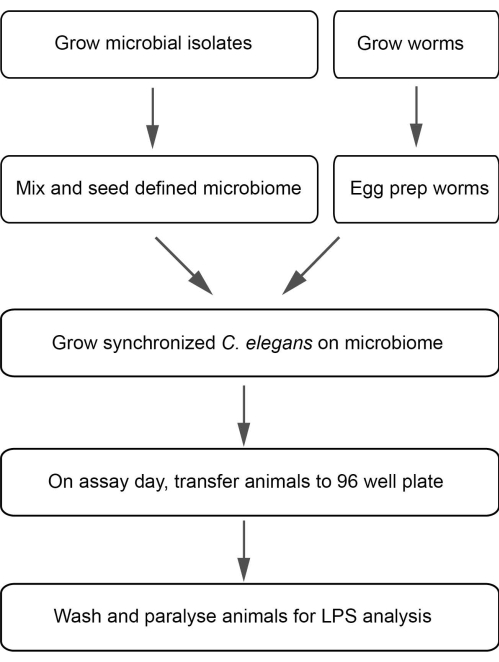
Figure 1: A flow chart for flow vermimetry-based methods to assess gut microbiome and host physiology. Please click here to view a larger version of this figure.
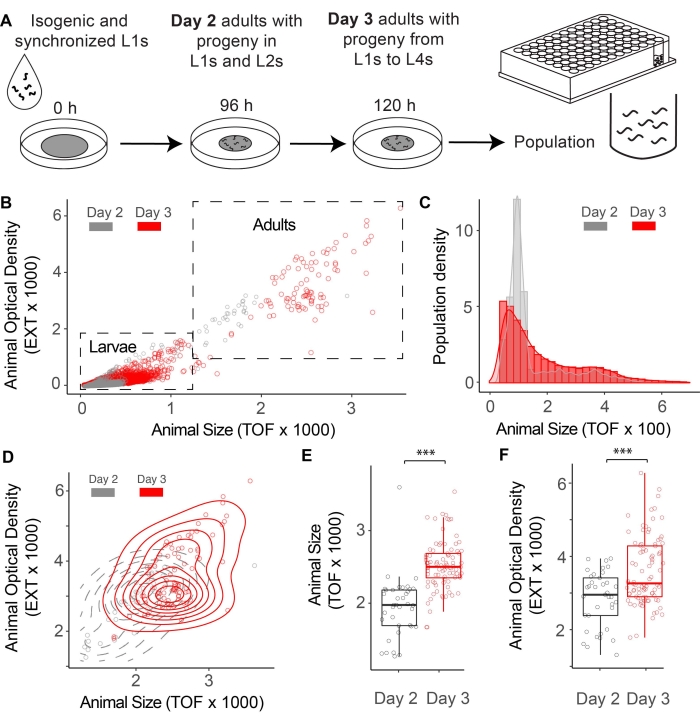
Figure 2: Defining adult and larvae populations. (A) A workflow to collect C. elegans populations on Day 2 and Day 3 of adulthood. (B) Dot plot of time-of-flight (TOF) versus extinction (EXT) for C. elegans populations on Day 2 (Gray) and Day 3 (Red) of adulthood. (C) Density plot of larvae TOF on Day 2 and Day 3 of adulthood. (D–E) Dot and box-and-whisker plots of TOF versus EXT for adults on Day 2 and Day 3 of adulthood. (F) Box-and-whisker plot of adult extinction on Day 2 and Day 3 of adulthood. P-values were calculated with the student's t-test (*** p < 0.001; Day 2 n = 38; Day 3 n = 88). Please click here to view a larger version of this figure.
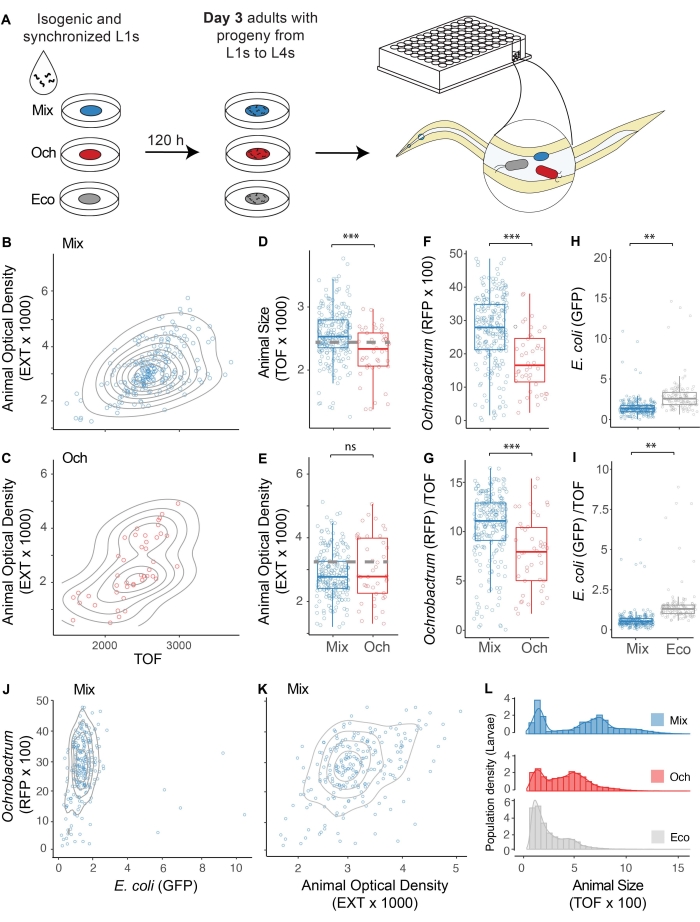
Figure 3: Profiling gut microbiome colonization using fluorescent-tagged microbes. (A) Collection of 3-day-old adult populations grown on Ochrobactrum BH3 (dTomato-expressing; Och), E. coli OP50 (GFP-expressing; Eco) or a 1:1 mix of the two bacteria (mix). (B) Dot plot of TOF versus EXT for Day 3 adults grown on the Mix. (C–E) Dot and box-and-whisker plots of TOF versus EXT for 3-day-old adults grown on Ochrobactrum BH3. Gray dash lines indicate the mean value of the population grown on OP50. (F–G) Box-and-whisker plot of raw and TOF-normalized dTomato (RFP) values for 3-day-old adults grown on Mix and Ochrobactrum BH3 alone. (H–I) Box-and-whisker plots of raw and TOF-normalized GFP for 3-day-old adults grown on mix and OP50. (J) Dot plot of Ochrobactrum BH3 (RFP) versus E. coli OP50 (GFP) for 3-day-old adults grown on mix. (K) Dot plot of RFP versus EXT for 3-day-old adults grown on mix. (L) Density plot of larvae from 3-day-old adults grown on mix, Ochrobactrum BH3, and OP50. All P-values were generated from student's t-test (*** p < 0.001; ** p < 0.01; n.s., not significant; mix n = 230; Och n = 45). Please click here to view a larger version of this figure.
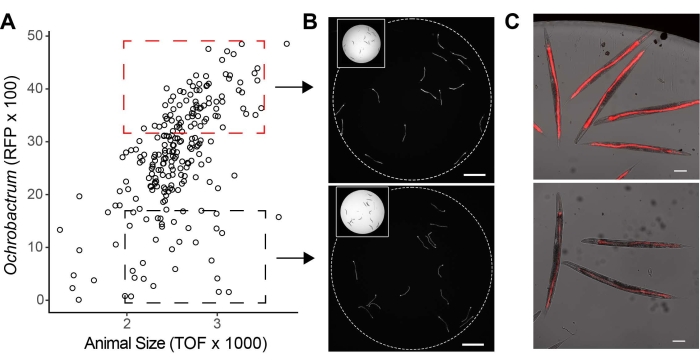
Figure 4: Enrich targeted populations based on microbiome colonization. (A) Dot plot of TOF versus RFP (Ochrobactrum BH3) for 3-day-old adults. High (red box) and low (black box) RFP gates are drawn to enrich C. elegans with high and low Ochrobactrum BH3 colonization. (B) Representative RFP images (4x) of the wells containing 15 sorted worms from high and low RFP gates (Bar = 1 mm). (C) Representative images (10x) of individual worms from high and low RFP gates (Bar = 100 µm). Please click here to view a larger version of this figure.
Supplementary File 1: Representative dataset generated by large particle sorter for N2 populations in Day 2 and Day 3 adulthoods grown on E. coli OP50 and Ochrobactrum BH3. Please click here to download this File.
Supplementary File 2: Scripts used in the analysis and figure generation of representative dataset in the R environment. Please click here to download this File.
Flow vermimetry has been used to characterize C. elegans genes and pathways against pathogen colonization and toxicity in several studies21,22. Here, a high throughput amenable approach is presented that uses C. elegans to investigate how intestinal microbiomes modulate their host physiology. Compared to existing methods using colony forming units (CFU) or 16S rRNA amplicon sequencing9,16,17,23,24, this approach does not require labor-intensive counting or introduce potential PCR bias. In addition to measuring microbiomes in a whole population, this approach allows users to visualize individual variations within the population. This approach is limited only by the availability of fluorescent protein expression or staining of microbes and the number of detection channels in the LPS. Additional considerations for experimental design are discussed below so that users can create a customized workflow based on their needs.
Considerations for creating and seeding a defined microbiome
First, each bacterial culture is normalized to an OD600 value of 1 before mixing different strains. It is worth noting that, depending on the complexity of the community and the interspecies relationships, the starting density can have various impacts on the established microbiome composition23. While OD can be easily measured by spectrophotometers, one caveat is that different bacteria will have different concentrations (e.g., the number of cells per mL) for the same OD value and should be adjusted accordingly. Second, variation in microbiome composition in lawns should be accounted for. Once the microbiome is seeded on the NGM plate (or other media), the microbiome is allowed to grow overnight at room temperature before dropping synchronized L1 C. elegans populations onto the plates. Due to variations in growth rates and interspecies interactions among bacterial strains, microbiomes grown on NGM plates or any plate with substrates for growth will differ in composition from the original seed mixture. Using a peptone-free NGM plate can preserve the original microbial community13. However, due to limited microbiome growth on the peptone-free plate, a higher seeding OD or a reduced number of synchronized L1s per plate may be needed. This prevents the population from starving before reaching the desired age for assay. Another approach is to sequence or otherwise determine the proportion of microbes in the lawn.
Measuring microbiome colonization and C. elegans physiology
First, the extinction (EXT) and time-of-flight (TOF) gating thresholds for adults may vary based on age, C. elegans strain background, and the microbes on which they are grown. Having a 1-day-old adult population in the experiment for each worm/bacterial condition can be useful to determine the TOF and extinction cutoffs as well as to control the variation due to growth media and environment. Besides gating for adults, TOF and EXT can be applied to gate for larvae, and a density plot of the progeny can estimate the timing and output of reproduction at the population level (Figure 3L). Second, PMT gains and voltage on the LPS need to be adjusted to maximize the signal-to-noise ratio and set the signal range to avoid saturation. This is dependent upon the fluorescent intensity of the bacterial strains and their colonization levels. Default PMT at 350 works well for high colonizers such as Ochrobactrum BH3, but users may need to increase PMT or voltage values for low colonizers such as E. coli OP50. Third, due to differences in the properties of the fluorophores and their levels of expression in transgenic bacterial strains, fluorescent values do not reflect the absolute number of bacteria present in the microbiome. Therefore, GFP and RFP values cannot be used to compare colonization between two different fluorescent microbes directly. Disruption and plating of animals to identify live bacterial counts can help to better resolve these relationships24.
Potential applications for enrichment-based strategies
This method provides an amenable high throughput platform to investigate the impact of microbiome changes on host physiology at a population level. On the microbial side, the increasing availability of tools and resources to edit bacterial genomes25,26,27 will increase the number of fluorescent and functional microbial mutants related to the C. elegans natural microbiome. From the host side, numerous fluorescent reporters are available to explore the link between cell signaling and microbiome composition. The ability to enrich a host population or mutant from a mutagenized population (e.g., EMS forward mutagenesis)28 or pooled wild strains29, with specific microbiome colonization features can greatly advance the ability to connect host genes that regulate the microbiome impact. Furthermore, the selection of populations based on host and/or microbiome characteristics can facilitate a cadre of omics-based profiling modalities as well. This approach has great flexibility and promises to advance the understanding of the molecular mediators of host-microbiome interactions.
The authors have nothing to disclose.
This work was supported by NIH grants DP2DK116645 (to B.S.S.), Dunn Foundation pilot award and NASA grant 80NSSC22K0250 (to B.S.S.). This project was also supported by the Cytometry and Cell Sorting Core at Baylor College of Medicine with funding from the CPRIT Core Facility Support Award (CPRIT-RP180672), the NIH (S10 OD025251, CA125123, and RR024574), and the assistance of Joel M. Sederstrom, plus an instrumentation grant for the LPS NIH grant (S10 OD025251). Some strains were provided by the CGC, which is funded by NIH Office of Research Infrastructure Programs (P40 OD010440).
15 mL conical bottom centrifuge tubes | VWR | 10026-076 | |
96 deep-well plates (1 mL) | Axygen | P-DW-11-C | |
96 deep-well plates (2 mL) | Axygen | P-DW-20-C | |
96-well Costar plate | Corning | 3694 | |
Agar | Millipore Sigma | Standard bacteriology agar is also sufficient. | |
Aspirating manifold | V&P scientific | VP1171A | |
Bleach | Clorox | ||
Bleach solution | Mix Bleach with 5M Sodium hypochlorite 2:1 (v/v) | ||
Cell Imaging Multimode Reader | Biotek | Cytation 5 | Bacterial OD measurement |
Centrifuge | Thermo scientific | Sorvall Legend XTR | For 96 well plate and conical tubes |
Fluorescent Microscope | Nikon | TiE | |
ggplot: Various R Programming Tools for Plotting Data. | R package | Version 3.3.2 | |
Large Particle Autosampler | Union Biometrica | LP Sampler | |
Large Particle Sorter | Union Biometrica | COPAS Biosorter | |
Levamisole | Fisher | AC187870100 | |
Lysogeny Broth (LB) | RPI | L24066 | Standard LB home-made recipes using Bacto-tryptone, yeast extract, and NaCl are also sufficient. |
M9 solution | 22 mM KH2PO4 monobasic, 42.3 mM Na2HPO4, 85.6 mM NaCl, 1 mM MgSO4 | ||
Nematode Growth Medium | RPI | N81800-1000.0 | 1 mM CaCl2, 25 mM KPO4 pH 6.0, 1 mM MgSO4 added after autoclaving. |
RStudio | GNU | Version 1.3.1093 | |
Sodium hypochlorite | Sigma-Aldrich | 5M NaOH | |
Stereo Microscope | Nikon | SMZ745 | |
Sterile 10 cm diameter petri dishes | Corning | 351029 | |
Sterile 12-well plates | VWR | 10062-894 | |
Sterile 24-well plates | VWR | 10062-896 | |
Sterile 6 cm diameter petri dishes | Corning | 351007 | |
Triton X-100 | Sigma-Aldrich | T8787 |