The Bohr Model
Niels Bohr proposed a model for the hydrogen atom in 1913 that described discrete energy states are associated with a fixed electron orbit around the nucleus. Importantly, an atom cannot discharge energy while its electrons are in stationary states. An electron can only emit energy by changing energy states. To change energy states, an electron must move from one orbit to another by either absorbing or emitting energy. This change can only occur if the absorbed or emitted energy equals the difference between the two states. Electrons cannot exist between orbits.
The quantum number, n, is used to label the different energy states. The lowest energy state is the ground state, which is n equal to one. The excited states are labeled n equal to 2, 3, 4, and so on. When an electron at the ground state absorbs a photon whose energy equals the difference between the ground and second state, the electron becomes excited and transitions from the ground state to the n= 2 excited state. If the energy of the photon equals the difference between the ground and third state, the electron moves to the n=3 state.
According to Bohr’s model, the potential energy of an electron in the nth level can be calculated using the following equation:

where En is the potential energy, R is the Rydberg constant (1.0974 × 10⁷ m-1), h is Planck's constant (6.62607004 × 10⁻³⁴ m2·kg/s), and c is the speed of light (~ 3 × 10⁸ m/s). Electrons can also spontaneously return to the ground state or any other lower excited state. When this happens, the excess energy is released in the form of an emitted photon. The energy of the photon is equal to the energy difference between the higher and lower energy states. That energy corresponds to wavelengths of light. Since each type of atom has different energy levels, the light emitted from each transition varies for each atom. For a sample of mixed molecules, the emitted light contains a range of wavelengths in what is called a continuous spectrum. For a sample containing atoms of a single element, the emitted light contains only certain wavelengths, which can be viewed as discrete lines once separated by a prism.
The Hydrogen Atom
Looking specifically at the hydrogen atom, the excitation of its electrons requires the absorption of sufficient energy to split the bond in the diatomic molecule H2. Since more energy is used to split the molecule than needed, the electrons in the hydrogen atom absorb the excess energy and are excited to a higher energy level. When the electrons spontaneously return to a lower energy level, light is emitted, which corresponds to the energy difference between the excited level and lower level.
When discussing the emission of energy, the higher energy level is considered the initial level, or ni, while the lower level is considered the final level, or nf. The wavelengths of emitted light ultimately depend on the energy difference between the two levels.
In a pure sample of hydrogen gas, the emission spectrum appears as distinct lines of discrete wavelengths that are specific to the element hydrogen. Some of these lines are in the visible range of the electromagnetic spectrum, while some are in the ultraviolet or infrared range.
The Balmer Series
The series of visible lines in the hydrogen atom spectrum are named the Balmer series. This series of spectral emission lines occur when the electron transitions from a high-energy level to the lower energy level of n=2. Johann Balmer observed these spectral lines at 410.2 nm, 434.1 nm, 486.1 nm, and 656.3 nm, which correspond to transitions from the n=6, n=5, n=4, and n=3 energy levels to the n=2 level, respectively.
Balmer was able to relate these wavelengths of emitted light using the Balmer formula.
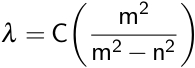
Here, λ is the observed wavelength, C is a constant (364.50682 nm), n is the lower energy level with a value of 2, and m is the higher energy level, which has a value greater than 3. This observation was then refined by Johannes Rydberg, where R is the Rydberg constant.
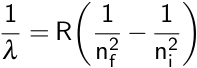
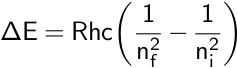
Remember that this equation describes emitted light, so the higher energy level is considered the initial level, or ni, while the lower level is considered the final level, or nf. In the case of the Balmer series, nf is equal to 2. This equation was combined with the Bohr model to calculate the energy needed to move an electron between its initial and final energy levels, ΔE.
Later, other spectral series for the hydrogen atom were discovered. For example, the Lyman series contains emission lines with energies in the ultraviolet region.
Riferimenti
- Kotz, J.C., Treichel Jr, P.M., Townsend, J.R. (2012). Chemistry and Chemical Reactivity. Belmont, CA: Brooks/Cole, Cengage Learning.
- Silderberg, M.S. (2009). Chemistry: The Molecular Nature of Matter and Change. Boston, MA: McGraw Hill.