Bee Preparation and Back-fill
- Catch honey bee foragers at hive and chill on ice for immobilization.
- Mount in Plexiglas recording chambers3. Fix eyes and thorax to the walls of the recording chamber with low melting point hard wax.
- Pull glass capillaries as commonly used for electrophysiology and break at the tip to obtain a tip diameter of ca. 10μm. Cover tip of the capillary with dye paste. Dye paste consists of a 10:1 mixture of Fura-2 dextran and lysine fixable tetramethylrhodamine dextran.
- For the staining procedure immobilize antennae with minutiae or n-eicosane. Remove a piece of cuticle above the brain and push glands and trachea to the side to allow access to the mushroom body.
- Inject capillaries into either the soma or axonal region of mushroom body neurons. This can be done free hand or using a micro manipulator. Then restore cuticle piece on head capsule and loosen antennae.
- Feed bees with 30% sucrose solution before storing them in a humidified case for at least four hours or over night at 20°C.
In vivo Imaging
- Prevent movements of the bee e.g. with a small piece of sponge that is pressed against the abdomen and fixed with a clip or tape to the recording chamber.
- To prevent movement of the brain resulting from pumping of the oesophagus, cut a small incision into the cuticle above the labrum and pull out carefully the oesophagus and its surrounding solid structures to put it under tension without damaging the oesophagus4. Cover with two component silicone.
- Make holes with a needle and insert wire electrodes for the recording of M17.
- Remove cuticle piece, trachea and glands above the brain. Suck heamolymph inside the head capsule with a piece of paper.
- Fill the head capsule with two component silicone. It is important that the brain is completely covered.
- Place bee on microscope stage and place a drop of water on the surface of the silicone to immerse the dip objective of the microscope into the droplet. Focus on stained neurons.
Odor stimulation and recording of signals
Olfactometer: We use a computer controlled, custom built stimulation device or “olfactometer” as described previously by Galizia and Vetter3. Odors are diluted into a constant air stream directed towards the antennae. Any stimulus consists of a 3s odor pulse of 0.2ml odor saturated air. The stimulation protocol can be set in the recording software TILLVision.
Microscope and Imaging set-up: We use a Zeiss fluorescence microscope. Images are recorded at 25°C with a sampling-rate of 5 Hz using a TILL-Photonics imaging device mounted on the microscope. Calcium signals are recorded through an X60, 0.9 W Olympus dip objective with an Imago CCD camera (640X480 pixels, 4X binned on chip to 160X120 pixels). Fura-2 is excited with monochromatic light of 340 and 380nm wavelength for ratiometric measurements. Fluorescence is detected through a 410nm dichroic mirror and a 440nm long pass filter. The parameters for the recording are set in the recording software. Each measurement lasts 10s and exposure time for the two wavelengths can be adjusted to the staining intensity in each preparation.
M17 recording: The protractor muscle of the labium (M17) is recorded extracellularly to monitor the behavioral responses related to learning, i.e. the PER 5, 6. Inject a copper wire into the muscle close to the mouth parts. Inject ground electrode into the eye. The muscle potentials are amplified with a custom build pre-amplifier, digitalized and stored on a computer. Stimulus onset is triggered by the olfactometer.
Data Analysis
- During the experiment: The recordings of the calcium signal are fed into a computer and stored. The recording software TILLVision allows an initial inspection of the signals, like calculation of the ratio between the wavelengths (340nm/380nm) and calculation of deltaF (subtraction of baseline).
- Image processing is performed with custom written programs in IDL. Calculate ratio of Ca2+ signals from 340nm and 380nm measurements for each pixel. Determine background fluorescence (F) by averaging over frames before the stimulus and subtract from the ratiometric signal (deltaF).
- To define Region of Interest (ROI): Calculate mean of frames during the stimulus and apply a low pass filter (3X3px). Convert grey scale to false color scale. Determine activity in neuronal structures as activity spots in false color images and define as ROI.
- Calculate temporal dynamics of the active regions by averaging the pixels in the ROI over all frames without any filtering or correction.
Morphological Analysis and Reconstruction
Together with the Fura-2 dextran we fill the neurons with the fixable dye rhodamine dextran (“mini ruby”). Both dyes have the same molecular weight; they should be co-located in the neurons. Wide-field imaging allows only very limited spatial resolution, therefore it is recommended to investigate the stained structures after the experiment using confocal scanning microscopy.
- After physiological measurements, dissect brains and fixate.
- Rinse in PBS and stepwise dehydrate in ethanol and clear in methyl salycilate.
- For confocal microscopy embed brain in methyl salycilate.
- We use a Leica TCS SP2 microscope. Excitation wavelength is 543nm.
- We scan the brain with an air or oil immersion objective and compare the stained structures with the imaging data.
Representative Results:
If the staining and preparation was successful, the signal in false color scale, for example in mushroom body alpha lobe extrinsic neurons, could look like in figure 1.
The behavioral response (PER) can be calculated as spike frequency during the stimulus minus spike frequency before the stimulus (figure2).
The stained structures may be investigated in greater detail using a confocal microscope (figure3).
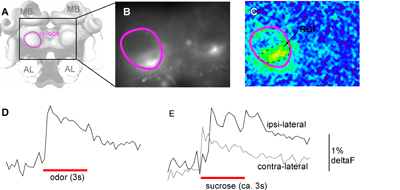
Figure 1: Representative Calcium Imaging signals (stimulation with heptanal). A: Imaged region of the bee brain. B: Raw fluorescent image as seen through a X20 dip objective at 380nm excitation wavelength, the alpha-lobe of the mushroom body is outlined in purple. Dye was injected into the ventro-lateral rim of the alpha-lobes to stain extrinsic neurons. C: False color image derived from the average signal, deltaF (340/380), during the three second stimulus; alpha-lobe outlined in purple, selected ROI outlined in black. D: Temporal dynamics of calcium signal in response to odor stimulation, average signal from region of interest as indicated in C. E: Temporal dynamics of calcium signal in response to sucrose stimulation of the ipsi- and contra-lateral antenna respectively to the ROI indicated in C.
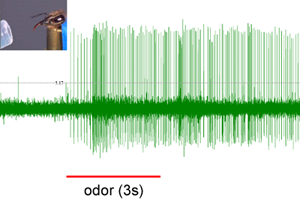
Figure 2: Representative M17 response. After olfactory conditioning the bee extends the proboscis when the odor is presented without reward. Red line indicates odor stimulus. Inset: PER of the honeybee.

Figure 3: Representative image stack. After the imaging experiment the brain was dissected. The neuron from figure 1 is scanned using a confocal microscope with a X20 oil immersion objective, alpha-lobe outlined in purple.
