This technique describes an effective workflow to visualize and quantitatively measure mitochondrial membrane potential and superoxide levels within HeLa cells using fluorescence-based live imaging.
Mitochondria are dynamic organelles critical for metabolic homeostasis by controlling energy production via ATP synthesis. To support cellular metabolism, various mitochondrial quality control mechanisms cooperate to maintain a healthy mitochondrial network. One such pathway is mitophagy, where PTEN-induced kinase 1 (PINK1) and Parkin phospho-ubiquitination of damaged mitochondria facilitate autophagosome sequestration and subsequent removal from the cell via lysosome fusion. Mitophagy is important for cellular homeostasis, and mutations in Parkin are linked to Parkinson’s disease (PD). Due to these findings, there has been a significant emphasis on investigating mitochondrial damage and turnover to understand the molecular mechanisms and dynamics of mitochondrial quality control. Here, live-cell imaging was used to visualize the mitochondrial network of HeLa cells, to quantify the mitochondrial membrane potential and superoxide levels following treatment with carbonyl cyanide m-chlorophenyl hydrazone (CCCP), a mitochondrial uncoupling agent. In addition, a PD-linked mutation of Parkin (ParkinT240R) that inhibits Parkin-dependent mitophagy was expressed to determine how mutant expression impacts the mitochondrial network compared to cells expressing wild-type Parkin. The protocol outlined here describes a simple workflow using fluorescence-based approaches to quantify mitochondrial membrane potential and superoxide levels effectively.
The mitochondrial network is a series of interconnected organelles that play a crucial role in energy production1, innate immunity2,3, and cell signalling4,5. Mitochondrial dysregulation has been associated with neurodegenerative diseases such as Parkinson's disease (PD)6,7. PD is a progressive neurodegenerative disorder affecting dopaminergic neurons of the substantia nigra that impacts nearly 10 million people worldwide8. PD has been genetically linked to mitophagy, a mitochondrial quality control pathway necessary for maintaining cellular homeostasis that selectively removes damaged mitochondria9,10. Studies have identified multiple independent mitophagy pathways, including FUN14 domain containing 1 (FUNDC1)-mediated mitophagy, Bcl-2 interacting protein 3 (BNIP3)-facilitated mitophagy, NIX-dependent mitophagy, and the well-characterized PTEN-induced kinase 1 (PINK1)/Parkin-regulated mitophagy10,11. PINK1 (a putative kinase) and Parkin (an E3 ubiquitin ligase) work in tandem to phospho-ubiquitinate damaged mitochondria, which drives the formation of autophagosomes that engulf the damaged organelle and fuse with lysosomes to initiate degradation12,13,14,15,16. Mutations in Parkin have been associated with PD-linked phenotypes such as neurodegeneration via the loss of dopaminergic neurons17,18.
Here, a protocol is described in which HeLa cells, routinely used immortalized cells derived from cervical cancer, are used to investigate the role of Parkin in maintaining mitochondrial network health. HeLa cells express negligible levels of endogenous Parkin and therefore require exogenous Parkin expression19. To study the role of Parkin in mitochondrial network health, HeLa cells are transfected with either wild-type Parkin (ParkinWT), a Parkin mutant (ParkinT240R), or an empty control vector. ParkinT240R is an autosomal recessive juvenile parkinsonism mutation that affects Parkin E3 ligase activity, significantly reducing the efficiency of the mitophagy pathway20. HeLa cells are subject to mild (5 µM) or severe (20 µM) concentrations of carbonyl cyanide m-chlorophenyl hydrazone (CCCP), a mitochondrial uncoupling agent. Treatment with severe concentrations of CCCP is routinely used to induce Parkin-mediated mitophagy in various cell lines, such as HeLa and COS-7 cells21,22,23.
Following treatment, the protocol employs live imaging of the mitochondrial network using two currently available mitochondrial-targeted fluorescent dyes. Tetramethylrhodamine, ethyl ester, perchlorate (TMRE) is a cationic dye that fluoresces based on mitochondrial membrane potential24, while MitoSOX is a mitochondrial superoxide indicator where the fluorescence intensity is a function of superoxide concentration25. Finally, the outlined protocol uses a fluorescence-based quantification and simple workflow to effectively quantify the mitochondrial membrane potential and superoxide levels with minimal scope for user bias. Although this protocol was designed to study mitochondrial function in HeLa cells, it can be adapted for additional cell lines and primary cell types to quantitively characterize mitochondrial network health.
1. Preparation of biological samples
NOTE: Perform the following steps using sterile technique in a biosafety cabinet. Spray the surface of the cabinet and all materials with 70% ethanol.
2. CCCP treatment and mitochondrial labeling with fluorescent probes in HeLa cells
CAUTION: Perform the following steps quickly to ensure the HeLa cells are not out of the incubator for an extended period.
3. Confocal microscope image acquisition setup
NOTE: Image the HeLa cells using a confocal microscope (see Table of Materials) equipped with a 63x/1.40 numerical aperture (NA) oil immersion objective and an environmental chamber (see Table of Materials).
4. Image acquisition
CAUTION: The experimenter must make a visual judgment to select the cells based on the YFP fluorescence signal. Avoid oversaturated pixels, as they can significantly affect the fluorescence intensity quantification. Use an over/under look-up table that indicates pixel saturation to avoid acquiring saturated images.
5. Fluorescence intensity quantification using ImageJ
NOTE: Imaging files are saved as ".lif" and are compatible with ImageJ29. Compatible file types with ImageJ are specified on their website. It may be necessary to convert the file type if it is incompatible.
In this protocol, fluorescence-based quantification was used to measure the membrane potential and superoxide levels of the mitochondrial network following CCCP treatment (Figure 1). This workflow used HeLa cells, an immortalized cell line derived from cervical cancer. HeLa cells are routinely used to study mitochondrial biology and are relatively flat, making it easy to visualize the mitochondrial network using microscopy. To investigate the role of Parkin in maintaining mitochondrial network health, HeLa cells were transiently transfected with an empty control vector, ParkinWT, or ParkinT240R (a mutant that disrupts mitophagy)21. HeLa cells were plated in 35 mm glass-bottom imaging dishes and were transfected once ~50%-60% confluency was reached (Figure 1A). Since HeLa cells rapidly divide, this is typically the day after plating the cells into the imaging dishes. A light microscope was used to observe the YFP fluorescence signal the following day to assess the transfection efficiency. Experiments were only performed following a successful transfection.
After inspection, the HeLa cells were treated with mild (5 µM) or severe (20 µM) concentrations of CCCP to depolarize the mitochondrial network (step 1.2 shows detailed instructions for preparing CCCP and fluorescent probes). The CCCP treatment was performed for a total of 2 h. During the final 30 min of the CCCP treatment, the mitochondria were labeled with MitoTracker and TMRE/MitoSOX (Figure 1A). It should be noted that TMRE and MitoSOX have overlapping fluorescence spectra and cannot be used simultaneously. Instead, we used separate imaging dishes for the TMRE and MitoSOX experiments. For TMRE experiments, the HeLa cells were immediately ready to image at the end of the 2 h CCCP treatment. The TMRE concentration must remain constant; therefore, TMRE remained in the HeLa media. However, free MitoSOX must be removed before imaging. For the MitoSOX experiments, the cells were washed three times with HeLa media to remove the free dye. For this step, it is essential to use HeLa media containing the same DMSO or CCCP concentration as the experimental conditions. Hoechst 33342, a nuclei marker, was initially used to assess the HeLa cells following the transient transfection and CCCP treatment (Figure 1B).
Subsequently, confocal microscopy was performed to visualize TMRE and MitoSOX fluorescence intensities, to measure the mitochondrial membrane potential and superoxide levels, respectively. The images were acquired using a 63x (1.4 NA) oil immersion objective with parameters of bidirectional scanning, a spatial resolution of 1,024 x 1,024 pixels, a scanning speed of 600 Hz, line averaging of 3, a phase of 22.61, and a zoom factor of 1.5 (Figure 2C). The DMSO control plate was imaged first for all experiments to set the gain and intensity values for TMRE and MitoSOX. To make quantitative comparisons across conditions, these values must be set in the DMSO condition and remain constant throughout the experiment. CCCP induces mitochondrial depolarization and a loss of membrane potential, resulting in a reduced TMRE fluorescence intensity. Therefore, the control experiments had the highest TMRE intensity, and the gain and intensity values were set close to saturation. In contrast, higher superoxide levels increase the MitoSOX intensity. Therefore, the control had the lowest MitoSOX fluorescence intensity, and the gain and intensity values were set low where a dim signal was present. Since MitoTracker, TMRE, and MitoSOX are vital dyes and label all cells, they should not be used when selecting cells to image. Instead, the cells were selected based on the YFP signal to ensure they were transfected. Single-plane images were acquired, focusing on the bottom of the HeLa cell, where a large population of mitochondria was located.
Quantification of TMRE and MitoSOX fluorescence intensity
Quantification of the TMRE and MitoSOX fluorescence intensities was analyzed using ImageJ (Figure 3). A 6 micron x 6 micron ROI was created and stored in the ROI manager. The ROI was placed in five random nonoverlapping regions of each cell to measure the TMRE or MitoSOX intensity. The fluorescence intensity corresponds to the mean gray value in ImageJ. The five intensity values were averaged for each cell to calculate the mean fluorescence intensity per cell. These values were plotted and analyzed for statistical significance across treatment conditions.
The results for the TMRE and MitoSOX fluorescence intensities are shown in Figure 4 and Figure 5, respectively. As expected, treatment with the known uncoupling agent CCCP decreased the TMRE fluorescence intensity compared to the control conditions (Figure 4A,B). In addition, severe (20 µM) CCCP treatment induced superoxide production and increased the MitoSOX fluorescence intensity (Figure 5A,B). In mild (5 µM) CCCP stress conditions, the expression of ParkinWT and ParkinT240R resulted in higher TMRE intensity compared to the empty YFP control vector. Similarly, the MitoSOX intensity was lower in cells expressing ParkinWT and ParkinT240R compared to cells expressing the YFP control vector (Figure 5A,B). These results suggest that Parkin expression helps maintain the mitochondrial network health by preserving higher mitochondrial membrane potentials and low superoxide levels. Thus, the protocol outlined here can be used to accurately compare fluorescence intensity to analyze the role of Parkin in controlling mitochondrial membrane potential and superoxide formation.
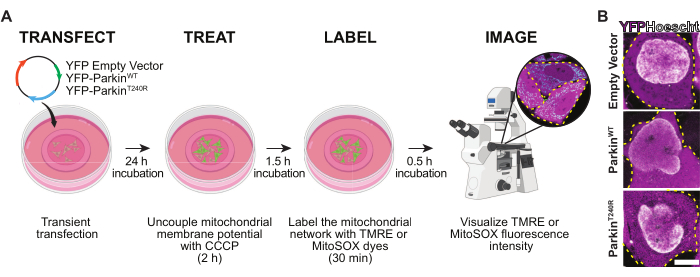
Figure 1: Experimental workflow. (A) Schematic of the experimental workflow used to transfect, treat with CCCP, and label the mitochondria network, and image TMRE and MitoSOX fluorescence intensity in HeLa cells. (B) Representative images of cells expressing an empty YFP vector (top), YFP-ParkinWT (middle), and YFP-ParkinT240R (bottom; magenta). Hoechst 33342 (white) is used to label the DNA. Scale bar = 10 µm. Abbreviations: CCCP = carbonyl cyanide m-chlorophenyl hydrazone; TMRE = tetramethylrhodamine-ethyl ester-perchlorate; YFP = yellow fluorescent protein. Please click here to view a larger version of this figure.
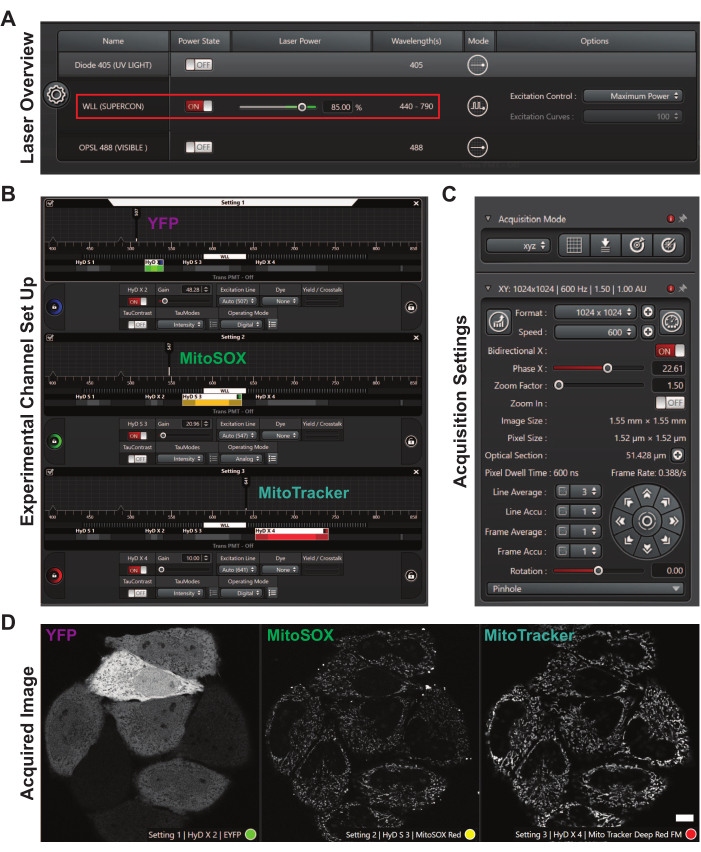
Figure 2: The user interface to set up confocal acquisition settings. (A) Laser settings dialog box. The red rectangle highlights the white light laser, power state, laser power, and wavelengths. (B) Experimental channel set up for a MitoSOX experiment. The settings, excitation lines, and emission spectra windows are shown for YFP, MitoSOX, and MitoTracker. (C) Acquisition settings show the format, speed, bidirectionality, phase X, zoom factor, and line average.(D) A representative acquired image. HeLa cells are expressing YFP (magenta), and the mitochondria are labeled with MitoSOX (green) and MitoTracker (cyan). Scale bar = 10 µm. Abbreviations: WLL = white light laser; YFP = yellow fluorescent protein. Please click here to view a larger version of this figure.
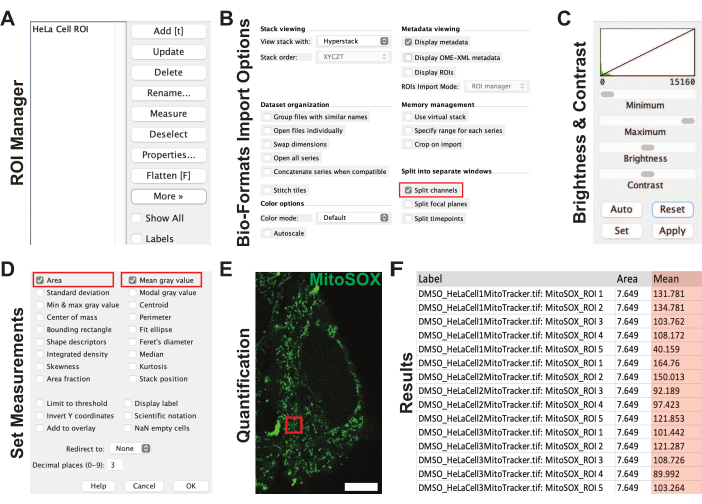
Figure 3: ImageJ workflow to quantify TMRE and MitoSOX fluorescence intensities. (A) The ROI manager panel with an example ROI in ImageJ. (B) Bio-formats import options panel. The red rectangle highlights the Split Channels option that should be selected. (C) Brightness and contrast settings parameters. (D) Set measurements parameter. The red rectangles highlight the Area and Mean gray value options that should be selected. (E) Representative image of a HeLa cell labeled with MitoSOX. The red square illustrates the ROI from panel A. Scale bar = 10 µm. (F) Results panel showing the experimental area and mean gray values from the ROIs. The mean gray value (orange) represents the fluorescence intensity values. Abbreviations: TMRE = tetramethylrhodamine-ethyl ester-perchlorate; ROI = region of interest. Please click here to view a larger version of this figure.
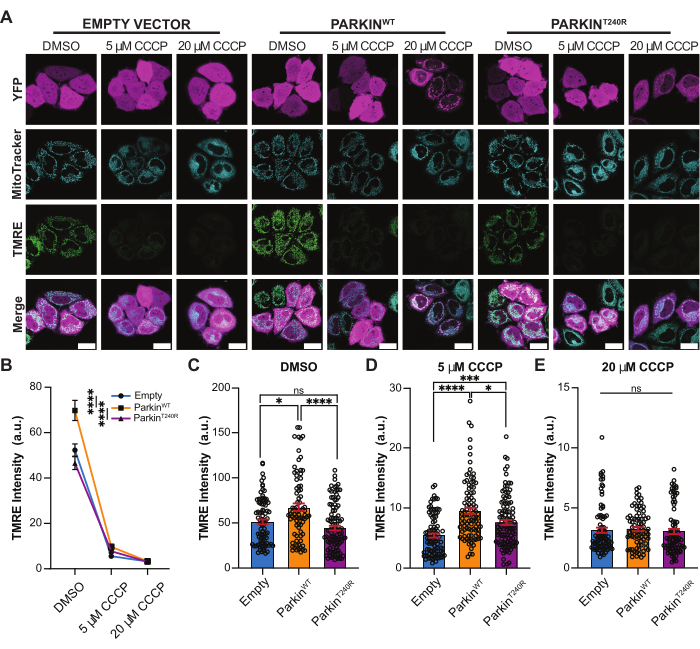
Figure 4: TMRE fluorescence intensity after mitochondrial damage. (A) Representative images of HeLa cells following a 2 h treatment with DMSO, 5 µM CCCP, or 20 µM CCCP to induce mitochondrial damage. Cells are exogenously expressing an empty YFP vector, YFP-ParkinWT, or YFP-ParkinT240R (magenta), and labeled with MitoTracker (cyan) and TMRE (green). Scale bar = 30 µm. (B) Quantification of TMRE fluorescence intensity for cells expressing empty YFP vector (blue), YFP-ParkinWT (orange), and YFP-ParkinT240R (purple) in DMSO- and CCCP-treated conditions. ****p < 0.0001 by two-way ANOVA with a multiple comparison test. (C–E) The quantification of the TMRE fluorescence intensities from panel B is separated to highlight differences in DMSO (C), 5 µM CCCP (D), and 20 µM CCCP (E). * p < 0.05; ***p < 0.001; ****p < 0.0001 by Kruskal-Wallis ANOVA with Dunn's multiple comparison test. Ns = not significant. Mean ± SEM; n= 79-104 from three independent biological replicates. Abbreviations: CCCP = carbonyl cyanide m-chlorophenyl hydrazone; TMRE = tetramethylrhodamine-ethyl ester-perchlorate; YFP = yellow fluorescent protein; DMSO = dimethyl sulfoxide. Please click here to view a larger version of this figure.
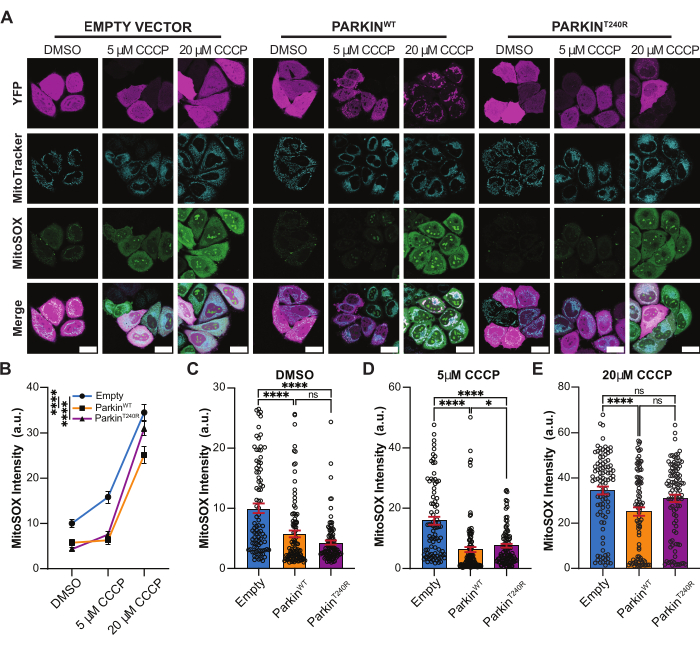
Figure 5: MitoSOX fluorescence intensity following damage to the mitochondrial network. (A) Representative images of HeLa cells treated for 2 h with DMSO, 5 µM CCCP, or 20 µM CCCP to uncouple the mitochondria membrane potential. Cells were transfected with empty YFP vector, YFP-ParkinWT, or YFP-ParkinT240R (magenta), and labeled with MitoTracker (cyan) and MitoSOX (green). Scale bar = 30 µm. (B) Quantification of MitoSOX fluorescence intensity for cells expressing empty YFP vector (blue), YFP-ParkinWT (orange), and YFP-ParkinT240R (purple) for control and treated conditions. ****p < 0.0001 by two-way ANOVA with Dunn's multiple comparison test. (C–E) The quantification of the MitoSOX fluorescence intensities from panel B is separated to highlight differences in DMSO (C), 5 µM CCCP (D), and 20 µM CCCP (E). *p < 0.05; ****p < 0.0001 by Kruskal-Wallis ANOVA with Dunn's multiple comparison test. Ns = not significant. Mean ± SEM; n = 87-107 from three independent biological replicates. Abbreviations: CCCP = carbonyl cyanide m-chlorophenyl hydrazone; TMRE = tetramethylrhodamine-ethyl ester-perchlorate; YFP = yellow fluorescent protein; DMSO = dimethyl sulfoxide. Please click here to view a larger version of this figure.
The workflow outlined here can be used to quantify mitochondrial membrane potential and superoxide levels robustly and reproducibly using fluorescence-based imaging30. There are important technical limitations to consider when designing these experiments. HeLa cells were transfected with an empty YFP vector, YFP-ParkinWT, or YFP-ParkinT240R. The empty YFP vector was used as a control to confirm that the experimental findings were specific to Parkin. For the transient transfection, a mass ratio of 1:3 for DNA to transfection reagent was experimentally determined to yield the highest transfection rate, where 2 µg of plasmid DNA was used for each construct28. Keeping the YFP-tag consistent for all constructs was important, as fluorescent proteins differ in innate brightness31,32. If multiple fluorescent protein tags must be used, then fluorescent proteins with similar brightness and photostability should be selected33.
To measure mitochondrial membrane potential and superoxide levels, two well-documented dyes were selected. The fluorescence signal of TMRE is based on the mitochondrial membrane potential, while MitoSOX fluorescence intensity is a function of superoxide levels. For fluorescence-based imaging, there should be no spectral overlap between fluorescent probes. However, the initial protocol was performed using mCherry-ParkinWT and mCherry-ParkinT240R, which overlapped with the red-shifted spectra of TMRE and MitoSOX. To avoid spectral overlap and minimize potential crosstalk, YFP-tagged Parkin constructs were selected. This adjustment necessitated altering the MitoTracker dye from green to far-red. In addition, the HeLa cell plating density was optimized; initially, HeLa cells were plated at 45,000 cells per imaging dish, but this resulted in over-confluent dishes. High cell confluency can reduce transfection efficiency, promote cell death, and alter cellular metabolism34,35,36. To avoid these potential impacts, the cells were plated at a density of 30,000 cells per imaging dish.
The main limitation of this protocol is the potential for user bias, specifically when selecting cells and ROI locations. The protocol uses changes in the TMRE and MitoSOX fluorescence intensities as a functional readout for membrane potential and superoxide levels. Therefore, cell selection using these probes could potentially bias the experimental outcomes. To combat this bias, we chose cells based solely on YFP expression. Nonoverlapping ROIs were randomly selected across the mitochondrial network within the cell. Though this method was previously used to measure fluorescence intensity27, additional bias-reducing measures could be taken. First, the study could be blinded using the Blind Analysis Tools in ImageJ to prevent ROI selection that supports expected outcomes. Second, fluorescence intensities could be measured using advanced image analysis software that eliminates the need for ROIs.
While this protocol uses confocal microscopy for fluorescence-based quantification, additional methods, such as flow cytometry, could be used to quantify fluorescence changes in TMRE and MitoSOX37. Here, we used confocal microscopy rather than flow cytometry to visualize the mitochondrial network morphology. The outlined protocol could easily be adapted to measure TMRE and MitoSOX fluorescence with flow cytometry yielding similar experimental results. In addition, oxygen consumption rate (OCR) assays could be used to detect changes in the function of the mitochondrial electron transport chain without cationic dyes. While OCR provides a sensitive measure of mitochondrial dysfunction, it is not specific to membrane potential or superoxide concentration, but instead provides a global measure of mitochondrial function38. These assays could be performed in conjunction with TMRE and MitoSOX experiments to assess mitochondrial health39.
Though this protocol specifically focuses on the effect of the mitochondrial uncoupler CCCP40, damaging reagents with alternative mechanisms could be utilized. For example, antimycin A and oligomycin A are electron transport chain inhibitors commonly used to induce mitochondrial damage via reactive oxygen species (ROS) production38. While we specifically measured mitochondrial superoxide levels using MitoSOX, intracellular ROS could be measured using CellROX. In HeLa cells, it was necessary to overexpress Parkin due to the low endogenous expression. Future studies could observe the effects of Parkin expression on mitochondrial network health using cell culture systems that express endogenous Parkin41. Since mitochondria are critical regulators of energy metabolism and cellular homeostasis, mitochondrial dysfunction is associated with numerous diseases, including diabetes42, Alzheimer's disease43,44,45, cancer46, and liver disease47. Therefore, this workflow could be adapted to study mitochondrial health and dysregulation in relevant cell lines and primary cultures.
The authors have nothing to disclose.
We thank the members of the Evans lab for their thoughtful feedback on this manuscript. This work is supported by Duke Whitehead Scholars, Duke Science and Technology Scholars, and Howard Hughes Medical Institute (HHMI) Hanna Gray Fellowship. Figure 1A was made using BioRender.com.
Chemicals, Peptides, and Recombinant Proteins | |||
CCCP (carbonyl cyanide m-chlorophenyl hydrazone) | Sigma-Aldrich | C2759 | |
DMEM (1x) with 4.5 g/L glucose | Gibco | 11-965-084 | |
DMSO, Anhydrous | ThermoFisher Scientific | D12345 | |
Fetal Bovine Serum | Hyclone | SH3007103 | |
FuGENE 6 (Tranfection Reagent) | Promega | E2691 | |
GlutaMAX 100x (L-Glutamine Solution) | Gibco | 35-050-061 | |
Hoescht 33342 | ThermoFisher Scientific | 62249 | |
MitoSOX Red | ThermoFisher Scientific | M36008 | |
MitoTracker Deep Red | ThermoFisher Scientific | M7514 | |
Opti-MEM (Redued Serum media) | ThermoFisher scientific | 31985070 | |
Tetramethylrhodamine, Ethyl Ester, Perchlorate (TMRE) | ThermoFisher Scientific | T669 | |
Experimental models: Organisms/Strains | |||
HeLa-M (Homo sapiens) | A. Peden (Cambridge Institute for Medical Research) | N/A | |
Recombinant DNA | |||
EYFP Empty Vector | N/A | N/A | |
YFP-Parkin T240R | This Paper | Generated by site-directed mutagenesis from YFP-Parkin | |
YFP-Parkin WT | Addgene; PMID:19029340 | RRID:Addgene_23955 | |
Software and Algorithms | |||
Adobe Illustrator | Adobe Inc. | https://www.adobe.com/products/illustrator | (Schindelin, 2012) |
Excel (Spreadsheet Software) | Microsoft Office | https://www.microsoft.com/en-us/microsoft-365/excel | |
ImageJ | https://imagej.net/software/fiji/ | ||
Leica Application Suite (LAS X) | Leica | https://www.leica-microsystems.com/products/microscope-software/p/leica-las-x-ls/ | |
Microsoft Excel | Microsoft Office | https://www.microsoft.com/excel | |
Prism9 (Statistical Analysis Software) | GraphPad Software | https://www.graphpad.com | |
Other | |||
35 mm Dish, No. 1.5 Coverslip, 20 mm Glass Diameter, Uncoated | MatTek | P35G-1.5-20-C | |
Cage Incubator (Environmental Chamber) | Okolab | https://www.oko-lab.com/cage-incubator | |
DMiL Inverted Microscope | Leica | N/A | |
LIGHTNING Deconvolution Software | Leica | N/A | |
STELLARIS 8 confocal microscope | Leica | N/A |