1. Software and hardware requirements
- Flatbed scanners: In principle, the LSM can be implemented using a variety of imaging devices. Detailed instructions for scanner modifications and focusing are available elsewhere13. The LSM hardware is shown in Supplementary Figure 1.
- Data analysis tools: The LSM software has three interacting components: a Linux-based scanner control software package, a web-browser-based metadata management package, and a Windows and Linux client image analysis software package. Refer to the instructions for installing software tools published on the GitHub repository (https://github.com/nstroustrup/lifespan).
- Data visualization and validation software: Use the Worm Browser, a client program, to schedule the experiments, validate the image analysis, perform manual annotation of the nematode movement, and output the survival data. Binary executables are provided for the Worm Browser on Windows 7, Windows 8, and Windows 10, and the Worm Browser is compiled from source code on Linux or Apple iOS. An installation guide is available on the GitHub repository mentioned above.
Supplementary Figure 1: Lifespan Machine hardware. One flatbed scanner unit with an open lid to show the loaded plates, which are placed facing down into 16 openings cut on a rubber mat. The rubber mat is placed on the surface of a glass scanner. Labels for the conditions are written on the sides of the plates to avoid issues during image analysis. Marking tape with the number ("1") and/or name of the device ("Jabba") facilitates later verification of the sample location when working with multiple scanner devices. More details about the LSM hardware components are found elsewhere13. Please click here to download this File.
2. Setup prior to the day of the experiment
- Temperature calibration of the incubator: Environmental temperature is a major determinant of C. elegans lifespan19. To produce accurate results, perform image acquisition at a carefully calibrated temperature, kept constant throughout the experiment. To accomplish this, a few days prior to the start of the experiment, measure and calibrate the temperature of each scanner's surface during operation. Use high-precision thermocouples as described elsewhere31 (see the Table of Materials).
- Scanner plate layout: Before the start of the experiment, plan the optimal layout of the culture plates for each scanner.
NOTE: The purpose of this is to avoid the introduction of confounding factors resulting from temperature variation between the scanners and across each scanner's surface. Scanners differ subtly in their average surface temperature and, furthermore, exhibit subtle temperature biases across their surface31.- Scanner plate position: To control for these thermal effects in the subsequent data analysis, randomize any biological covariates regarding the scanner position, and standardize the plate location across all the scanners.
- Number of samples across the scanners: When using the 16 rubber mat layout (see the Table of Materials), place four plates per condition in each scanner, with a total of at least four scanners. This ensures that each condition is distributed across multiple scanners, such that the confounding effects of scanner temperature can be identified and removed during data analysis13. To make this analysis more straightforward, include a shared reference condition (e.g., wild-type samples) on each scanner.
NOTE: In general, due to the placement of the scanner fans, the plates on the top-right corner of the rubber mat are more prone to desiccation. Leave this location empty if needed.
- Plates and sample preparation
- Pouring of the culture plates: For optimal drying of the scanner culture plates (see the Table of Materials), pour agar medium 4 days before loading the nematodes. Though the scanner focus is adjustable to allow for different volumes of agar to be added to the plates, the standard plate volume is 8 mL.
NOTE: It might be helpful to pour the plates with a peristaltic pump, especially for large experiments. - Seeding of the plates: Seed the plates with the desired bacterial culture at least 2 days before the start of the experiment to allow for the proper drying and growth of the bacterial lawn. Typically, 200 µL of bacterial culture is sufficient to form a lawn that will feed 40 nematodes for several weeks.
NOTE: The plates typically used for imaging are more tightly sealed than standard culture Petri dishes; therefore, it is advised to seed and dry the plates inside of a laboratory hood, usually for about 1 h or until properly dried.
- Pouring of the culture plates: For optimal drying of the scanner culture plates (see the Table of Materials), pour agar medium 4 days before loading the nematodes. Though the scanner focus is adjustable to allow for different volumes of agar to be added to the plates, the standard plate volume is 8 mL.
- Nematode handling
- Population size: The number of nematodes that can be reliably imaged on a single plate depends on the genotype, the age at which nematodes are plated, and the amount of food added to each plate. For lifespan experiments that start in early adulthood, load approximately 40 animals per plate. This number ensures sufficient food and avoids crowding.
- Growing large populations: To prepare for population expansion and synchronization, start with a population of nematodes appropriate for the chosen synchronization method (see below). Aim to perform synchronization on the animals at their age of maximum egg production, which for wild-type N2 animals is day 2 of adulthood32.
NOTE: Another reason to synchronize populations by using animals on their second day of adulthood is to remove maternal age as a contributing factor to population heterogeneity. The maternal age in C. elegans has been shown to affect multiple fitness traits in the progeny, with day 2 wild-type animals producing the "highest-quality" progeny33. - Performing age-synchronization: To obtain accurate results, synchronize the age of the animals as precisely as possible. In this protocol, age synchronization is performed using a modified hypochlorite treatment34. Other methods might include synchronization by egg lay-off, by L1 larval arrest, or by manually picking L4 larvae.
NOTE: For age synchronization by hypochlorite treatment, expect to obtain three to four eggs from each adult hermaphrodite. - Maintaining progeny-free populations: Maintain progeny-free populations by exposing nematodes during their late L4 stage to 5-fluoro-2'-deoxyuridine (FUdR)35.
NOTE: At low doses, FuDR is lethal to developing embryos without producing macroscopically visible changes to the germline or altering the rate of oocyte production. Other methods include using temperature-sterile mutants, using sterilizing RNAi constructs, or simply waiting until post-reproductive senescence to transfer the nematodes onto plates for imaging. - Transferring populations: When transferring thousands of animals between plates, the standard protocol involving a platinum/iridium wire becomes laborious. Methods involving the liquid suspension of nematodes facilitate the transfers and make them more efficient. Collect the nematodes with M9 + Mg buffer (Na2HPO4 42.27 mM, KH2PO4 22.05 mM, NaCl 85.56 mM, MgSO4 1 mM), reduce the total volume once the nematodes settle by gravity, and then quickly transfer the nematodes to the plates used for imaging.
NOTE: Transferring the nematodes by liquid suspension might lead to variation in the number of animals transferred to each plate. Try to be consistent with the number of nematodes on each plate to avoid experimental variability. - Applying interventions: Stopping and restarting image acquisition during an experiment complicates the image analysis (see discussion). Therefore, start the LSM experiments only after all the necessary nematode handling has been completed.
- Sterilizing the rubber mats: Autoclave a large number of mats simultaneously, by individually wrapping them in aluminum foil.
NOTE: The rubber mats should be sterilized between uses to avoid the buildup of fungal or bacterial contaminants. Most types of rubber typically used are degraded by aggressive ethanol treatment.
3. Setup on the day of the experiment
- Plate support and scanner glass preparation: To simplify the plate handling, do not load the Petri dishes directly onto the scanner surface, but instead hold them in place using rubber mats supported by panes of glass (see the Table of Materials). Populations are imaged through this glass, so keep the glass clean and treated with anti-fog, hydrophobic, and sterilizing coating (see the Table of Materials).
- Before loading the plates into the incubator, clean the surface of the plate support glass on both sides with anti-fog glass cleaner.
- Before loading the plates onto their support glass, apply a protective hydrophobic glass treatment (see the Table of Materials) to minimize fogging on the side of the glass that will be in contact with the rubber mat. Spread this treatment well, and leave it on the glass for 5-10 min before proceeding to the next step. Clean vigorously after application to remove any residue.
- Apply 70% ethanol to disinfect the surface of the glass that will be in contact with the rubber matt. Leave for 1 min or 2 min, and then remove with a cloth or paper towel.
- Loading the plates onto the scanners
- First, place the autoclaved rubber mats on top of the treated plate support glass.
- Remove the lid from the plates used for imaging with loaded nematodes, and place them on rubber mat locations facing the glass surface. Make sure the rubber mat is tightly sealed around all the plates, for example, by adding another glass sheet on top and ensuring it lies flat or by tapping on the top of each plate (loose plates will move slightly and hit the glass, making a sound, while tightly secured plates will not move when tapped).
NOTE: It is useful to individually label each sheet of plate support glass with marking tape with information about the plate contents and the intended scanner. This data can be used after the experiment to resolve any potential ambiguities regarding the plate locations. - Before loading the plates into the scanners, unplug the scanner fans to protect the experimenter's fingers during plate loading.
- Gently slide the plates and the glass sheet supporting them onto the surface of the scanner.
NOTE: Avoid applying pressure directly to the rubber mat, as this causes the mat to slide across the plate support glass. When the mats slide, the plates are often knocked loose from the mat. - Reactivate the scanner fans, and visually confirm that the front and side fans are powered. If the scanners are powered off, turn them on at this point.
4. Pre-image acquisition
NOTE: A comprehensive flowchart summarizing all the software-based steps during image acquisition is depicted in Figure 1.
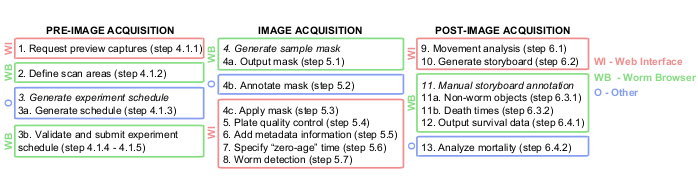
Figure 1: Graphical overview of the Lifespan Machine image analysis pipeline. The pre-, during, and post-image acquisition steps are largely performed on the web interface (WI, in red) and on the Worm Browser (WB, in green). Some steps are performed in other platforms (O, in blue), such as TXT documents in step 3a, Photoshop or equivalent in step 4b, and JMP or equivalent in step 13. Please click here to view a larger version of this figure.
- Image acquisition setup: Generate a file that specifies the experiment schedule and the location of plates on each scanner to configure the image acquisition.
NOTE: This file includes important metadata such as the title of the experiment, the frequency of image captures, and the total duration of the experiment. Typically, this file is not generated de novo for each experiment, but instead, experiment files from previous experiments are reused as templates. For a user's first experiment, a template file is provided (Supplementary File 1).- Request preview captures: Provide the location of all the plates on each scanner. Several tools are provided to speed up this process. First, use the scanner to obtain an image of the entire scanner surface, called "Preview capture". Ensure that the preview capture images clearly show the entire surface of each plate to be imaged (Figure 2A) without streaks or the cropping of plate edges.
- Using the web interface, find the Image Acquisition section of the main page, and follow the link called Capture Devices and Image Servers. On that page, click on the button marked Search for New Devices (i.e., scanners) in the Image Capture and Processing Servers box. Monitor the server's progress in detecting scanners by clicking on the [log] link next to the server.
NOTE: Make sure the desired scanners are powered "on" and plugged into the server before performing this step. - On the same page of the web interface, ensure that each scanner attached to the server appears on the Image Capture Devices box. A "Missing" label under "Current status" is no longer displayed if the device is successfully detected. Select the checkbox corresponding to each scanner containing newly-loaded plates.
- On the bottom of the Image Capture Devices section, click on the Request Preview Capture button. Within 1 min or 2 min, the scanners should light up and start scanning.
NOTE: The initial position of the glass support sheets must often be adjusted to bring all the plates into the viewable range. Positions can be corrected by inspecting preview capture images and making adjustments to the plate position and retaking new preview capture images. If scans proceed extremely slowly (several minutes for one capture scan) or if preview capture images contain long white streaks, this is a sign that a plate, the rubber mat, or some other object is blocking light within the scanner's calibration region (indicated by white arrows on the scanner surface). All the objects should be repositioned such that only the glass support glass occupies this region.
- Using the web interface, find the Image Acquisition section of the main page, and follow the link called Capture Devices and Image Servers. On that page, click on the button marked Search for New Devices (i.e., scanners) in the Image Capture and Processing Servers box. Monitor the server's progress in detecting scanners by clicking on the [log] link next to the server.
- Define the scan areas: Follow the next steps on the Worm Browser to analyze the preview capture images, and assemble them into a single composite image, which is used to specify the location of each plate for the data analysis. Ensure that the resulting image looks similar to Figure 2B.
- First, using the Worm Browser, open each preview capture image by selecting the menu option File > Open Image, and choose the desired image.
- On each image, click to select the columns for regions with plates (if the rubber mat has 16 plate locations, select 4 columns).
NOTE: The scan regions should be specified as tall columns (not wide rows) as the scanner capture is slower for wider regions, resulting in blurry images due to nematode movement. - Once all the images are defined, export the region specifications to disk by selecting the menu item Image Acquisition > Define scan areas > Save selected scan areas to disk and choosing the desired location.
- Generate the experiment schedule:
- Following the format of Supplementary File 1, assemble a file that contains the experiment name, the physical locations of each column on the scanners (copied from the scan areas file generated in step 4.1.2.3), the total duration of the experiment, and the image capture frequency, and save this both as a TXT and as an XML file.
- Then, on Worm Browser, click on Image Acquisition > Submit Experiment Schedule, and choose the generated XML file. The Worm Browser will ask whether to output a summary of the schedule or run the experiment. Click on Generate a Summary File.
- Validate the summary file: After submitting the experiment schedule, the Worm Browser will output a summary of the schedule. This summary is shown on screen and written to disk. Read it, and verify the dates of scheduled captures, as well as the location, name, and number of scanners.
- Submit the experiment schedule: When satisfied with the summary file, load again the XML file for the experiment schedule into the Worm Browser by selecting the menu option Image Acquisition > Submit Experiment Schedule. The Worm Browser will prompt a second time whether to output a summary of the schedule or to run the experiment. This time click on Run! .
NOTE: A few minutes after submitting the experiment, it is wise to use the web interface to confirm the experiment has been successfully submitted and scans are being collected by all the scanners. It is usual for the first few scans to be missed, especially in large experiments. - Organize experiments on the web interface: A busy scanner cluster can produce hundreds of experimental datasets collected by many different users. To organize this list, assign experiments to separate groups, for example corresponding to the name of the user responsible for the experiment.
- Create a new group or modify an existing one: Create new groups on the web interface by clicking on Manage Experiment Groups under the box named Image Acquisition. On the new page that will appear, add the desired name on Create New Group and click on Create. To modify the name of an existing group, on the same box, choose the desired group next to Modify Existing Group, and then select Modify.
- Assign experiments to a group: To assign new experiments to a specific group, go to the web interface, and find the desired experiment, which by default will be assigned to the No Group group at the bottom of the experiment list. Click on the link to the right side of the experiment section where it says Edit, and use the drop-down list to select the name of the group to use. Then, select Save.
- Cancel an experiment:
NOTE: The LSM will continue to work autonomously until the final scans are specified on the experiment schedule. After an experimental schedule is completed, the LSM will, by default, continue collecting scans but immediately discard the image data in a process called autoscanning. These autoscans are performed to prevent the scanners from turning off and cooling, and maintain a standard temperature profile so that any other experiments running in the same space (but from a different experiment) are not affected by the shutdown of other scanners.- Stop autoscans: To stop the autoscans from an ongoing experiment on the web interface, click on Edit next to the desired experiment, then Cancel Pending Scans, and select Cancel Scheduled Captures.
- Request preview captures: Provide the location of all the plates on each scanner. Several tools are provided to speed up this process. First, use the scanner to obtain an image of the entire scanner surface, called "Preview capture". Ensure that the preview capture images clearly show the entire surface of each plate to be imaged (Figure 2A) without streaks or the cropping of plate edges.
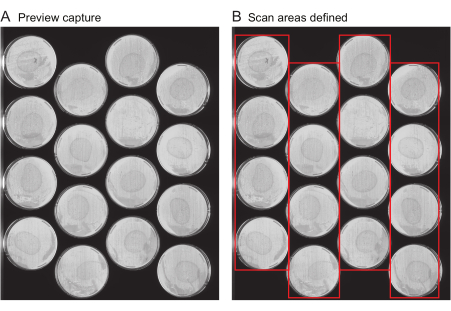
Figure 2: Preview capture image and scan area selection. (A) For each scanner in the experiment, a preview capture image is generated. (B) Selection of one row of plates at a time (red boxes), which increases the speed of scanning and prevents worm motion blur as a result of scanning areas that are too wide. Please click here to view a larger version of this figure.
5. Image acquisition
NOTE: The following steps can be performed both while the experiment is running or after it has finished.
- Output the experiment's mask file: Raw image data from scanners contain many areas that do not need to be processed (areas outside of plates). To focus the analysis on each plate individually, a "mask" is created that specifies the area occupied by each plate on each scanner. Generate this mask by drawing each plate's position as an overlay on images collected by the scanners.
- Using the Worm Browser, choose the desired experiment by selecting File > Select Current Experiment, and then click on the experiment name.
- Again on the Worm Browser, select Image Acquisition > Define Sample Masks > Generate Experiment Mask Composite, and save the mask in the desired location. Ensure that the resulting file looks similar to Figure 3A.
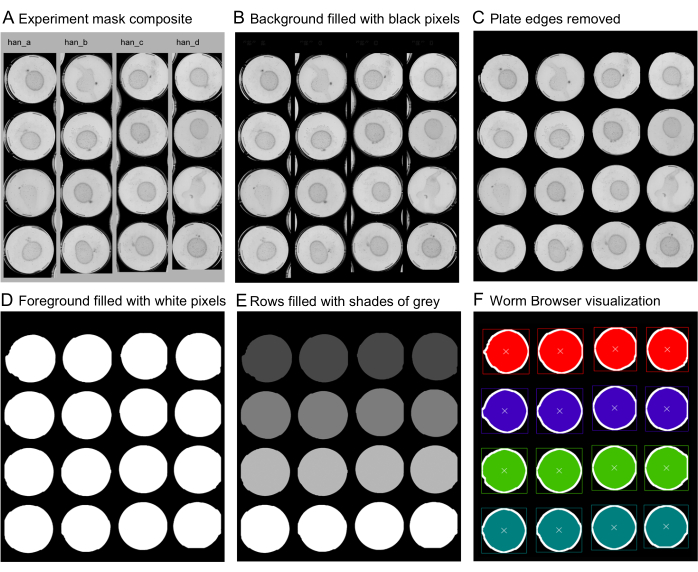
Figure 3: Specification of the plate locations for each scanner using sample masks. To ensure the independent analysis of plates within the column selections shown in Figure 1, individual plates must be identified by generating an image mask composite. (A) A capture of the scans of the scanners is opened with an image manipulation software (note the name of the scanner "han" above a scanned selection, and "a-d" referring to each of the columns). (B) The individual steps of mask generation to mark the location of each plate in the mask composite require the background to be set to black, (C) the removal of jagged edges and edges of non-selected plates by the expanding and then shrinking of the background, and (D) selecting the foreground plates and filling the areas entirely with white pixels. (E) For the LSM to recognize individual plates in the scanned rows, each white region in a row is filled with a different shade of gray, usually in increasing brightness. (F) At this stage, the mask is saved (LZW compression with no layers specified if generated in Photoshop). The mask is then scanned by the Worm Browser, and a visualization of the mask by the software is generated. A correct mask visualization should display one defined square per plate with a small cross at the center and a different color for each row. Please click here to view a larger version of this figure.
- Annotate the experiment's mask: Open the file generated in the previous step with an image manipulation program (such as Photoshop or GIMP) in order to mark the location of each plate in the image. An overview of all mask-editing steps using Photoshop is described below.
- In Photoshop, select the Fill tool with the tolerance set to zero, the contiguous option selected, and the anti-aliasing unselected. Click on the grey background to set it completely to black. Ensure that the resulting image looks similar to Figure 3B.
- Use the magic wand tool to select the black background, with the aliasing set to off, the tolerance set to zero, and the contiguous option selected. To smooth the edges, expand the selected background by 30 pixels by clicking on Select > Modify > Expand. Then, shrink the selection by 20 pixels on Select > Modify > Contract. Ensure that the resulting image looks similar to Figure 3C.
- Fill the smoothed background entirely with black pixels, for example, by setting the Fill tool tolerance to 255 and filling the selected region. Then, click on Select > Inverse to invert the selection, and select the foreground. Fill the new region entirely with white pixels, for example, by setting the fill tool tolerance to 255 and filling the region with white. Ensure that the resulting image looks similar to Figure 3D.
- To separate each plate inside a single region, fill each row with a different gradient of gray in increasing brightness. This can be done with the Fill tool and then by selecting the desired color, with the tolerance set to 0. Ensure that the resulting image looks similar to Figure 3E. Save it in an LZW compression with no "Layers" specified.
NOTE: The ordering of plates is set by the color of the regions specified. To name plates 1-4 in a top-to-bottom order, specify the colors in increasing brightness for each row. - On the Worm Browser, select Image Acquisition > Define Sample Masks > Analyze Plate Locations Drawn on Experiment Mask Composite, and select the file generated in the previous step. The software will now take a few moments to analyze the submitted mask.
- The Worm Browser will display a mask visualization. Inspect the mask for potential errors in the file. Ensure that each row of plates is filled with a different color and outlined by a colored rectangle. Ensure that the resulting image looks similar to Figure 3F.
NOTE: If one single plate shows two circles or more, or if two circles share the same color, go back to step 5.2 to correct the mask file, and load it again into the Worm Browser. - After verifying that the mask visualization is correct, on the Worm Browser, select Image Acquisition > Define Sample Masks > Submit Analyzed Experiment Mask Composite to Cluster. The image analysis server will now analyze the location of all the plates in the experiment.
- Apply the mask: The LSM uses masks to split the raw image data into individual plates. To start this process, schedule a mask application job using the web interface.
- Before submitting the job, verify that all the scanners have identified regions in the mask. Go to the main page of the web interface, locate the name of the experiment and the column named Image Analysis, and click on Run Analysis. Verify that all the devices under Experiment Samples have regions identified.
- To apply the mask, on the same interface, click on New Job for All Samples. On the box named Schedule a Job for Individual Images, select the box Apply Mask, and then Save Job.
NOTE: The mask will be applied to all the images already captured, as well as to any images captured in the future.
- Perform plate quality control:
NOTE: Plates suffering from contamination, desiccation, or fogging are censored at this stage of image analysis. An example of contaminated, desiccated, fogged, and optimal plates is shown in Figure 4. Other reasons for censoring include starvation, empty plates, or larvae in sterile populations. Invalid plates will often contain complex shapes that the machine aims to interpret as nematodes. It is important to exclude invalid plates in this step in order to prevent long processing times in later steps of the image analysis.- Using the web interface, exclude the plates to be censored by finding the desired experiment and the column named Annotate Plate Information and selecting By Image.
- To inspect the plates, click on Display images.
NOTE: If the step for displaying images is not working correctly, the Linux server might not be configured properly. Instructions on how to do this are available in the software installation guide in the aforementioned GitHub repository. - To exclude plates, check the box mark Censor, select an option on the drop-down box named Reason Censored, and then click on Save for each page.
- Add metadata information: Metadata describes the contents of each plate in an experiment. This information is then included in all the statistical data files subsequently generated.
- To add metadata information relative to the strain, genotype, temperature, food, etc., go to the main page of the web interface, find the desired experiment and the column named Annotate Plate Information, and select By Position.
- Enter the labels, and select the scanners for which to save the metadata by clicking on Save to Devices in the bottom-left corner.
- To re-use metadata between different scanners without having to re-enter all the labels again, go to Load from Device in the top-right corner, select the scanner from which to re-use metadata, and click on Load from Device.
- Specify the "zero-age" time: By default, the LSM measures time in relation to the start of the UNIX epoch. This is rarely convenient, so the specification of a reference time is required (for example, the date at which all individuals hatched or reached adulthood).
- To specify the zero-age time information, go to the main page of the web interface, find the desired experiment and the column named Image Analysis, and select Run Analysis.
- On the new page that appears, select New Job for All Regions. In the box named Update Region Information, select Time at which Animals had 0 Age, add the information, and then click on Update Selected Fields.
NOTE: If all the animals do not share the same zero-age time, select instead New Job for Specific Animal Types, and repeat the steps above for each group.
- Schedule the worm detection: The LSM can automate the detection of each nematode based on its position on the plate.
- To start the automated detection of nematodes for each image, go to the main page of the web interface, find the desired experiment and the column named Image Analysis, and select Run Analysis.
- On the new page that will appear, click on New Job for All Regions, then on the box named Schedule a Job for Individual Images, and select the boxes Median Filter > Threshold > Worm Detection > Save Job. These jobs will be applied to all past and future images captured.
NOTE: In order to schedule a job only for a specific strain or condition, click instead on Jobs for Specific Animal Types. Object classification is performed using SVM models that are specified as files stored in the Models subfolder of the LSM's long-term storage directory. V2.0 nematode detection parameter sets for the LSM can be downloaded from the GitHub repository.
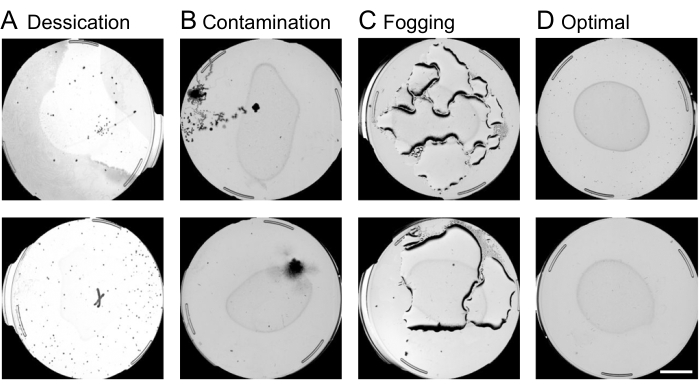
Figure 4: Plate quality control using the web interface. Censoring of suboptimal plates on the web interface before the worm movement analysis is crucial for speeding up the image processing pipeline. Examples of plates subject to removal include conditions of (A) desiccation, (B) contamination, or (C) fogging, as opposed. (D) Optimal plates to be included in further analysis. A scale bar of 10 mm is superimposed onto a preview capture image. Please click here to view a larger version of this figure.
6. Post-image acquisition
NOTE: After worm detection is completed, all data collected from the experiment must be aggregated over time to track each individual across their lifespan and identify all the individuals' death times. Wait until all animals in the experiment have died and until all the worm detection jobs have been completed, and then perform the following steps:
- Schedule the movement analysis:
- The movement analysis integrates all the experimental data over time to estimate the death times. To start this job, go to the main page of the web interface, and find the desired experiment in the column named Image Analysis. Select the link Run Analysis.
- On the new page that appears, click on the link New Job for All Regions, and from the pull-down menu, Schedule a Job for an Entire Region, select Analyze Worm Movement, and click on the button Save Job.
- The LSM image acquisition server will automatically start to analyze movement across all the plates.
NOTE: Movement analysis is the single largest job. On a modern multi-core processor, the analysis of each plate from a 1 month-long lifespan experiment can take 20 min or more.
- Generate a storyboard: After the movement analysis is complete, the LSM storyboard allows users to manually validate the automated results and ensure the software is making correct assumptions about the nematode morphology and behavior.
- On the main page of the web interface, locate the desired experiment and the column named Image Analysis, and select Run Analysis. On the new page that appears, click on New Experiment Job. Then, in the section Schedule a Job for an Entire Region, select Generate Animal Storyboard, and click on Save Job.
- After the LSM has finished generating the storyboard, go to the Worm Browser, and select the desired experiment. Back on the main menu, select Validation > Browse Entire Experiment > Immediately after Each Worm's Death.
- Annotate the storyboards on the Worm Browser: A typical storyboard on the Worm Browser should look like Figure 5.
- Annotate "non-worm" objects
NOTE: Each object detected during movement is shown on the storyboard, ordered by the estimated death time. Unless the user specifies otherwise, each object will be included in the resulting survival curves. The LSM object classification is intentionally calibrated to have a high false-positive rate, as a trade-off to minimize the number of undetected nematodes. The exclusion of non-worm objects is important for obtaining high-quality survival curves (see the representative results). A large number of non-worm objects are typically found on the first and the last pages of the storyboard, which can be quickly manually excluded in bulk.- To exclude non-worm objects on the storyboard, right-click once on the object's image. The excluded object will now be outlined by a white box. To exclude many objects simultaneously, hold the control key, and right-click once on any object, and all objects on the storyboard page will be excluded.
- After excluding an object from analysis, that object can be re-included by right-clicking twice again.
- To save the annotations made during the storyboard annotation, click on the Save button. It is recommended to frequently save the progress while annotating.
- Annotate the death times:
NOTE: Without user intervention, the LSM accurately estimates the death times for most populations. However, it is recommended to routinely confirm the accuracy of the automated results by manually validating a random subset of individuals from each experiment. Extra attention should be paid to the shortest- and longest-lived individuals, as any errors in automated analysis tend to cluster in these groups.- Left-click once on any object of the storyboard to open a new window that displays detailed, time-series information about that object. This window allows the inspection of all the images collected of the object throughout the experiment, as well as the quantification of the object's movement dynamics and morphology. Using the same interface, manually annotate the death times. The interface for death time annotation is shown in Figure 6.
- To manually annotate the death times, left-click on the bottom bar at the point corresponding to the time of death. Use the space bar and right or left arrows of the keyboard to move through the time frames, or click directly on the bar at the desired time frame.
NOTE: The visualization represents the movement state of animals over time, like a horizontal bar graph with the x-axis marking time. The pink/purple section indicates the time period in which the object is moving vigorously, yellow indicates weak movement, red indicates non-moving animals, and green indicates the period of death-associated expansion. Nematodes display characteristic death-associated morphological events: a gradual body contraction usually occurring before death, followed by a rapid body expansion during or immediately after death (Figure 6B). Non-worm objects such as dust or shadows do not show these dynamics in body size and, instead, typically follow a linear, gradual change in size and intensity over time. These different body size dynamics provide a fast and straightforward method for rapid classification and manual exclusion. - Depending on the analysis approach, the death time can be considered as either the time of movement cessation (the start of the red bar in the movement visualization) or as the time of death-associated expansion (the green bar in the movement visualization). To manually annotate contraction and expansion events, right-click on the bottom bar at the desired time frame.
- Some rudimentary mortality data visualizations are provided natively within the Worm Browser client. Survival curves and death time diagnostics are shown for each population present in the storyboard (Figure 7). See the survival curves on the left side and the scatter plot comparing the time of vigorous movement cessation (VMC) to the time of death for each individual on the right side of the storyboard.
NOTE: It is possible to group these results according to different experimental parameters by sub-setting on the bottom bar for conditions such as specific strains, scanners, or plates. Individual worms can be selected based on their death times by left-clicking on individual points in the VMC versus death time plot.
- Annotate "non-worm" objects
- Writing the mortality data to disk: The LSM produces mortality data in the form of CSV files. Plot the outputted survival curves, and analyze them on any statistical software such as R, SAS, STATA, or JMP.
- To generate these files, choose the experiment on the Worm Browser, and on the menu, select Data Files, Death Times, and then click on Generate Death Times for Current Experiment. The LSM will generate an output file with the experiment's survival data, which will be saved in the results directory.
- If by-hand annotations have been performed on the storyboard, a prompt will appear on the Worm Browser asking how to handle by-hand annotations. Click on “Immediately” to include by-hand annotations on the outputted death times file.
NOTE: Mortality data files are written to the results directory specified in the imageserver.ini file. A variety of files are written, but the most commonly used version is "survival_simple/survival=machine_hand", which includes all the manual annotations made using the storyboard. - Analyze the mortality data in the statistical software of choice.
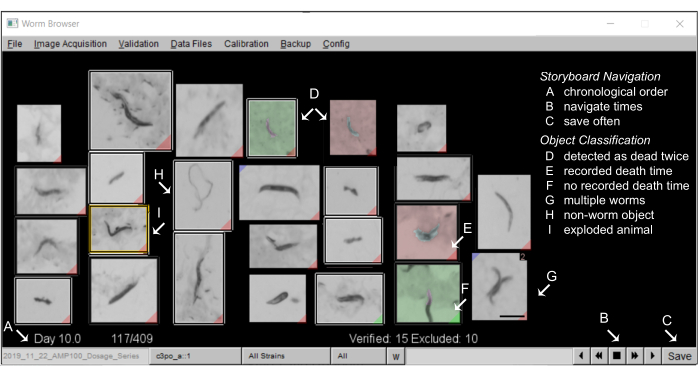
Figure 5: Animal storyboard on the Worm Browser. (A) All stationary worms are shown in chronological order of machine-annotated death time. To navigate the storyboard, press the buttons on the (B) bottom-right corner, and (C) save the annotations often. (D) The images with a non-gray background depict two worm death events (early death as green, later death as red), which can either occur when two worms die close to each other, or when dead worms are moved by a passing worm and are, thus, detected as dead twice. (E) A red tag in the bottom corner of an image identifies worms with a detected death time; (F) a green tag indicates where an object did not remain still long enough to record a death time. (G) Multiple worms in the same frame can be flagged by pressing shift and left-clicking. (H) Non-worm objects are excluded from the analysis by a right-click.(I) Exploded worms are censored from the analysis by clicking on the corresponding image (a by-hand annotation window opens) and pressing shift and right-clicking until an "animal exploded" message appears. A scale bar of 0.5 mm and labels are superimposed on the screenshot of a Worm Browser window. Please click here to view a larger version of this figure.
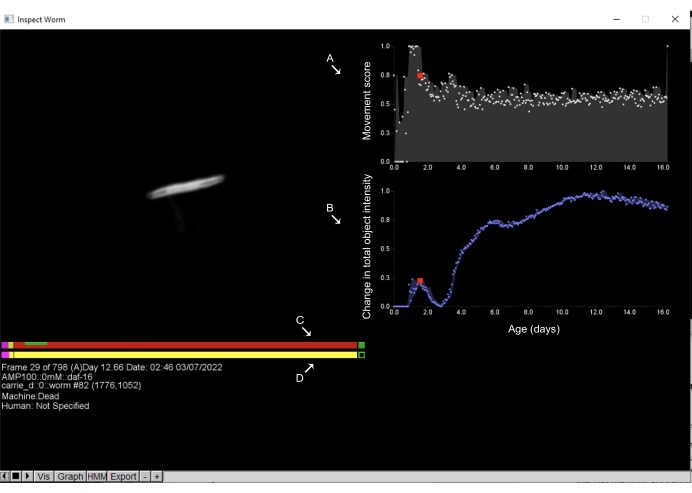
Figure 6: Inspecting objects and annotation of death times on the Worm Browser. Left-clicking on any object on the Worm Browser storyboard opens a new interface and allows the user to inspect the object's movement dynamics. On the right side, the (A) movement score is displayed, which quantifies the object movement; this is estimated by the change in pixel intensities between consecutive observations. Additionally, on the right side, (B) the change in the total object intensity is displayed, which quantifies changes in the object size. On the left side, the upper bar shows the (C) machine estimate of the death time, while the bottom bar is the (D) human by-hand annotation. Clicking on any point of the bars and pressing the space key allows the user to move through the time frames in which the worm has been imaged. On these bars, pink represents the time spent in vigorous movement, red represents the time spent in death, and yellow is everything in between. The time spent in expansion and contraction after the death time is shown in green. Labels are superimposed on the screenshot of a Worm Browser window. Please click here to view a larger version of this figure.
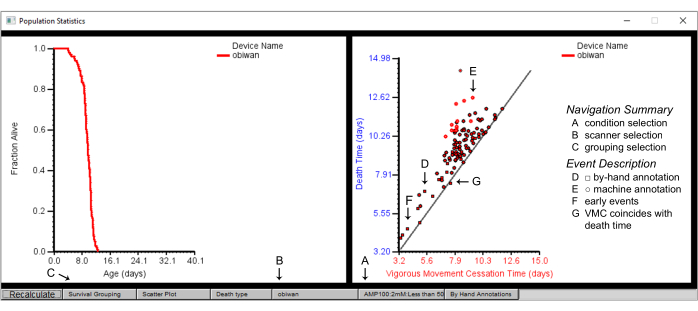
Figure 7: Population summary statistics on the Worm Browser. Population statistics for the scanner device "obiwan", with a plot of the survival (left panel) and a scatter plot of the vigorous movement cessation (VMC) time versus the death time (right panel). The plotted are details of (A) one condition, obtained from (B) one scanner achieved by first selecting (C) the survival grouping by strain. (D) The square shapes in the scatter plot depict the by-hand annotated events, while (E) the circular shapes depict the machine-annotated events. (F) By-hand annotation is often required for death events that occur early or (G) those where the time of vigorous movement cessation time coincides with the death time. Labels are superimposed on the screenshot of a Worm Browser window. Please click here to view a larger version of this figure.
Experimental reproducibility in lifespan assays is challenging and requires both tightly controlled experimental conditions and large populations to achieve sufficient statistical resolution4,36. The LSM is uniquely suitable for surveying large populations of animals in a constant environment with high temporal resolution. To demonstrate the capability of the LSM, highlight the crucial steps of analysis, and help researchers to prioritize their labor efforts, we present a subset of data from an optimal, previously published experiment23. Due to the nature of this experiment as a dose-response assay, a substantial number of animals were required for reliably detecting lifespan alterations. By hand, this experiment would require an intense time commitment from multiple researchers or, if scaled down, lead to underpowered results. The dataset measured quantitative changes in lifespan after removing the RNA polymerase II (b) subunit gene (RPB-2), required for messenger RNA transcription. Using the auxin-inducible system37 in C. elegans, the endogenous locus of RPB-2 was tagged with a degron sequence to conditionally ubiquitylate and degrade RPB-2 using different concentrations of auxin (α-naphtaleneacetic acid). The experiment was performed on AMP100 [rpb–2 (cer135); eft-3p::TIR-1] with cer135 corresponding to the CRISPR-inserted AID tag rpb-2::GFPΔpiRNA::AID::3xFLAG23. The experimental conditions were at a temperature of 20 °C and using UV-inactivated NEC937 (OP50 ΔuvrA; KanR)38 E. coli. Hermaphrodites were sterilized by transferring nematodes during the late L4 stage to plates containing 5-fluoro-2-deoxyuridine (FUdR). Nematodes were transferred during day 2 of adulthood to plates containing different concentrations of auxin. In the original study, the authors showed that in the presence of auxin, RPB-2 degradation shortened lifespan in a dose-dependent manner23.
Here, we demonstrate the contribution that post-experiment data validation and annotation make to the final survival curve output (Figure 8). In the last steps of image analysis within the Worm Browser storyboard, we compared raw survival curves produced before storyboard annotation to the survival curves produced after the manual exclusion of non-worm objects and also to the survival curves produced after the annotation of both non-worm objects and individual death times (Figure 8A–C). We found that the initial survival curves produced before storyboard annotation (Figure 8A) were distorted by the improper inclusion of non-worm objects, which was most apparent in the tails of the survival curves. Before manual annotation, the survival curves included all objects detected by the machine as potential worm objects, approximately half of which, due to the intentionally high false positive rate, were non-worm objects and had to be manually excluded (Figure 8D). This is by design, as the algorithms are calibrated to have a relatively high false-positive rate in order to avoid false negatives, as it is much easier to exclude incorrectly included objects than to search for and recover incorrectly excluded objects. After excluding non-worm objects during manual storyboard annotation, the resulting survival curves were of much higher resolution (Figure 8B,E), and further manual annotation of the death times on the storyboard produced changes of no more than ~4% in the estimated mean lifespan. We, therefore, demonstrate that the removal of non-worm objects during the image analysis pipeline of the LSM is the crucial step for obtaining well-resolved survival curves.
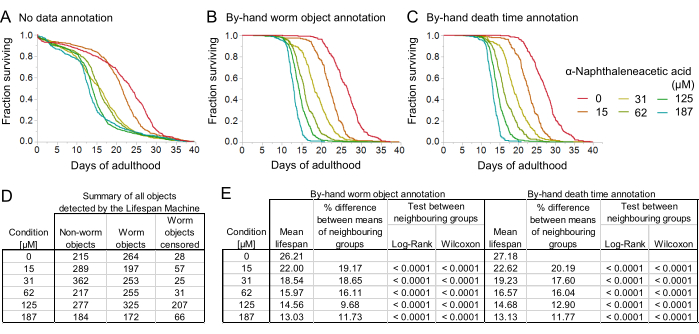
Figure 8: The effect of manual data validation on survival curves. The degradation of RPB-2 shortens the C. elegans lifespan in the presence of auxin (K-NAA: α-napthaleneacetic acid) in a dose-dependent manner. (A) Survival curves plotted from the LSM raw output after quality control of the plates and without manual annotation of the worm objects on the Worm Browser storyboard. (B) Survival curves plotted after manual annotation of the worm objects on the storyboard. (C) Survival curves plotted after manual annotation of the worm objects and death times on the storyboard. (D) Summary of all the objects detected by the LSM. The censored worm objects included objects excluded automatically (for example, due to worms moving outside of the scanned area) or manually by the experimenter (for example, due to worms bursting). (E) Tabular representation of the estimated mean lifespan after by-hand worm object annotation (left) and additional by-hand death time annotation (right). Percentage difference in the mean lifespan between neighboring groups of different auxin concentrations and the statistical power of detection. All graphs were plotted on the statistical software JMP. The data for this figure was adapted with permission from Oswal et al.23. Please click here to view a larger version of this figure.
Moving beyond lifespan as a single end-point for studying aging, we then considered behavioral aging and investigated which steps of the post-experimental image analysis were most crucial for measuring it. Focusing on the relationship between vigorous movement cessation (VMC) and lifespan, we compared the LSM output at different stages of image analysis and validation (Figure 9A–D). We found that non-worm objects showed a unique relationship between the apparent VMC and lifespan, with the two being annotated as occurring nearly simultaneously in every object (Figure 9A). In contrast, true nematodes usually ceased moving vigorously several days prior to their death time (Figure 9A). This difference in the relationship between VMC and lifespan provides an additional means for rapidly identifying and excluding non-worm objects.
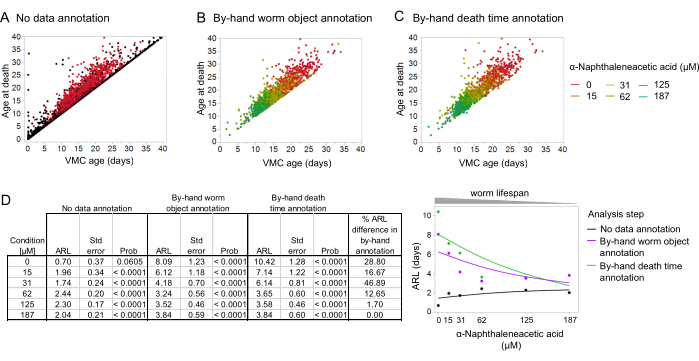
Figure 9: The effect of manual data validation on vigorous movement cessation (VMC) analysis. (A) Behavioral aging data without manual annotation of worm objects on the Worm Browser storyboard, displaying the relationship between the death times and VMC times in non-worm objects (in black) versus worm objects (in red). (B) Behavioral aging data plotted after manual annotation of worm objects on the storyboard. (C) Behavioral aging data plotted after manual annotation of worm objects and death times on the storyboard.(D) Tabular representation of the average remaining lifespan (ARL; obtained from the intercept between the death age and VMC age) across different steps of the image analysis pipeline and percentage difference in the ARL between worm object annotation and further death time annotation. (E) Graphic representation of the estimated ARLs across different steps of the post-image acquisition analysis, and their relationship to the worm lifespan (which is dependent on the auxin concentration: α-napthaleneacetic acid). The spline fit was performed using a cubic spline method. All graphs were plotted on the statistical software JMP. The data for this figure was adapted with permission from Oswal et al.23. Please click here to view a larger version of this figure.
We found that annotation and exclusion of non-worm objects using the Worm Browser was sufficient to provide a rough estimate of the relationship between the VMC and death times (Figure 9A–C), recapitulating the expected dynamics of the physiological decline in nematodes23. To further explore this, we considered the same RNA polymerase II data set and estimated the average remaining lifespan (ARL) after VMC for each subpopulation as the intercept of a linear regression model relating the lifespan to VMC. To understand the effect of data annotation on the ARL, we recalculated the ARL after each step of data annotation (Figure 9E). We found that the manual annotation of death times in behavioral aging analysis was especially important in longer-lived worms, in this instance, those exposed to the lowest concentrations of auxin (Figure 9D,E). In contrast to its minimal effect on the survival curves, manual annotation of the death times had a substantial effect on the quantitative relationship between the VMC and lifespan, increasing the estimated ARL, for instance at 0 µM of auxin, from 8.09 days to 10.42 days after death time annotation; this represents an ARL difference of 29%. Therefore, we found that the relationship between VMC and death times explained by ARL was much more sensitive to by-hand annotation of the death times compared to measurements of death times for lifespan alone. This sensitivity can be explained by the relative durations of the ARL and the lifespan; the same adjustments to death time will usually be small relative to the lifespan but large relative to the ARL. Thus, adjustments to the death times will have a larger relative effect on the ARL compared to the lifespan.
Supplementary File 1: Structure of the Lifespan Machine experiment schedule file. The experiment schedule consists of three parts. First, the basic information about the experiment is included, such as the name and capture specification. From this part, generally only the name of the experiment needs to be changed for each new experiment. The second part of the document is generated by exporting scan areas from the Worm Browser and specifies the physical location of the scan areas for each scanner ("asuna", "bulma", "moscow", "rio", "yuno", and "yuki" in this example). These are replaced for each new experiment and are copied from the TXT files generated for each scanner individually during step 4.1.2.3. The third part of the document provides information about the duration of the experiment, which should also be modified for each new experiment, and the capture frequency. The device will scan each defined area one at a time at specified intervals for the duration of the entire experiment. Please click here to download this File.
