Convection-enhanced delivery (CED) has been proposed as a treatment option for a wide range of neurological diseases. In order to prepare health care professionals for adoption of CED, accessible training models are needed. We describe the use of agarose gel as such a model of the human brain for testing, research, and training.
Convection-enhanced delivery (CED) has been proposed as a treatment option for a wide range of neurological diseases. Neuroinfusion catheter CED allows for positive pressure bulk flow to deliver greater quantities of therapeutics to an intracranial target than traditional drug delivery methods. The clinical utility of real time MRI guided CED (rCED) lies in the ability to accurately target, monitor therapy, and identify complications. With training, rCED is efficient and complications may be minimized. The agarose gel model of the brain provides an accessible tool for CED testing, research, and training. Simulated brain rCED allows practice of the mock surgery while also providing visual feedback of the infusion. Analysis of infusion allows for calculation of the distribution fraction (Vd/Vi) allowing the trainee to verify the similarity of the model as compared to human brain tissue. This article describes our agarose gel brain phantom and outlines important metrics during a CED infusion and analysis protocols while addressing common pitfalls faced during CED infusion for the treatment of neurological disease.
Convection-enhanced delivery (CED) has been proposed as a treatment option for a broad spectrum of neurological disorders including malignant brain tumors, epilepsy, metabolic disorders, neurodegenerative diseases (such as Parkinson disease)1, stroke, and trauma2. CED employs positive pressure bulk flow for the distribution of a drug or other infusate. CED provides safe, reliable, and homogenous delivery of molecular weight compounds, ranging from low to high, at clinically relevant volumes3. Traditional drug delivery to brain tissue is severely restricted by the blood-brain barrier4. Formed by the tight junctions between endothelial cells that make up the capillaries in the brain, the blood-brain barrier blocks polar and high molecular weight molecules from entering the parenchyma of the brain. Direct intraparenchymal brain infusion via CED can overcome the limitations of previous therapeutic drug delivery modalities and allows the use of therapeutic agents that would not cross the blood-brain barrier, and therefore have been previously unavailable as viable treatment options5.
Researchers from the US National Institutes of Health (NIH) described CED in the early 1990s as a means of achieving greater therapeutic drug concentrations than by diffusion alone6-8. The first methods of CED involved implanting one or more catheters into the brain, connecting an infusion pump to the catheter, and pumping the therapeutic agents directly into the targeted region. The increased distribution fraction and relatively stable concentration is reported to occur as the positive pressure created by the infusion pump causes the tissues to dilate and allow for permeation of the drug9.
The fundamental technique for CED remains largely the same as it was first described. Advances in catheter design10, infusion technique11, line pressure monitoring2, and real time MRI monitoring to correct for brain shift12,13, optimize multiple collinear infusions14, and monitor for infusate loss15 have increased the safety and efficacy of the treatment10. Additional importance has been placed on the catheter design and infusion strategy including flow rate. Successful CED, with limited catheter reflux and tissue damage, has been correlated with catheter design and infusion rate. The use of a catheter with a narrow diameter and a low infusion rate to limit backflow along the brain-catheter interface as well as limit damage at the catheter tip16. MR imaging provides visual confirmation of the correct location for infusion catheter placement, and thus drug delivery, while also allowing for correction of infusion reflux or aberrant delivery17. MR images can also be used to approximate and track the volumes of distribution (Vd) of the infused drug. The Vd is calculated using an MR imaging signal intensity value greater than three standard deviations above the mean from the surrounding non-infused gel as a threshold for segmentation18. The Vd is a useful measurement for CED because it represents the volume of the drug distributed in the brain. Along with the volume infused (Vi), a ratio can be generated (Vd/Vi) quantifying the volume covered by the infused drug.
Agarose gel phantoms mimic several crucial mechanical properties of the human brain important for understanding CED such as: Vd, gel-catheter interactions, poroelastic properties, and infusion cloud morphology10. Mixtures of 0.2% agarose gel have been shown to mimic in vivo changes in local pore fraction caused by gel dilation due to CED. A similar pore fraction to human brain promotes similar interactions and accurate measurements of Vd19. Additionally, similar concentrations of agarose gels such as 0.6% and 0.8% have shown similar infusion pressure profiles to the brain20. Further, the translucent agarose gels provide the advantage of real-time visualization of catheter placement and infusion reflux. Agarose gel phantoms are relatively inexpensive to produce. The cost of the agarose gel phantoms may be key to future widespread training throughout neurological surgery. Due to these properties, agarose gels provide a useful surrogate, replicating many of the key attributes of human brain infusions without the use of brain tissue.
As stated above, image-guided CED into agarose gel models provides a beneficial in vitro method for testing, research, and training. The purpose of this article is to describe how to recreate agarose gel phantoms, to outline appropriate CED testing and analysis protocols, and to address common errors faced during CED infusions for the treatment of neurological disease.
1. Preparation of Gel Phantoms and Dye
2. Preparation of Infusion System
3. CED Gel Infusion and MR Scanning
4. MR Data Analysis
Interpreting and analyzing CED infusions involve several important factors such as distribution fraction and infusate reflux. The distribution fraction calculation depends heavily upon the calculation of the Vd. Therefore accurate interpretation of the MR images is critical. We propose a semi-automated method for reliably reproducing these measurements as listed above. These methods objectively determine the cross sectional area of the infusate cloud and an approximate radius. While variable, in agarose gel the infusion cloud often proved spherical. Assuming a spherical infusate cloud, this radius can be used to determine the Vd for the CED infusion. Vd/Vi for the agarose gel infusion can then be calculated with the measured volume infused. Agarose gel at 0.2% concentration has proven a reasonable representation of brain tissue with a Vd/Vi ratio of 5.0 10, falling in between measured Vd/Vi ratios of brain tissue ranging from 3.1 to 5.2 21,22.
The pressure measurements taken during the CED infusion are also important for ensuring the infusion remains stable and constant. Detected pressure spikes may indicate errors in the infusion such as air bubbles or blockages in the catheter. The pressure profile of the infusion is expected to initially peak before decreasing to a relatively stable plateau for the duration of the infusion20.
The main detriment to the success of the infusion is air in the infusion line. Air alters the measurement of the infusion pressure as well as the volume of the dye being infused. It may also cause local tissue disruption and affect the distribution of the infusate. A successful study was performed using coaxial catheters that yielded parameters to minimize or eliminate the effects produced by air escape into the infusion site23. From our study, we identify a need for future investigations into proper methods of CED infusions using single cannula catheters such as the SmartFlow catheter to equally minimize or eliminate the presence of air.
A key parameter for identifying the presence of air in the infusion line is infusion pressure. As shown by the infusion pressure (mmHg) line in Figure 2, there is a spike in the infusion line pressure at the same time that air is introduced into the catheter line. Comparing the pressure readings to the MR image timestamps, a pressure spike may indicate the presence of an air bubble prior to MR image confirmation. This suggests pressure may be a potential warning marker for detecting and preventing the inappropriate delivery of air in vivo. There was time between the initial spike in pressure and when the air was actually delivered into the gel. That is important to note since air should not be infused into the brain during an actual procedure. If increased pressure was observed in an actual case there might be ample time to keep air from reaching the infusion site within the brain.
Once the air reaches the catheter tip, growth of the air bubble can be seen in the MR images as shown in Figure 3, panels A-F. The air bubble causes enlargement and irregularity of the dye acorn and also alters the measurement of Vd. Thus, it is important to identify and validate a method to prepare the system that consistently ensures it is devoid of air prior to placing the catheter, making certain air does not impair the infusion. One way to prevent air entering the catheter may be to begin the infusion prior to insertion of the catheter into the agarose gel.
Backflow of the infusate along the catheter-gel interface can adversely affect the infusion by allowing the infusate to exit the target. While backflow can occur at any point during an infusion, there is an increased incidence of backflow at the start of the infusion and when increasing the infusion rate10. Backflow has also been associated with the presence of air bubbles, catheter insertion technique, and catheter design, though back flow may still occur despite controlling for these variables23. To minimize backflow, a stepped, reflux resistant catheter was used, and the infusion rate was held constant and as low as possible (1.667 μl/min). One can also avoid unnecessary backflow by preventing pressure spikes. Along with catheter diameter, initial infusion pressure spikes (IIPS) (associated with the expulsion of an end-catheter occlusion) have been shown to increase the probability that backflow will occur. Therefore, a “trickle” technique was used where the infusion was initiated at the minimum rate just prior to insertion. Porous membrane catheters, as well as valve tip catheter designs, have been proposed to mitigate end port occlusions and associated IIPS.
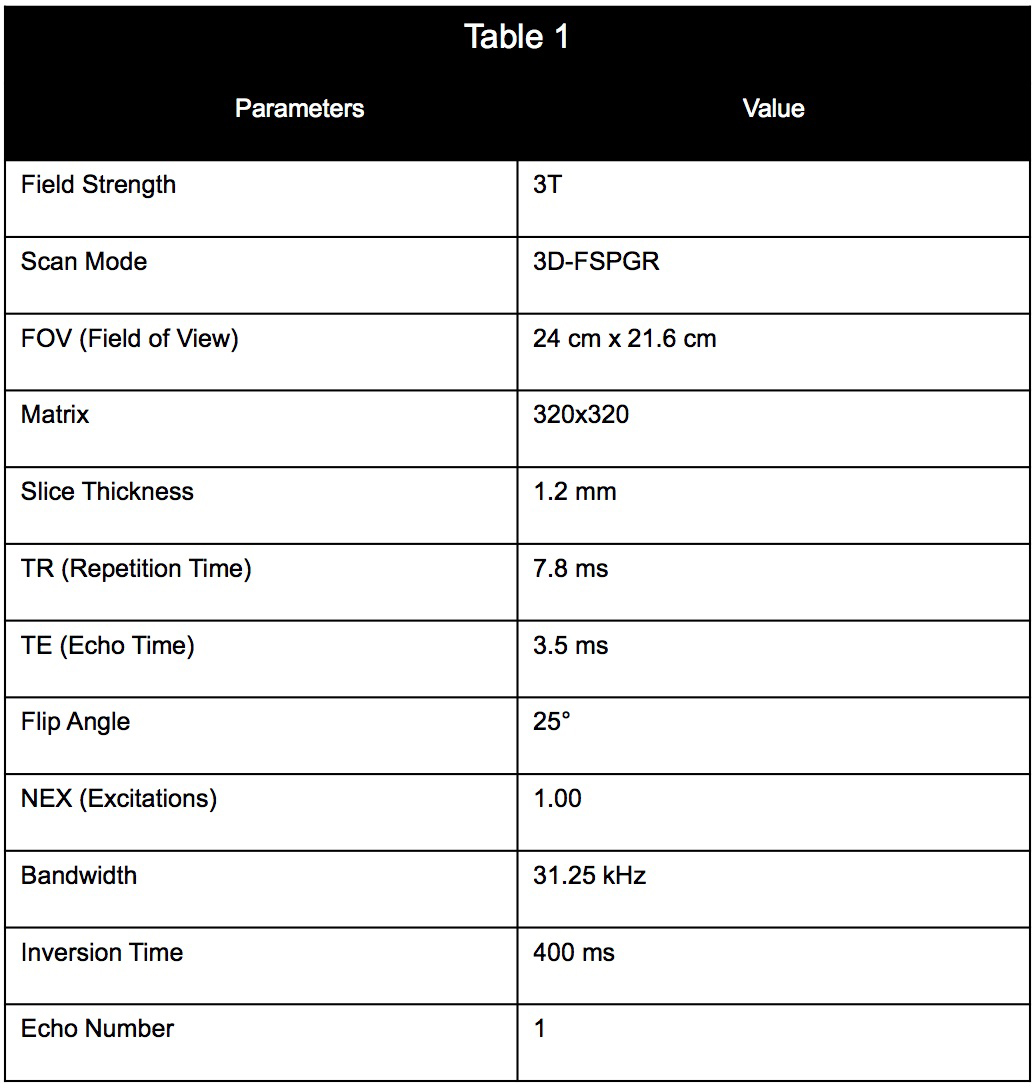
Table 1. Imaging parameters and values used for the MR scan of the infusion.
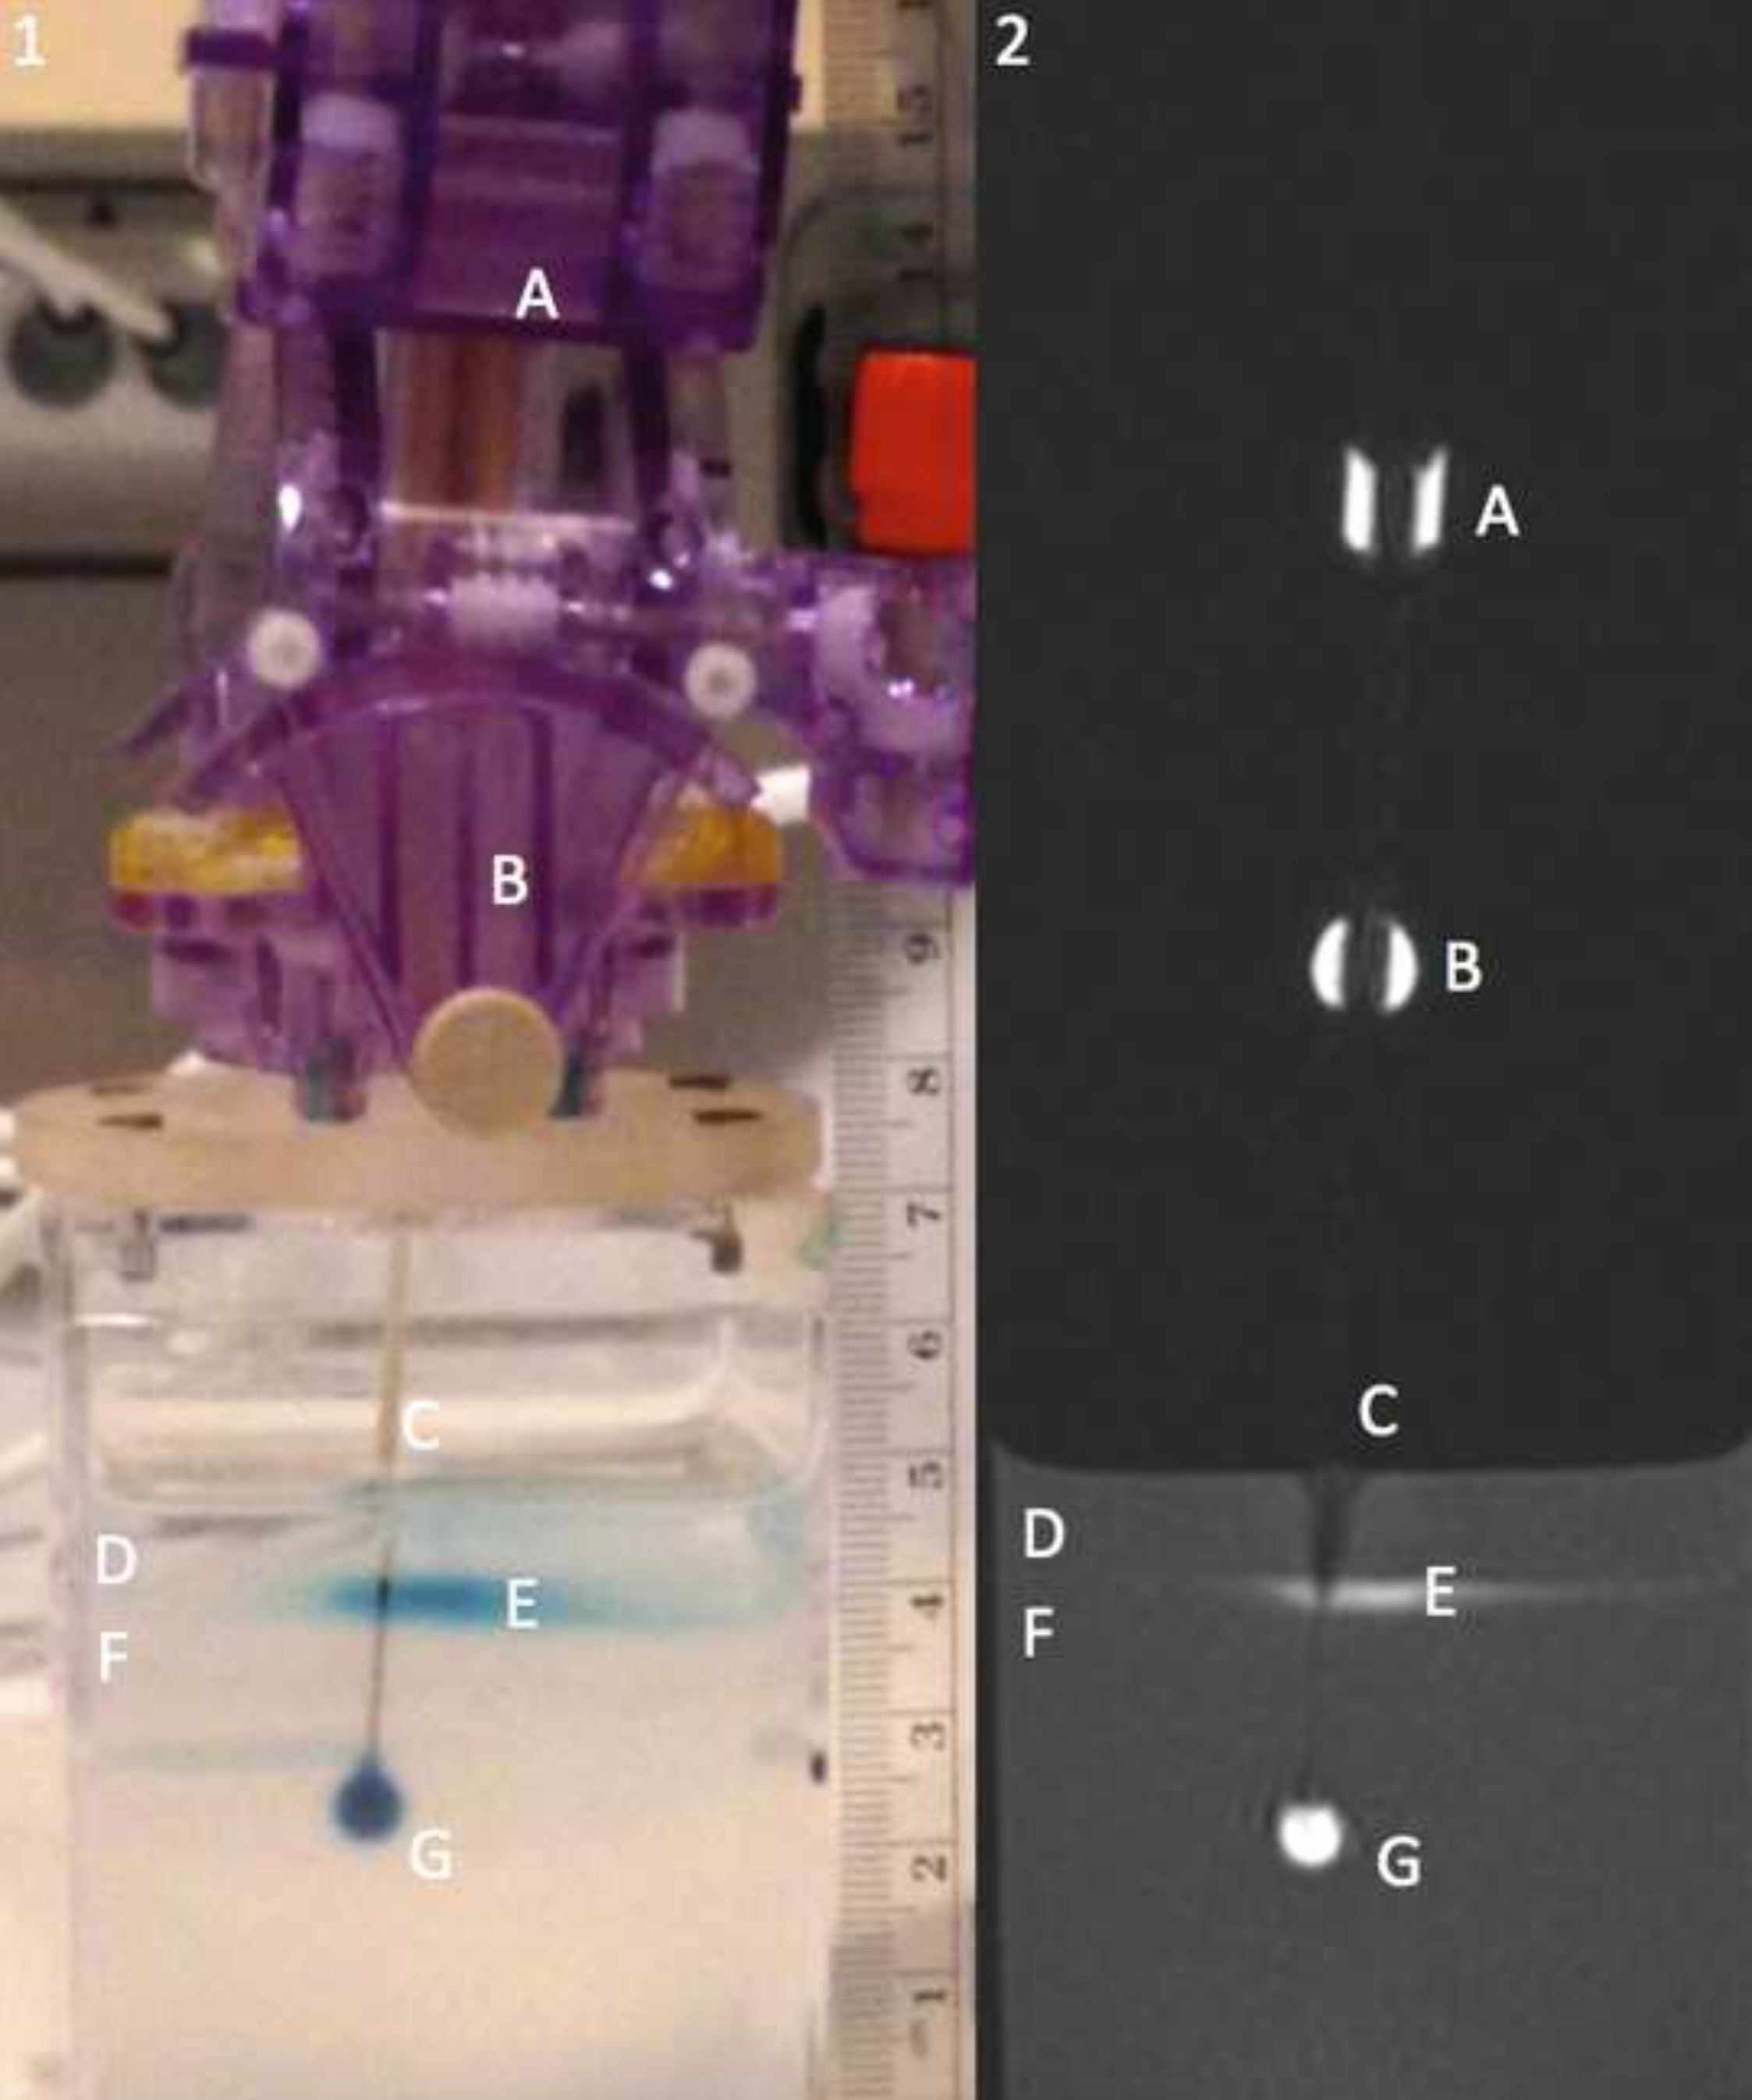
Figure 1. Panel 1 showing a picture of the catheter mount and agarose gel alongside panel 2 containing a MR image of the agarose gel showing a cross section of infusion catheter. Labels as follows: the MR visible trajectory guide can be seen by labels A and B, the infusion catheter by label C, the water on top of the agarose gel by label D, pooling contrast agent at the gel water interface by label E, the agarose gel by label F, and the infusion cloud by label G.
Figure 2. Graph demonstrating the effects of air on the CED infusion. Air was noted in the infusion line 15 min into the infusion. At 17 min a spike in the pressure was recorded, as shown by the green line. The air bubble also has a drastic effect on the Vd and Vd/Vi ratio as seen by the blue and brown dashed lines respectively. Upon air entering the line, the Vd spiked from approximately 5 to 9 μl; while the Vi remained linear. Please click here to view a larger version of this figure.
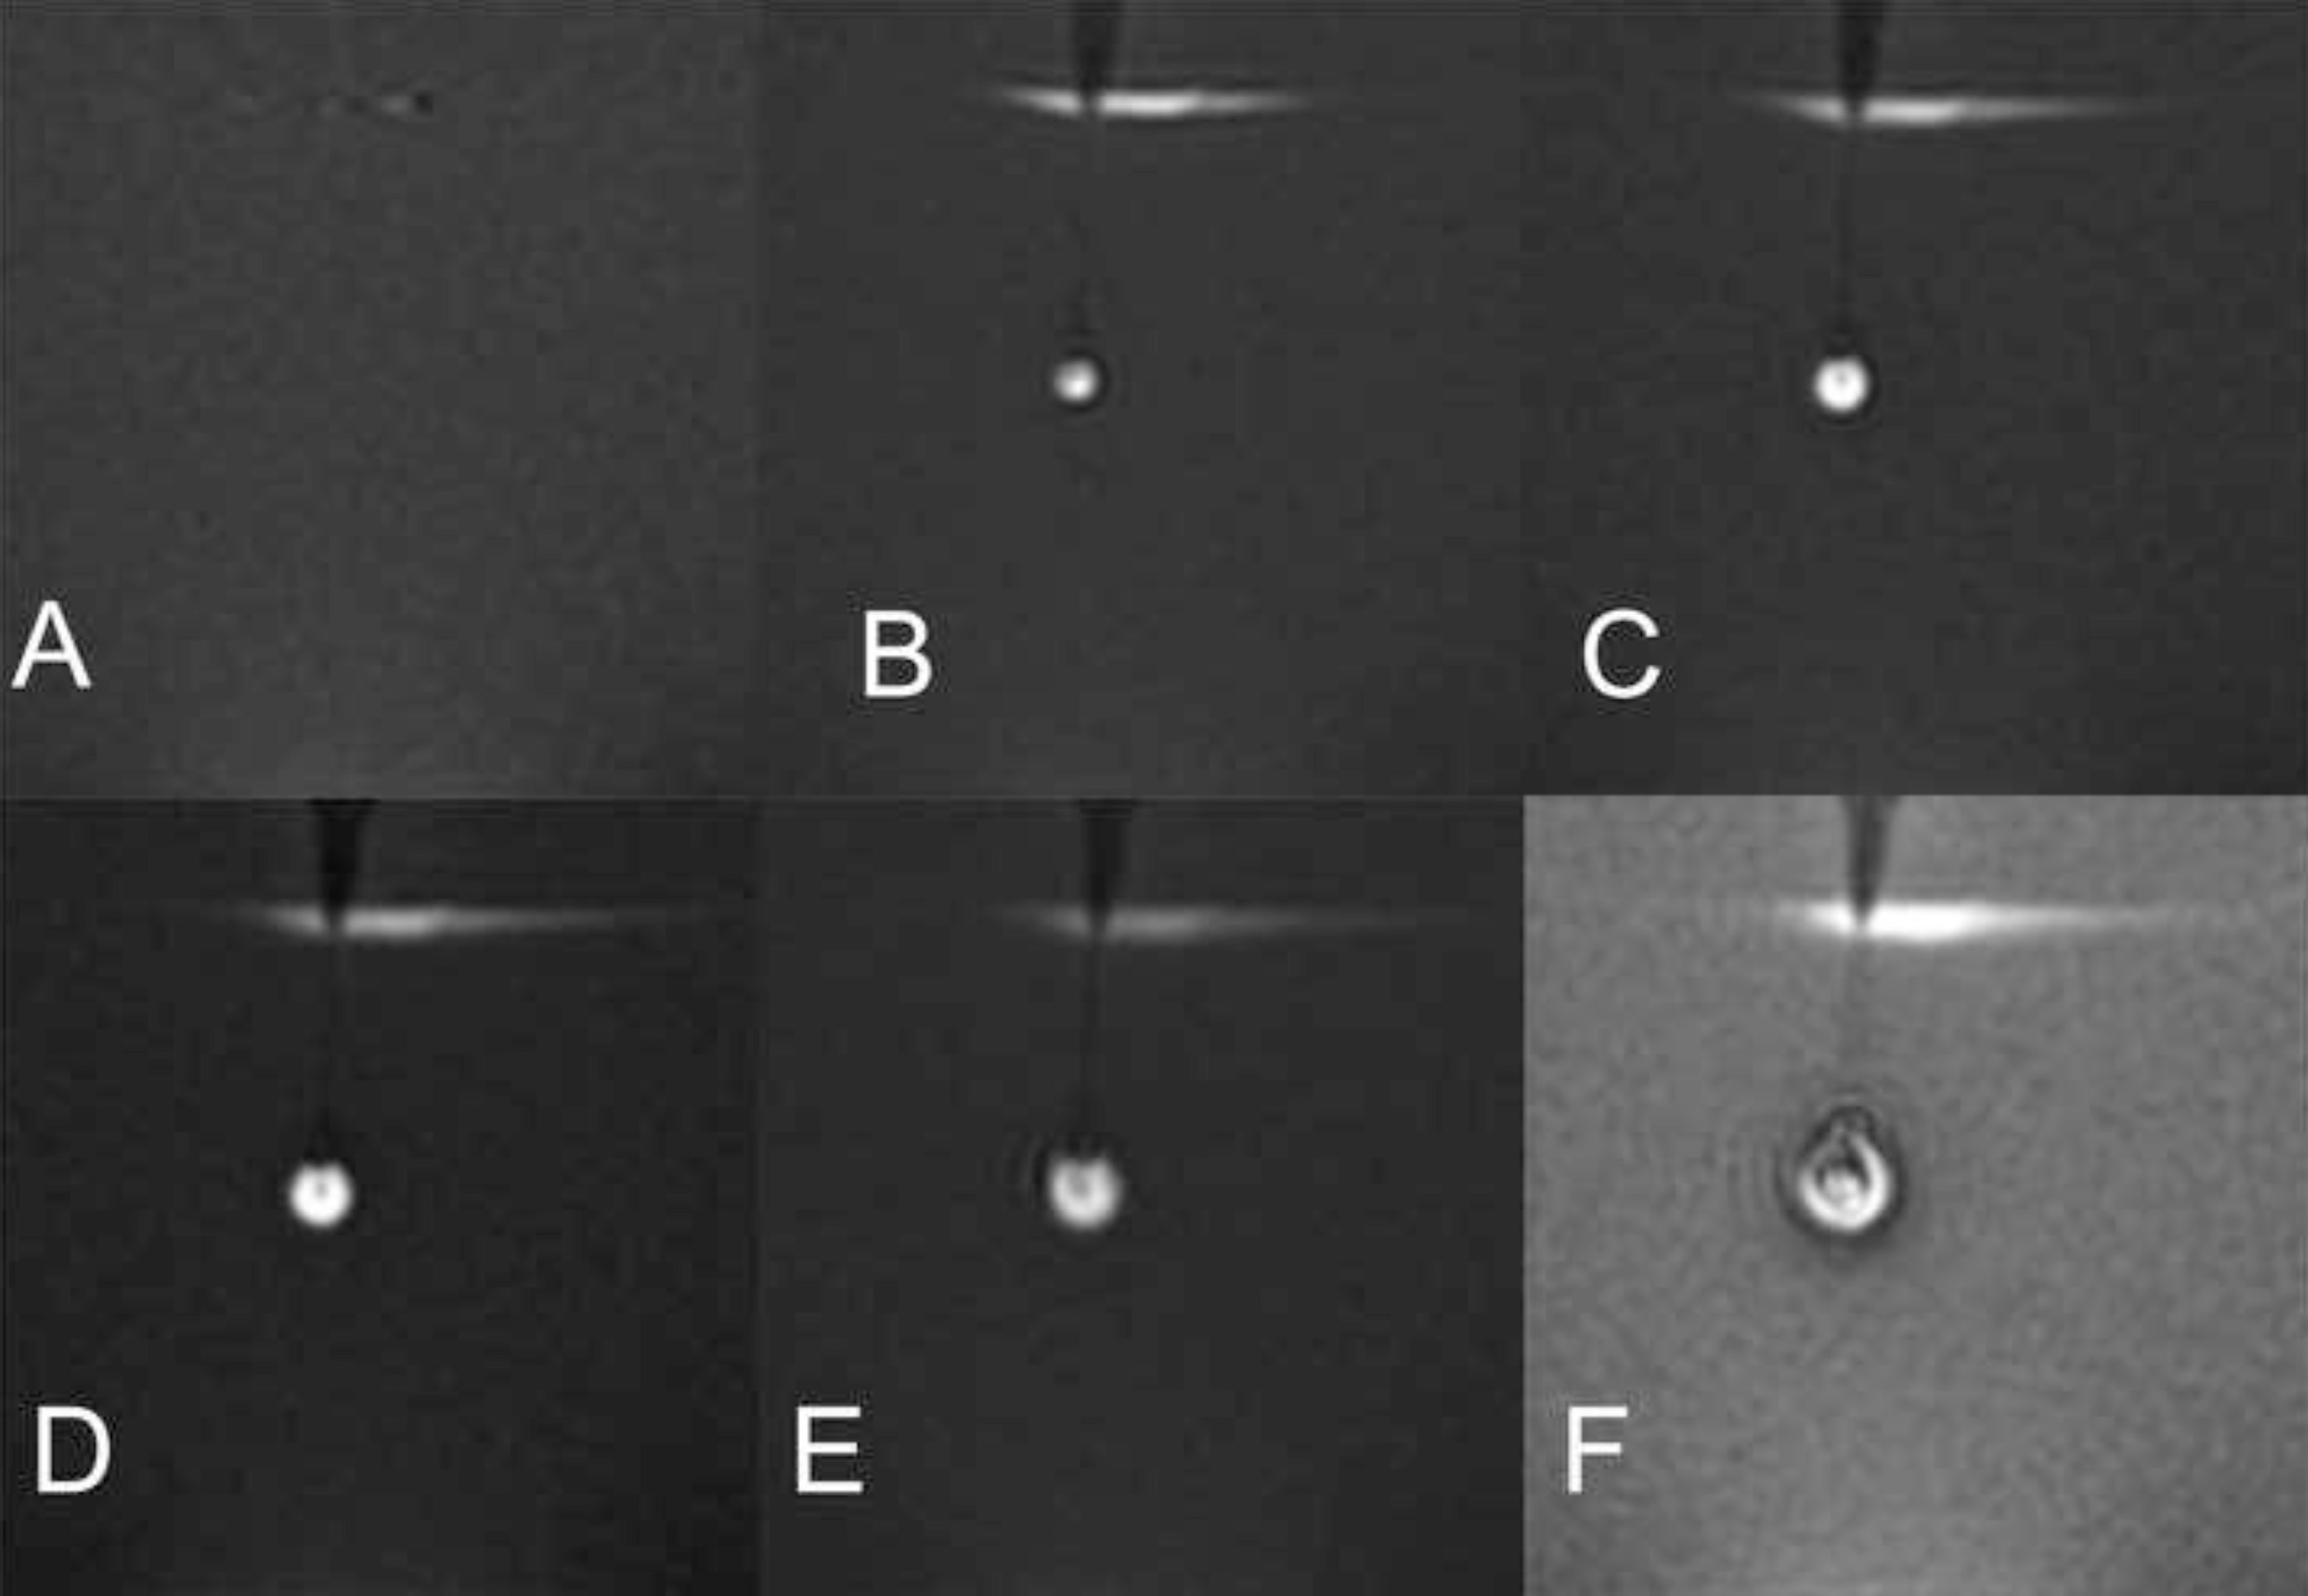
Figure 3. Magnetic resonance images showing growth of the infusion cloud and enclosed air bubble. The first image shows the gel prior to insertion of the catheter, the second image shows the insertion of the catheter after beginning the infusion, and the subsequent time lapse shown is in approximately 4-min intervals. The air bubble distorts the true volume of the infusate cloud and prevents accurate measurement of Vd. Air was seen entering the infusion catheter immediately prior to the MR scan. Panels A-F correspond to points A-F in Figure 2, demonstrating the progression of the infusion.
The critical steps for ensuring the success of the infusion are: purging the infusion line of air, mixing the agarose gel, analyzing the MR data, using small inner catheter diameters, using stepped catheter designs to minimize backflow, and minimizing the pressure felt by the gel or tissue into which the drug is being infused. As previously stated, the main detriment to the success of the infusion is infusion line air. Correctly and thoroughly purging the infusion line of air is critical to ensure no air enters the infusion. Equally as important is mixing of the agarose gel. Improper synthesis of the gel could lead to large variations in concentration and consistency, which in turn will cause fluctuations in infusate distribution. Consistent MR data analysis is key for accurate and objective measurements of Vd and Vd/Vi ratios. Precisely following the steps outlined in the protocol provides a consistent method for analyzing the MR data.
However, these techniques are not without limitations. When inserting the catheter, the agarose gel may fracture or lacerate unpredictably10. This unpredictable nature of the agarose gel could cause changes in the gel-catheter interface making it dissimilar from human brain tissue and unusable. Additional limitations may arise from assuming a spherical infusion cloud for calculation of the Vd. While spherical infusion clouds were common with infusions into agarose gel, attempting to reproduce the infusion in vivo may yield different results. Brain tissue is more anisotropic, more heterogeneous, and contains more regional anatomical boundaries than agarose gel and therefore will cause variance in infusion cloud morphology10. It is important to note that these Vd were approximated grossly, without taking into account the presence of magnetic susceptibility artifacts, which may decrease the signal intensity of the infusate cloud. For the purpose of this manuscript we made the assumption of anisotropic diffusion and we understand that this is an estimate. Additional modifications to the current technique may exist to improve consistency and accuracy of the results. Modifications may include additional purging of the lines to further prevent air in the infusion or using software to more accurately calculate a 3D volume to avoid assuming a spherical infusate cloud. Methods of computer modeling as described by Linninger et al. may be used to more accurately predict and measure the CED infusion cloud volume24,25.
Compared to existing methods that require cadaveric or animal brain tissue, agarose gel provides a more easily accessible model for CED testing. The translucent nature of agarose gel also offers real-time visualization of the infusion. This real-time visualization gives the trainee the ability to see reflux or air bubbles in the infusion before it is detected by the MR, allowing for quick correction and modification. For future applications, agarose gel provides the accessible models needed for future testing, research, and training in CED.
The authors have nothing to disclose.
The authors would like to thank the staff from the MRI facilities at the Semmes-Murphey Clinic, Memphis, Tennessee as well as the Neurosurgical department at The University of Tennessee Health Science Center in Memphis, Tennessee.
Prohance | Bracco | Gadoteridol radio contrast media | |
Bromophenol Blue Dye | Biorad | 161-0404 | Dye for infusate visualization |
Agarose Gel Powder | Biorad | 161-3101EDU | Agarose powder for creating gels |
Medrad Veris MR Vital Signs Monitor | Medrad | MR safe infusion pressure monitor | |
16 Gauge SmartFlow Catheter | SurgiVision | Infusion catheter | |
Medrad Continuum MR Infusion System | Medrad | MR safe infusion pump | |
SMART Frame MRI Guided Trajectory Frame | ClearPoint | Infusion catheter frame | |
Osirix Imaging Software and DICOM Viewer | Osirix Imaging Software | OsiriX 32-bit DICOM Viewer |