Real Time Analysis of Metabolic Profile in Ex Vivo Mouse Intestinal Crypt Organoid Cultures
Summary
Small intestinal crypt organoids cultured ex vivo provide a tissue culture system that recapitulates growth of crypts dependent on stem cells and their niche. We established a method to assay the metabolic profile in real time in primary mouse crypt organoids. We found organoids maintain physiological properties defined by their source.
Abstract
The small intestinal mucosa exhibits a repetitive architecture organized into two fundamental structures: villi, projecting into the intestinal lumen and composed of mature enterocytes, goblet cells and enteroendocrine cells; and crypts, residing proximal to the submucosa and the muscularis, harboring adult stem and progenitor cells and mature Paneth cells, as well as stromal and immune cells of the crypt microenvironment. Until the last few years, in vitro studies of small intestine was limited to cell lines derived from either benign or malignant tumors, and did not represent the physiology of normal intestinal epithelia and the influence of the microenvironment in which they reside. Here, we demonstrate a method adapted from Sato et al. (2009) for culturing primary mouse intestinal crypt organoids derived from C57BL/6 mice. In addition, we present the use of crypt organoid cultures to assay the crypt metabolic profile in real time by measurement of basal oxygen consumption, glycolytic rate, ATP production and respiratory capacity. Organoids maintain properties defined by their source and retain aspects of their metabolic adaptation reflected by oxygen consumption and extracellular acidification rates. Real time metabolic studies in this crypt organoid culture system are a powerful tool to study crypt organoid energy metabolism, and how it can be modulated by nutritional and pharmacological factors.
Introduction
Colorectal cancer (CRC) is the third leading cause of cancer related deaths in the United States. Sporadic colon cancer – i.e. that arising later in life (>50 years of age) and with no clear predisposing genetic factors – accounts for ~80% of all cases, with incidence strongly influenced by long term dietary patterns1,2. These tumors exhibit a metabolic shift towards dependence on oxidative glycolysis, known as the Warburg effect, which may in part make higher concentrations of cellular building blocks and energy available (through glutaminolysis) to permit and perhaps drive high rates of tumor cell proliferation3-5. Studies of colon cancer as well as other gastrointestinal cancers including small intestine cancers provide important insight into the cause of tumor formation. Investigating the metabolic differences between normal, pro-tumorigenic and tumorigenic states of gastrointestinal organ systems may assist determination of relative risk for tumor development as well as early detection of neoplasia. Moreover, understanding bioenergetic metabolism involving mitochondrial respiration and glycolysis will provide fundamental insight into how cell physiology, aging and disease state perturbs intestinal homeostasis. Utilization of the bioenergetics assay technology for extracellular flux analysis can assess the rates of mitochondrial respiration and glycolysis simultaneously in cells growing in culture in real time6,7.
Until recently, in vitro studies of small intestine were limited to cell lines derived from either benign or malignant tumors8,9 and did not represent the physiology of normal intestinal epithelia and the influence of the microenvironment in which they reside. In 2009, Sato et al.10 introduced an ex vivo culture system to grow three-dimensional (3D) mouse intestinal epithelial organoids, or epithelial “mini-guts”, suitable for experimental, diagnostic and therapeutic investigations10,11. Moreover, crypts isolated from calorically restricted mice maintain their altered growth properties as organoids in such cultures12. Compared to transformed cell lines, crypt organoid cultures can be used to generate physiologically relevant data presenting a far better model to understand the in vivo state.
We adapted bioenergetics analysis technology to assay energy metabolism of intestinal crypt organoids. Mouse intestinal crypt organoids were cultured ex vivo to develop the crypt organoid energy metabolism studies presented. The oxygen consumption rate (OCR) and the extracellular acidification rate (ECAR) of crypt organoids were measured in the absence and presence of two different metabolic inhibitors (oligomycin, rotenone) and an ion carrier (carbonyl cyanide-p-trifluoromethoxyphenylhydrazone). The crypt organoid metabolic response to these chemical compounds were successfully reflected through changing ECAR and OCR values.
Cellular bioenergetic studies will elucidate the reciprocal interactions between metabolic state and disease risk and phenotype in cancer, obesity, diabetes, metabolic disorders and mitochondrial diseases and help advance screening methods with direct implications for translational medicine. Here, we describe a detailed protocol to isolate small intestinal crypts and to culture crypt organoids. Moreover, we introduce a novel method to use crypt organoid cultures for metabolic assays.
Protocol
This study was performed in accordance with the recommendations in the Guide for the Care and Use of Laboratory Animals of the National Institutes of Health. The protocol was approved by the Committee on the Ethics of Animal Experiments of the Albert Einstein College of Medicine.
1. Crypt Isolation and Culture
- Isolation of Crypts from the Small Intestine:
- Isolate intestinal crypts from any mice model of interest. Euthanize the mice with CO2 followed by cervical dislocation.
- Open up the abdomen longitudinally and fill the small intestine (SI) with ice cold phosphate buffered saline, PBS (-Ca2+; -Mg2+) with 2x antibiotic–antimycotic (anti–anti). Rapidly isolate small intestine.
- Thoroughly dissect free of mesenteric fat using a scalpel. Be careful not to perforate the tissue – at all times keep the tissue moist with ice cold PBS. Open up intestine longitudinally and wash thoroughly with ice cold PBS.
- Cut small intestine into two sections and flatten out using a wet cotton tip, gently scrape off the villi using a pre-cooled slide. Wash vigorously in ice-cold PBS several times.
- Incubate 3 min in 20 ml 1x PBS per 3 mM ethylenediaminetetraacetic acid (EDTA)/0.5 mM dithiothreitol (DTT) for non-enzymatic dissociation of the tissue.
- Cut tissue into small pieces (2-4 mm) using a razor blade on a pre-cooled slide. Transfer the pieces into a 50 ml tube containing 20 ml ice cold PBS.
- Pipette up and down gently 10x using a 10 ml sterile disposable pipette. Let tissue fragments sediment by gravity. Remove the supernatant with a pipette. Repeat three additional times; make sure supernatant is clear.
- Add 20 ml of PBS per 2 mM EDTA. Swirl and incubate at 4 °C for 30 min with gentle rocking.
- Let tissue sediment and discard supernatant. Add 15 ml ice cold PBS and pipette up and down 5x with a 10 ml pipette. Let the tissue fragments sediment and collect the supernatant as Fraction 1 (F1). Repeat collecting F2-F5, each fraction maintained separately.
- Add 15 ml ice cold PBS and this time shake vigorously by hand for 15 sec. Collect F6 and repeat for F7, F8. If tissue pieces start to float, tap to help them settle.
- Inspect an aliquot of each fraction under the microscope. Pool those fractions containing crypts.
- Pass the pooled fractions through a 70 µm nylon cell strainer, collecting crypts in a 50 ml tube.
- Centrifuge at 100 x g for 5 min at 4 °C, discard the supernatant and resuspend pellet in 10 ml ice cold PBS with 2x anti–anti and transfer crypts to a 15 ml tube. Repeat the wash one more time.
- Wash the crypts once with 10 ml ice-cold ADF, Advanced DMEM/F-12 (Dulbecco"s Modified Eagle Medium/Ham"s F-12) – 2x anti–anti.
- Wash the crypts once with 10 ml ADF – 1x anti–anti.
- Count the crypts using a hemocytometer. Adjust the crypt solution volume and transfer to a 1.5 ml tube so that the final crypt concentration when resuspended will be 100-500 crypts per 50 µl of gelatinous protein mixture (Matrigel). Centrifuge at 100 x g for 5 min at 4 °C and resuspend crypts in the gelatinous protein mixture.
- Plate 50 µl of crypt – gelatinous protein mixture suspension per well in a 24-well plate (growth area: 2 cm2), carefully placing the suspension drop in the center of each well. Maintain the plate in a CO2, 37 °C incubator for ~30 min until the suspension solidifies.
- Add 500 µl ice cold complete culture media (Advanced DMEM/F12 with 1x anti – anti, 10 mM 4-(2-hydroxyethyl)-1-piperazineethanesulfonic acid (HEPES), 1x GlutaMAX, 1x B27 Supplement, 1x N2 Supplement, 1 mM N-Acetyl-L-Cysteine (NAC), 50 ng/ml Epidermal growth factor (EGF), 100 ng/ml Noggin, 500 ng/ml R-Spondin).
- Reconstitute growth factors in 0.1% Bovine Serum Albumin (BSA) in PBS.
- Crypt Organoid Culture and Passage:
- Passage crypt organoids 14-21 days post seeding (or as needed) as follows:
- Change media every Friday and Monday. On Wednesdays, replace half the media with fresh media.
- Remove the culture medium. Wash the sample twice with 500 µl PBS at 5 min intervals.
- Remove PBS and gently break up the gelatinous protein mixture using a sterile P1000 micro pipette tip.
- Add 1 ml complete culture media to a single well and resuspend the organoids in 1 ml media.
- Gently disrupt the organoids using a P1000 by pipetting up and down 20-30x (check under the microscope for proper organoid dissociation with a good crypt yield until a consistent technique is developed).
- Transfer the crypts to a 1.5 ml microcentrifuge tube; centrifuge at 100 x g at 4 °C, 5 min.
- Wash the pellet twice with 1 ml complete culture media.
- Split at a ratio of 1:3 or 1:6 as needed, resuspending crypts in 50 µl Matrigel per well. Proceed as described above (section 1.1.16-18).
- Passage crypt organoids 14-21 days post seeding (or as needed) as follows:
- Crypt Organoid Freezing:
- Remove the culture medium. Wash the sample in 500 µl PBS.
- Disperse the gelatinous protein mixture using a P1000 pipette tip.
- Add 1 ml media to a single well and resuspend the organoids in 1 ml media.
- Gently break up the organoids using a P1000 by pipetting up and down 20-30x.
- Transfer the organoids to a 1.5 ml tube. Centrifuge at 100 x g at 4 °C, 5 min.
- Wash the pellet twice with 1 ml complete culture media.
- Resuspend crypts in 500 µl freezing media.
- Transfer crypts to a cryotube, place the tube in a freezing container and store in a -80 °C freezer overnight.
- Transfer crypts to liquid N2 tank.
- Recover frozen crypt organoids by rapidly thawing in a 37 °C water bath. Wash with 500 µl complete culture media once, centrifuge at 100 x g, 5 min and resuspend in gelatinous protein mixture, and culture as described above. For better recovery, add ROCK inhibitor (Y-27632) to the freezing media.
2. Crypt Organoid Metabolism Assay
- 24-well Plate Preparation:
- Isolate and count crypts according to the protocol (see section 1.1 for crypt isolation and section 1.2 for crypt passage).
- Resuspend crypts in gelatinous protein mixture (100-200 crypts per 20 µl).
- Plate crypt-gelatinous protein mixture suspension in a 24-well assay plate (make sure there are at least triplicates for each sample) and allow the suspension to solidify at 37 °C in a CO2 incubator; then add 500 µl complete culture media.
- Culture crypts (as described in section 1.1) and observe under microscope until crypts grow into fully developed organoids.
- Extracellular Flux Assay:
- Hydrate cartridge overnight in a non-CO2 (0% CO2), 37 °C incubator.
- Remove the culture medium and wash organoids twice with 500 µl DMEM (without: glucose, L-glutamine, sodium pyruvate and sodium bicarbonate; and with: phenol red). Wait 5 min.
- Add 675 µl per well assay medium (DMEM with 2 mM L-glutamine and 5 mM D-glucose) to each well.
- Check crypt organoids microscopic morphology to ensure that organoids and the gelatinous protein mixture are intact after the washes. Incubate 1 hr in a non-CO2, 37 °C incubator.
- Prepare 10 µM injectable compounds (oligomycin, carbonyl cyanide-p-trifluoro-methoxy-phenyl-hydrazone (FCCP), rotenone) in assay medium.
- Set-up the cartridge by loading 75 µl of 10 µM injectable compounds into the ports of the cartridge sequentially: Port A – oligomycin; Port B – FCCP; and Port C – rotenone (The final concentrations during the assay will be 1 µM).
- Incubate cartridge 30 min – 1 hr at 37 °C in a non-CO2 incubator.
- Simultaneously, turn on the XF Analyzer and create the assay protocol template.
- Place cartridge and utility plate into XF Analyzer and run “calibrate” cartridge.
- Check crypt organoids microscopically to make sure they are attached to the gelatinous protein mixture.
- Load cell culture plate into instrument and run assay protocol.
Representative Results
Crypt organoids were established from 8 month old C57BL/6 mice fed purified rodent diet American Institute of Nutrition 76A (AIN76A). Intestinal crypt organoids can be grown in culture for extended periods from a single crypt (Figure 1A, single red arrow). Organoids grow out crypt-like structures in 18-20 days in culture (Figure 1B, red arrows). Crypts were passaged every 3 weeks and organoids efficiently recovered following each passage.
Seahorse bioenergetics instrumentation can assess rates of mitochondrial respiration and glycolysis simultaneously in cells growing in culture in real time. We adapted this technology to assay crypt organoid metabolism. With organoids derived from mice fed AIN76A purified diet for 8 months, we measured: 1. oxygen consumption rate, OCR shown in Figure 2A – red line representing oxygen consumption rate (pmol/min) in crypt organoids, blue is the control wells only with Matrigel (the gelatinous protein mixture); 2. extracellular acidification rate (ECAR) shown in Figure 2B – red line representing extracellular acidification rate (mpH/min) in crypt organoids, blue is the control wells only with the gelatinous protein mixture.
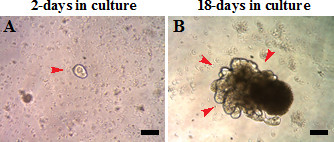
Figure 1: Crypt organoids derived from 8-month old C57BL/6 mice. Crypts are (A) 2-days or (B) 18-days in culture. Scale: 100 µm.
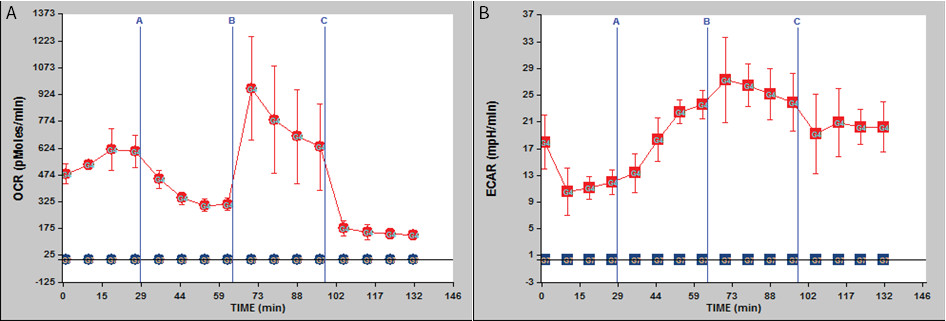
Figure 2: Bioenergetics assay using organoids derived from 8-month old C57BL/6 mice. (A) Oxygen consumption rate (OCR) is shown; (B) extracellular acidification rate (ECAR) is shown. Legend: red – crypts, blue – control, only Matrigel. n = 3. Reagents injected sequentially – indicated by the blue vertical bars – are as follows: A, oligomycin; B, carbonyl cyanide-p-trifluoromethoxyphenylhydrazone (FCCP); C, rotenone.
Discussion
We tested the oxygen consumption rate (OCR) and the extracellular acidification rate (ECAR) of crypts isolated from 8-month old mice and grown into organoids ex vivo. After measurement of the basal rate, crypt metabolism was evaluated by adding oligomycin, carbonyl cyanide-p-trifluoromethoxyphenylhydrazone (FCCP) and rotenone, sequentially.
Basal OCR and basal ECAR were recorded from 0 – 29 min (Figure 2A and 2B). At the 29th min, oligomycin (from port A) was injected into each well (n = 3, for both crypts and control wells). Oligomycin is an ATP synthesis inhibitor. It is used to prevent state 3 (phosphorylating) respiration. Thus, oligomycin injection resulted in a slight reduction in OCR, due to blockade of ATP synthesis in mitochondria, and the crypts switched to glycolysis to meet their requirement for ATP resulting in an increase in ECAR. At the 64th min, FCCP (from port B) was injected into each well. FCCP is a mobile ion carrier, transporting hydrogen ions across the mitochondrial membrane, leading to rapid energy consumption without the need for ATP generation. OCR increased due to uncoupling and ECAR increased since the crypts maintained their energy balance by employing glycolysis to generate ATP, thus synthesizing and secreting lactic acid. At the 99th min, rotenone (from port C) was injected into each well. Rotenone is a mitochondrial inhibitor. Thus, the third injection led to a decrease in OCR due to impaired mitochondrial function and shifted the crypts to a more glycolytic state keeping the ECAR values elevated.
There are two main conclusions: 1) crypt organoids from 8 month old mice were cultured successfully through multiple passages; 2) organoids that had been passaged in culture for 2 months after derivation exhibited a metabolic response to oligomycin, carbonyl cyanide-p-trifluoromethoxyphenylhydrazone and rotenone. Thus, the glycolytic capability of organoids was stable after 2 months in culture, consistent with the report that organoids from calorically restricted mice are relatively permanently adapted to different growth and metabolic phenotypes in culture12.
The experimental procedures described in this protocol will be of great importance in metabolic studies of intestinal crypts. The protocol for crypt isolation is adapted from Sato et al.10 The protocol for studying crypt metabolism in small intestinal crypt organoid cultures using bioenergetics analysis technology has not been reported. The crypt organoid metabolism studies can be extended further introducing different variables to the culture media and assay conditions, such as different energy sources, inhibitors and activators of specific signaling and metabolic pathways, and hypoxic conditions that may modulate metabolic pathways.
There are technical issues that require special attention when applying these protocols. Crypt number and the growth efficiency of crypt organoid cultures may vary depending on the crypt source, e.g. crypts from genetically altered vs. wild type mice. Thus, crypt seeding density can be adjusted for experiments by running a trial. In addition, crypts and organids have a strong tendency to stick to surfaces. For better yields, all tubes (1.5 ml, 15 ml, and 50 ml tubes), pipettes and pipette tips can be coated with 1% fetal bovine serum in phosphate buffered saline at 4 °C overnight. Results can be normalized to total protein concentration using the bicinchoninic acid (BCA) assay. After the metabolic assay, the 24-well plate is kept on ice until the BCA assay. For the BCA assay, crypts are gently washed in 500 µl cold PBS three times and lysed in 75 µl 0.1 N NaOH in PBS followed by vigorous shaking for 1 hr at room temperature. A P1000 pipette can be used to break the gelatinous protein mixture and pipetting up-down promotes lysis. After crypt lysis, the standard BCA assay protocol for cells can be followed. It is important to have “only Matrigel” control wells throughout the bioenergetics analysis to measure the background protein concentration in these wells and thus to assess the crypt protein concentration accurately by the BCA assay.
Crypt organoid metabolism studies presented can be applied to normal and patient derived epithelial mini-guts to explore the utility for early evaluation of relative disease risk and approaches that can modulate metabolic phenotype and thus decrease risk. The metabolic assays described here introduce new strategies for possible evaluation of relative risk for disease development and for early detection of disease state, its biochemical and molecular dissection and potential modulation. In summary, we describe a detailed protocol to isolate small intestinal crypts and culture crypt organoids. In addition, we introduce a novel method to use crypt organoid culture for determining extracellular acidification and oxygen consumption rates to study crypt organoid energy metabolism. Ex vivo crypt organoid culture metabolic profiling studies will define new strategies for understanding intestinal biology.
Divulgazioni
The authors have nothing to disclose.
Acknowledgements
This study was supported by grants RO1 CA 135561, R01 CA151494, R01 CA174432 and P3013330 from the National Institutes of Health.
We would like to thank Michele Houston, Elena Dhima and Dr. Anna Velcich for their valuable comments in developing the crypt isolation protocol.
We also thank the Diabetes Training and Research Center of the Albert Einstein College of Medicine supported by NIH P60DK20541, and Dr. Michael Brownlee and Dr. Xue-Liang Du, who direct and operate the Seahorse facility, respectively.
Materials
| BD Matrigel Basement Membrane Matrix, GFR, Phenol Red-free, LDEV-free | BD Biosciences | 356231 | |
| PBS (phosphate buffered saline), no magnesium, no calcium, pH 7.2 | Life Technologies | 20012-027 | |
| Advanced DMEM/F-12 (1X) | Life Technologies | 12634-028 | |
| Dulbecco′s Modified Eagle′s Medium without glucose, L-glutamine, Phenol Red, sodium pyruvate and sodium bicarbonate | Sigma-Aldrich | D5030 | |
| Phenol Red sodium salt | Sigma-Aldrich | P4758 | Final Concentration 15 mg / L in DMEM (D5030) – step 2.2.2 |
| Antibiotic-Antimycotic, 100X, 100ml | Life Technologies | 15240-062 | Final Concentration 1 X or 2 X |
| Penicilin-Streptomycin, liquid | Life Technologies | 15140-122 | Final Concentration 1 X |
| Gibco® GlutaMAX™ supplement | Life Technologies | 35050061 | Final Concentration 1 X |
| Gibco® HEPES (N-2-hydroxyethylpiperazine-N-2-ethane sulfonic acid), 1 M | Life Technologies | 15630-080 | Final Concentration 10 mM |
| N-Acetyl-L-Cysteine, 25g | Sigma-Aldrich | A9165-25G | Final Concentration 1 mM |
| 100X N-2 supplement, liquid | Invitrogen | 17502-048 | Final Concentration 1 X |
| 50X B-27® supplement minus Vitamin A, liquid | Invitrogen | 12587-010 | Final Concentration 1 X |
| Recombinant Mouse R-Spondin 1, CF, 50ug | R&D Systems | 3474-RS-050 | Final Concentration 500 ng / mL |
| Recombinant Murine EGF, 100ug | Peprotech | 315-09 | Final Concentration 50 ng / mL |
| Recombinant Murine Noggin, 20ug | Peprotech | 250-38 | Final Concentration 100 ng / mL |
| Gibco® L-glutamine, 200 mM | Life Technologies | 25030-081 | Final Concentration 2 mM |
| Gibco® Glucose powder | Life Technologies | 15023-021 | Final Concentration 5 mM |
| Ambion® 0.5 M EDTA (Ethylenediaminetetraacetic acid), pH 8.0 | Life Technologies | AM9260G | Final Concentration 3 mM for step 1.1.5; 2 mM for step 1.1.8 |
| DTT (Dithiothreitol), 1M | Life Technologies | P2325 | Final Concentration 3 mM |
| Albumin from bovine serum (BSA) | Sigma-Aldrich | A2058 | 0.1 % in PBS |
| Fetal Bovine Serum (FBS) | Life Technologies | 16000-044 | 1 % in PBS |
| Recovery™ Cell Culture Freezing Medium | Life Technologies | 12648-010 | |
| ROCK inhibitor (Y-27632) | Sigma-Aldrich | Y0503 | Final Concentration 10 µM |
| Oligomycin | Sigma-Aldrich | O4876 | Final Concentration 1 µM |
| Carbonyl cyanide-p-trifluoro-methoxy-phenyl-hydrazone (FCCP) | Sigma-Aldrich | C2920 | Final Concentration 1 µM |
| Rotenone | Sigma-Aldrich | R8875 | Final Concentration 1 µM |
| Sodium hydroxide | Sigma-Aldrich | 221465 | Final Concentration 0.1 N in PBS |
| XF24 Extracellular Flux Analyzer (XF Analyzer) | Seahorse Bioscience |
Riferimenti
- Jemal, A., et al. . CA Cancer J Clin. 58, 71-96 (2008).
- Slattery, M. L., Boucher, K. M., Caan, B. J., Potter, J. D., Ma, K. N. Eating patterns and risk of colon cancer. Am J Epidemiol. 148, 4-16 (1998).
- Warburg, O. On the origin of cancer cells. Science. 123, 309-314 (1956).
- Coles, N. W., Johnstone, R. M. Glutamine metabolism in Ehrlich ascites-carcinoma cells. Biochem J. 83, 284-291 (1962).
- Medina, M. A., Castro I, N. u. n. e. z. d. e. Glutaminolysis and glycolysis interactions in proliferant cells. Int J Biochem. 22, 681-683 (1990).
- Anso, E., et al. Metabolic changes in cancer cells upon suppression of MYC. Cancer Metab. 1, 7 (2013).
- Malmgren, S., et al. Coordinate changes in histone modifications, mRNA levels, and metabolite profiles in clonal INS-1 832/13 β-cells accompany functional adaptations to lipotoxicity. J Biol Chem. 288 (17), 11973-11987 (2013).
- Whitehead, R. H., et al. Establishment of conditionally immortalized epithelial cell lines from both colon and small intestine of adult H-2Kb-tsA58 transgenic mice. Proc Natl Acad Sci U S A. 90 (2), 587-591 (1993).
- Roig, A. I., et al. Immortalized epithelial cells derived from human colon biopsies express stem cell markers and differentiate in vitro. Gastroenterology. 138 (3), 1012-1021 (2010).
- Sato, T., et al. Single LGR5 stem cells build crypt-villus structures in vitro without a mesenchymal niche. Nature. 459, 262-265 (2009).
- Sato, T., Clevers, H. Growing self-organizing mini-guts from a single intestinal stem cell: mechanism and applications. Science. 340, 1190-1194 (2013).
- Yilmaz, O. H., et al. mTORC1 in the Paneth cell niche couples intestinal stem-cell function to calorie intake. Nature. 486, 490-495 (2012).
