NOTE: The local ethics committee of this institute approved this study, and all subjects provided written informed consent prior to participation. To be eligible for the study, subjects must fulfill the following requirements: no known diabetes mellitus; no use of beta blockers or anxiety medications, currently or in the past; does not smoke or chew tobacco products, currently or in the past; no more than 4 cups of caffeine each day; no more than 2 glasses of alcohol each day; and if female, not pregnant or breastfeeding.
NOTE: In this study, each participant undergoes four exams: two MRI and two PET-CT. Each exam is acquired on a different day, with each imaging modality performed under both thermoneutral 24.5 ± 0.7 °C (76.2 ± 1.3 °F), and cold 17.4 ± 0.5 °C (63.4 ± 0.9 °F) conditions. The scans are not scheduled in any particular sequence, helping to minimize any potential bias to the data due to heating or cooling the subject in a specific order. The total effective radiation dose for one PET-CT scan is 6.4 mSv (millisievert), and the radiologist on staff recommends a washout period of at least 24 hr between each scan.
1. General MRI Safety and Imaging Concerns
- Because the main magnetic field in MRI machines is always on, take care to ensure the safety of the patient and all personnel working in the MR area. Clear all magnetic objects from the subject and any persons working in the area.
- Ask subjects during the recruitment phase if they have any metal in their bodies43. In addition, have the subject complete a magnetic safety screening process44 to ensure that any metal in the body is approved for MRI. This initial check can help eliminate the possibility of consenting a subject who cannot complete the MRI scan.
- Additionally, if there is any metal in the subject’s body, which is compatible with MR, ensure that the metal is not near the tissue of interest. This is because metal can cause image distortion artifacts, which will make the analysis difficult if not impossible.
2. Obtaining Informed Consent
- Meet with the subject to obtain written informed consent. During this meeting, cover all details of the study, for example: the number of visits, the time commitment per visit, what the requirements are of the subject regarding limitations to exercise and/or food, what the subject can and cannot do during the visit (such as sleep), and any other specifics. Use this meeting to schedule the visits for the scanning, as it is usually easier to schedule these in person rather than using multiple emails.
3. Procedures Prior to Visit
- Instructions for the Subject
- For 24 hr prior to arriving for the study, have the subject refrain from alcohol, caffeine, medication or any strenuous exercise or activity.
- Instruct the subject to fast and to avoid any caloric intake for 8 hr prior to arriving for the study. Subjects are allowed to drink water.
- Contacting Volunteer
- Remind the volunteer of the specific instructions the day before the start of their 24 hr preparation. This serves both as a reminder of the scan, as well as it helps to ensure that the subject remembers their restrictions, (i.e., no eating, no exercise, no alcohol, etc.).
4. Procedure on Study Day – for MRI
- Temperature-Controlled Room Preparation
- Use a small room as the temperature-controlled room where the subject is exposed to the desired temperature.
NOTE: By using a small room, it is possible to minimize temperature gradients in the room. For example, the room size used here is 7’ x 6’ 8” x 8’ tall, (373.33 cubic feet). - Prepare the room at least 60 min prior to the subject entering the room to allow sufficient time for the room to reach a stable temperature.
- Maintain the RT either with a portable air-conditioning unit and a rotating floor fan to keep the cool air circulating, or using a programmable portable heater, which oscillates to circulate the warm air around the room.
- Deactivate or minimize any existing thermostat controlling air-conditioning or heating of the room to avoid conflicting with the desired RT target of the portable devices.
- Use a small room as the temperature-controlled room where the subject is exposed to the desired temperature.
- Prior to Entering Temperature-Controlled Room
- Have the subject change into standard medical shorts and shirt. Remove socks and shoes. If the subject is female, allow the wearing of a sports bra that does not contain any metal.
- Measure the subject’s height, weight, and waist circumference measurements after changing into the standard clothing.
- Measure the subject's body temperature using a sublingual thermometer.
- In the Temperature-Controlled Room
- Direct the subject to enter the temperature-controlled room. Ask the subject to sit quietly and not perform any activity that could change body temperature, e.g., exercising, typing, or falling asleep.
- After sitting in the room for 1 hr, measure the body temperature again using a sublingual thermometer.
- After the second hr of sitting in the temperature-controlled room, measure the body temperature again using a sublingual thermometer.
- On the MRI day when the subject is sitting in the cold room, use a cold vest to maintain a cold environment while the subject is transported to the MRI scanner. Place the cold vest on the subject prior to the subject leaving the temperature-controlled room.
- After 2 hr in the temperature-controlled room, transport the subject in a wheelchair to the MRI scanner. Use the wheelchair to keep the subject in a relaxed, sedentary state, and to minimize any “warming” that might occur from walking. Additionally, using the wheelchair helps to avoid any uptake of the PET tracer into skeletal muscles, though it would likely be minimal.
- MRI Acquisition Protocol
- Acquire MRI scans using a 3T MRI scanner equipped with two-channel parallel transmit capability, an extra-large 16-channel torso receive coil, and a modified tabletop.
- Hang the anterior portion of the torso receive coil from the top of the scanner bore in a fabric sling. Allow the sling to hang low enough to slide against the subject’s body in order to maximize signal-to-noise ratio (SNR).
- Place the posterior portion of the torso receive coil in a rolling “coil wagon” sandwiched between two layers of the tabletop. As the table moves through the scanner bore, hold the coil wagon at isocenter by straps attached to the scanner covers at the front and back of the scanner bore so that the posterior coil element remains stationary.
- Position the subject on the bed to enter the scanner feet first in a supine position.
- If the subject is wearing the cold vest, remove the vest prior to the subject lying down.
- Once lying down, have the subject place both arms inside a bag similar to a pillowcase, and lower the arms to either side of the body. This helps ensure the shoulders are positioned in a similar manner during both the MRI and PET/CT exams, which makes image co-registration easier.
NOTE: Allowing the subject to lie down on the scanner bed naturally, using the same amount of cushioning under the head during each scan, and using the pillowcase bag to support the arms, all helps to minimize differences between subject positioning between scans. Any support used for the subject during one scan, for example a pillow under the knees or lower back, should always be used in the same way for that subject, during both the MRI and PET/CT scans. - Acquire fat-water MRI (FWMRI) using a multi-stack, multi-slice, multiple fast field echo (mFFE) acquisition with 7 stacks of 20 axial slices, covering from the crown of the head to upper thigh. Slices are contiguous with a 0 mm gap between slices.
- Collect FWMRI scans using customized software to enable the acquisition of 8 echoes acquired as two interleaved sets of four echoes with a TR = 83 ms, TE1=1.024 ms and effective ΔTE = 0.779 ms. Other acquisition protocol details include: flip angle = 20º, water fat shift = 0.323 pixels, readout sampling bandwidth = 1346.1 Hz/pixel, axial in-plane field of view = 520 mm × 408 mm, acquired voxel size = 2 mm x 2 mm x 7.5 mm, and sensitivity encoding (SENSE) parallel imaging factor = 3 (anterior posterior direction). Preparation phases for each station include center frequency (F0) optimization and first order linear shimming. Acquisition time is 27.8 sec for 20 slices.
- Perform breath holds for stations covering the pelvis to the shoulders with two breath holds per station, i.e., no breath hold is longer than 14 sec. At each table position, acquire a dual angle B1 calibration scan (acquisition time 15.1 sec) to enable optimized RF shimming (relative RF amplitude and phase adjustments) for the two-channel transmit capability of the scanner.
- Acquire a SENSE reference scan at each table position with an acquisition time of 12.1 sec. Recommended FWMRI parameters are listed in Table 1.
5. Procedure on Study Day – for PET-CT
- Temperature-Controlled Room Preparation
- Use a small room as the temperature-controlled room where the subject is exposed to the desired temperature.
NOTE: By using a small room, it is possible to minimize temperature gradients in the room. For example, the room size used here is 7’ x 6’ 8” x 8’ tall, (373.33 cubic feet). - Prepare the room at least 60 min prior to the subject entering the room to allow sufficient time for the room to reach a stable temperature.
- Maintain the RT either with a portable air-conditioning unit and a rotating floor fan to keep the cool air circulating to achieve the cold stimulus temperature, or using an oscaillating portable heater to maintain the thermoneutral temperature.
- Deactivate or minimize any existing thermostat controlling air-conditioning or heating of the room to avoid conflicting with the desired RT target of the portable devices.
- Use a small room as the temperature-controlled room where the subject is exposed to the desired temperature.
- Subject Preparation
- Direct the subject to the PET imaging suite to have an IV port placed in a hand or arm vein. This IV port allows the Radiology technician to inject the radiotracer later, when the subject is sitting in the temperature-controlled room.
- If the subject is female, perform a blood serum pregnancy test to ensure she is not pregnant.
NOTE: For this study, the internal review board requires a pregnancy test less than 24 hr prior to the PET/CT scan being acquired.
- Prior to Entering Temperature-Controlled Room
- Have the subject change into standard medical shorts and shirt. Remove socks and shoes. If the subject is female, allow the wearing of a sports bra that does not contain any metal.
- Measure the subject’s height, weight, and waist circumference measurements after changing into the standard clothing.
- Measure the subject's body temperature using a sublingual thermometer.
- In the Temperature-Controlled Room
- Direct the subject to enter the temperature-controlled room. Ask the subject to sit quietly and not perform any activity that could change body temperature, e.g., exercising, typing, or falling asleep.
- After sitting in the room for 1 hr, measure the body temperature again using a sublingual thermometer.
- On the PET-CT scan days after the first hour in the temperature-controlled room, have a radiology technician administer the injection of Fluorodeoxyglucose (18F-FDG) through the IV port. Inject 0.14 mCi/kg (approximately 10 mCi for a 70 kg subject) of 18F-FDG. Calculate exact dosage based on subject specific weight.
- After the second hr of sitting in the temperature-controlled room, measure the body temperature again using a sublingual thermometer.
NOTE: Unlike the cold MRI days, use of the cold vest is unnecessary on cold PET-CT days because the 18F-FDG tracer is taken up into the activated BAT during the hour post tracer injection. The tracer will not leave the tissue even if the subject becomes warm as he/she is being transported to the scanner. Therefore, because it is possible to detect the presence of activated BAT on the PET-CT images even if the BAT does not remain active during the PET-CT scan, the cold vest is not necessary. - After 2 hr in the temperature-controlled room, transport the subject in a wheelchair to the PET-CT scanner. Use the wheelchair to keep the subject in a relaxed, sedentary state, and to minimize any “warming” that might occur from walking. Additionally, using the wheelchair helps to avoid any uptake of the PET tracer into skeletal muscles, though it would likely be minimal.
- PET-CT Acquisition Protocol
- Acquire PET-CT scans on a Discovery STE PET/CT scanner (STE stands for See and Treat Elite).
- Position the subject on the bed to enter the scanner head first in a supine position.
- Once lying down, have the subject place both arms inside a bag similar to a pillowcase, and lower the arms to either side of the body. This helps ensure the shoulders are positioned in a similar manner during both MRI and PET/CT exams, which makes image co-registration easier.
NOTE: The PET/CT imaging field of view covers from the crown of the head to mid-thigh in 7-9 bed positions, depending on subject height (2 min per bed position). Recommended PET-CT parameters are listed in Table 2.
6. MRI Post Processing
- Save real and imaginary MR images for off-line processing.The signal measured by MRI is a vector quantity with both magnitude and direction that can be represented as a complex number with real and imaginary parts. In the clinical setting, the magnitude images are typically displayed. However, complex information is needed for processing into the fat and water images.
- Perform three-dimensional water/fat separation and R2* estimation based on a multi-scale whole-image optimization algorithm45 implemented in C++ for each individual slice stack. Fat is modeled using 9 peaks46.
- Discard the first echo of each 4-echo train to avoid potential contamination of eddy current in the complex water-fat signal model.
7. PET-CT Post Processing
- Load CT DICOM data into MATLAB and convert to Hounsfield units (HU) by applying the scanner-supplied rescale value to the data values.
- Load PET DICOM data into MATLAB and convert to Standardized Uptake Values (SUV) using the following formula:
where “pixel value” is the stored value in the DICOM file for that pixel location.

NOTE: The PET tracer activity is the radionuclide total dose, and can be read from the image meta-data (DICOM header file).

- Interpolate the PET data to have the same dimensions as the CT data.
- Because PET and CT images are acquired with the same slice thickness, perform interpolation using a 2-dimensional spline function in the X-Y plane.
8. Data Post Processing
- To analyze the images, co-register all 4 image-volumes for each subject using a rigid body registration algorithm47 via a semi-automated method with in-house developed 3-plane view software to verify registration in all three dimensions.
- Due to difficulties with registering the entire image volume across all four time-points, focus registration on the region covering the neck to the apex of the lungs. Use only the successfully registered region in further data processing.
- Following image registration, load FWMRI, CT HU and PET SUV data into MATLAB and use to define BAT regions of interest.
NOTE: Similar to previously published methods19,25,48 of distinguishing BAT using PET SUV and CT HU values, to be considered part of the BAT mask, each voxel in the image must satisfy the following: (1) HU value falls in the range of: -200 < HU < -1, on both cold and warm CT scans; (2) SUV > 2.0 on the cold PET scan; (3) SUV signal fraction [(Cold SUV)/(Cold SUV + Warm SUV)] > 0.55, i.e., the cold PET scan must generate more than 55% of the total observed SUV signal in that voxel; and (4) only contain foreground pixels from the MRI scan, where Otsu’s method49 is used to classify foreground pixels. - If a voxel fulfills all these criteria, include the voxel in the binary mask of BAT identity.
- Apply the following binary morphology steps.
- Create a matrix the same size as the images being processed. Each spatial location in the new matrix is the 3D sum of all its adjacent neighbors in the binary BAT mask, including diagonals. The maximum sum is 26.
- Threshold this new matrix to include only locations with 15 or more 3D neighbors. This matrix then forms the final binary BAT mask.
NOTE: These rules are sufficient to segment BAT tissue, and no further modification to the mask is necessary to eliminate non-BAT voxels. This forms a slice-by-slice mask of PET-CT confirmed BAT in the co-registered shoulder region.
- Apply the mask to all the co-registered images to acquire the SUV, HU, fat signal fraction (FSF) and R2* values in the BAT regions, for both the cold and warm scans.
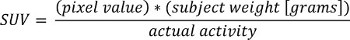
Acquiring both MRI and PET-CT scans on the same subject, and performing co-registration on all scans enables reliable measurement of quantitative MRI metrics of BAT. Figure 1 shows the unprocessed warm (TN) and cold (CA) PET-CT and MRI scans from one subject. By acquiring both TN and CA PET-CT data, it is possible to clearly distinguish the cold-activated BAT depots by the increased 18F-FDG uptake. After co-registering all four scans (Figure 2 and 3), it is possible to create a subject-specific BAT mask using criteria derived from the PET-CT images, as seen in Figure 4. This mask can then be applied to the four co-registered scans to acquire image metrics in the BAT depots. Representative values from one subject are displayed in Table 1.
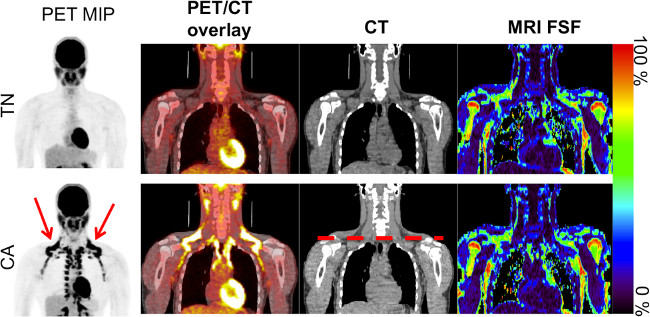
Figure 1. Coronal images from the warm (TN) and cold (CA) scans for one subject showing the PET maximum intensity projection (MIP) in inverse gray scale, PET/CT overlay, CT, and MRI fat signal fraction (FSF). Note the increased 18F-FDG uptake in the clavicular region (red arrow), as well as down the spinal column on the CA PET MIP scan, indicating activated brown adipose tissue. The dashed red line on the CA CT image indicates the clavicular region to be further analyzed. Please click here to view a larger version of this figure.
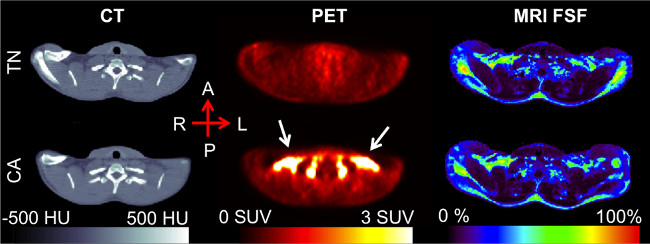
Figure 2. Clavicular-level axial slice, post-registration. The increased 18F-FDG uptake seen in the CA PET scan (white arrows), occurs in the supraclavicular region of adipose tissue as determined by the CT Hounsfield Unit values. The MRI fat signal fraction (FSF) in this region falls in the 50-80% range, similar to that of previous research. Please click here to view a larger version of this figure.
Figure 3. Flow charts showing the registration step. (A), in which the images are all registered to the same image space. Following the registration, all four images are used in the BAT mask creation (B).
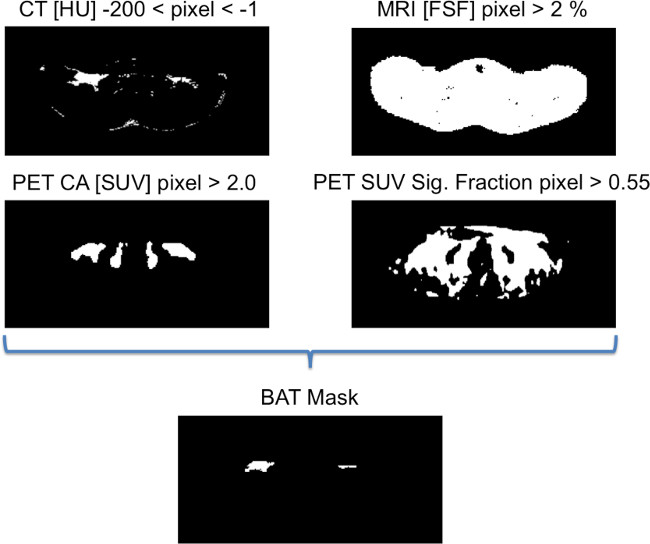
Figure 4. Binary images showing the criteria for generating the BAT mask. To be considered part of the BAT mask, each voxel in the image must satisfy these four rules, as determined on a slice-by-slice basis. If a voxel fulfills all these criteria, it is included in the binary mask of BAT identity. Please click here to view a larger version of this figure.
| Imaging Method | Value: |
| Mean ± 95% C.I. | |
| Thermoneutral CT [HU] | -68.62 ± 9.35 |
| Cold-Activated CT [HU] | -55.04 ± 7.72 |
| Thermoneutral PET [SUV] | 0.52 ± 0.05 |
| Cold-Activated PET [SUV] | 7.15 ± 1.16 |
| Thermoneutral FSF [%] | 41.62 ± 5.04 |
| Cold-Activated FSF [%] | 47.76 ± 5.15 |
| Thermoneutral R2* [1/sec] | 128.22 ± 19.48 |
| Cold-Activated R2* [1/sec] | 101.27 ± 24.92 |
Table 1. Numerical values (mean 95% Confidence Interval) from both the cold-activated and thermoneutral scans for one subject.
| Parameter | Recommendation | |||
| General | Sequence type | Multi-echo Fast Field Echo (mFFE) | ||
| RF transmission coil | Quadrature-body | |||
| Receive coil | SENSE-XL-Torso | |||
| Total scan duration (min:sec) | 00:25 (per table station) | |||
| Geometry | Multi-transmit | Yes | ||
| Anatomical plane | Transverse | |||
| Number of slices | 20 | |||
| Slice thickness (mm) | 7.5 | |||
| Inter-slice gap (mm) | 0 | |||
| Acquired Matrix | 260 x 204 | |||
| Reconstruction matrix | 288 | |||
| Field of view (mm) | 520 x 408 | |||
| Reconstructed voxel size (mm) | 1.81 x 1.82 x 7.5 | |||
| SENSE | Yes | |||
| P reduction (AP) | 3 | |||
| Slice scan order | Ascend | |||
| Fold-over direction | Anterior-Posterior | |||
| Fat shift direction | Left | |||
| Contrast | Scan mode | Multi-slice | ||
| Repetition time (ms) | 83 | |||
| Echoes | 4 | |||
| Interleaved mFFE | Yes | |||
| Interleaved count | 2 | |||
| Echo time (first) (ms) | 1.023 | |||
| Echo time spacing (ms) | 1.559 | |||
| Effective interleaved echo time (ms) | 0.7793 | |||
| Excitation flip angle (°) | 12 | |||
| RF shimming | Adaptive | |||
| Signal acquisition | Parallel imaging | SENSE factor = 3 | ||
| Partial Fourier | No | |||
| Bandwidth/pixel (Hz/pixel) | 1346.1 | |||
Table 2. Parameters used for fat-water MRI (FWMRI) acquisition.
| Parameter | Recommendation |
| Acquisition mode | Helical |
| Data collection diameter (mm) | 500 |
| Reconstruction diameter (mm) | 700 |
| Exposure time (seconds) | 873 |
| Convolution kernel | Standard |
| Revolution time (sec) | 0.8 |
| Single collimation width (mm) | 1.25 |
| Spiral pitch factor | 1.675 |
| Field of view – CT | 512 x 512 |
| Field of view – PET | 128 x 128 |
| Slice thickness (mm) | 3.75 |
| Reconstructed voxel size (mm) – CT | 1.37 x 1.37 x 3.75 |
| Reconstructed voxel size (mm) – PET | 5.47 x 5.47 x 3.75 |
| Total number of slices | 299 – 335 |
Table 3. Parameters used for PET-CT image acquisition.
