Supported lipid bilayers composed of DOPC:SM:Chol (2:2:1) were imaged in AFM (Figure 2 A-C). Because of the lipid composition, SM/Chol-rich Lo and DOPC-rich Ld phases were observed. The height profile from the AFM imaging can provide important information on the membrane structure. By looking at the height profile, the bilayer thickness can be measured in presence of defects in the membrane (Figure 2B), or the difference in height between the Lo/Ld phases can be provided. In addition, AFM allows to specifically select regions representing these phases and analyze their mechanical properties using force spectroscopy (Figure 2 D–F). The force curves derived from the force spectroscopy mode are used to measure the breakthrough force by finding the force value at the peak of the force curve (Figure 2D and E), and the membrane thickness by subtracting the distance value from the peak of the force curve to the distance value when the force curve begins to rise again (Figure 2D and F).
The sensitivity of AFM measurements is dependent on piezoelectric material and electronic feedback loops. As such, before doing experiments, is important to get familiar with the AFM set up. There are two common instrument set up for the piezoelectric materials: (1) tube scanner in which the sample is placed on top of the piezoelectric material and the sample is scanned on an immobile tip; or (2) flexure-stage where the tip is mounted on the piezoelectric material instead of the sample. In the latter case, the piezoelectric material and other electronics are protected from spills. A lot of AFM models for biological applications have this configuration.
During imaging, the AFM tip may lose contact with the sample and lead to erroneous measurements. Depending on how many scans are lost, the image can be corrected by removing the scan lines and using a mean intensity filter to derive the new values from surrounding area (Figure 3). However in most cases, this does not yield a good image and it is recommended to simply discard the image. There are other artifacts that need to be monitored. These arise from blunt/damaged/dirty tips as well as the diffraction of the laser spot behind the cantilever31. In these cases, images should be discarded and the AFM tip should be replaced.
During force spectroscopy measurements, several challenges may arise: (1) absence of peaks (Figure 4A), (2) presence of shoulders instead of well-defined peaks (Figure 4B), (3) a small rise and subsequent plateauing at very low forces (Figure 4C–D). The absence of a peak can be attributed to measuring in a region without a bilayer or to acquisition conditions not being optimized. It is recommended that an AFM image is acquired before doing force spectroscopy to make sure that the bilayer is indeed being measured. Acquisition conditions as well as tip/cantilever specifications affect the probability of a breakthrough event17. A sharper tip can easily puncture a bilayer, as such, the breakthrough force may appear low or not appear at all because it is below the noise levels. . Increasing the approach speed also increases the breakthrough force16. As the bilayer is pressed by the tip, the lipid molecules also react to dissipate this force. At a lower approach speed, the lipid bilayer has enough time to equilibrate before the next step in force, and this increases the probability that a breakthrough event can happen. At a higher approach speed, the force ramps faster than the reaction of the lipids and, as such, the probability of a breakthrough event is lower at the same force. It is possible that by using high approach speed, the set point is reached before the bilayer breaks resulting in no observable peaks. There are no reports to explain the appearance of shoulders on the curve but we postulate that it could be due to material compression before breakthrough. Furthermore, a plateau or wide peaks at very low forces may indicate the presence of dirt or loose lipid material in the tip. Tips may accumulate dirt and lipidic material in the span of several measurements. Dirt and material attached to the tip makes it blunt, thus increasing the breakthrough force.
It is recommended that force curves are acquired in different areas if these challenges arise. A second recommendation is to change tips (this will require recalibration). Lastly, the approach speed may need to be adjusted or the use of a tip with different specifications (tip radius and stiffness) may be considered. The breakthrough force varies between 0-50 nN6, as such, the spring constant of the cantilever can be in the range of 0.05-0.7 N/m. Most commercial cantilevers have a nominal tip radius around 20-40 nm. Instead of using conventional tips, tipless cantilevers could also be bought and spheres of known radius (which are usually monodisperse in size distribution) could be attached to them. To get reproducible data, always use the same acquisition conditions and cantilever specifications for the same set of experiments.
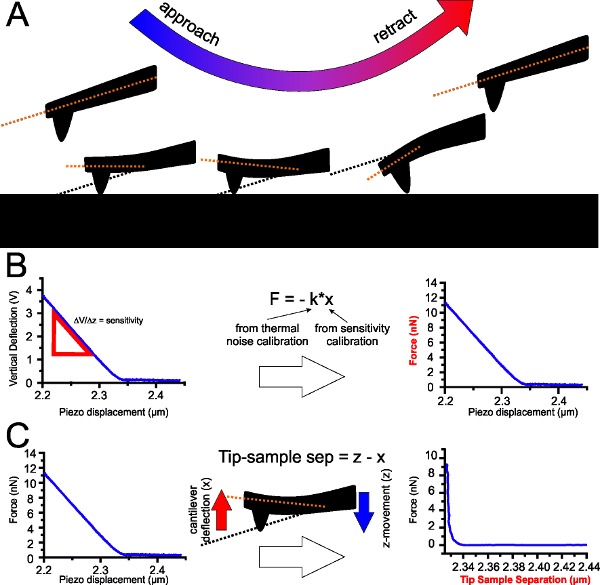
Figure 1: Principles of Force Spectroscopy. (A) Sequence of approach-retraction of the cantilever from the sample. The red line shows the cantilever deflection from its equilibrium position (black line). (B) Cantilever calibration converts electrical signal (in Volts) to force (in Newtons). By acquisition of the cantilever sensitivity and spring constant the vertical deflection (in volts) is converted into distance and the distance into force using Hooke’s law. (C) Upon contact in force spectroscopy measurements, z-piezo scan movement does not take into account the cantilever bending. A correction for this can be done by subtracting the vertical deflection, x (in distance units) from the z-piezo movement, z (also in distance units). In this way, the actual tip-sample separation, instead of simply z-piezo movement, can be reported, which is a more accurate measure of distances and is important in order to measure the thickness of the sample.
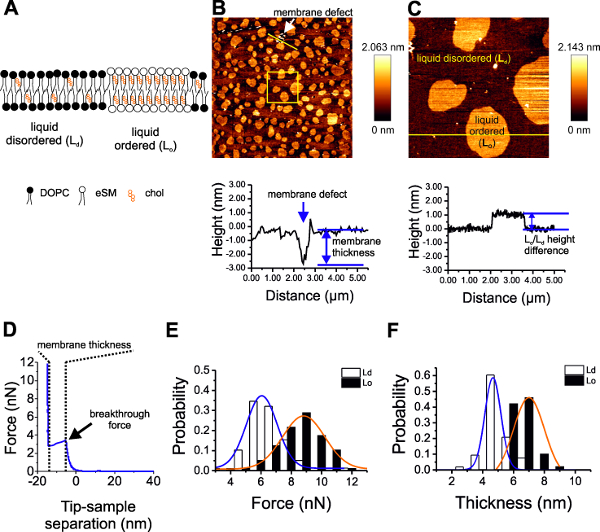
Figure 2: AFM of SLBs. (A) Scheme of SLBs composed of DOPC:SM:Chol (2:2:1) separate into liquid disordered (Ld) and liquid ordered (Lo) phases. (B) A 50 µm x 50 µm AFM image of the SLBs. The line profile below corresponds to the yellow line in the image. Membrane defects (blue arrow) show the thickness of the bilayer to be approx. 4 nm. (C) corresponds to the yellow square in B (10 µm x 10 µm). Lo and Ld phases are labeled. The line profile below corresponds to the yellow line in the image. The Lo phase appears 1-2 nm higher than the Ld phase. (D) A sample force curve showing how the breakthrough force and membrane thickness are derived. (E) Breakthrough force and (F) membrane thickness distribution for Ld and Lo phases with Gaussian fitting for quantification.
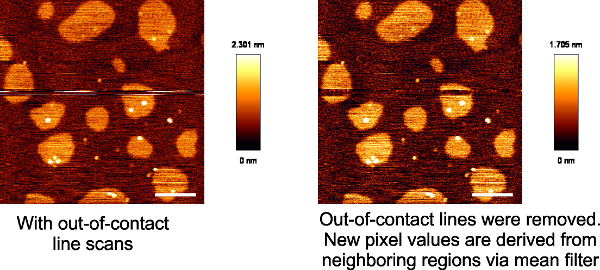
Figure 3: Loss of contact during imaging leads to scan lines that do not correspond to the rest of the image. A supported bilayer composed of DOPC:SM:Chol (2:2:1) with loss of contact in some line scans. Scale bar 2 µm.
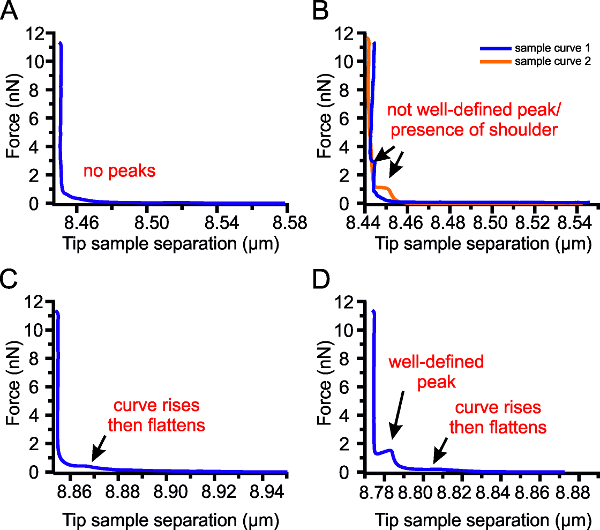
Figure 4: Challenges in Force Spectroscopy. (A) Some force curves will have no peaks. (B) The curve may have shoulders instead of well-defined peaks. (C) After a small increase a plateau may occur in the absence of the peak. (D) Appearance of a plateau together with a well-defined peak.
| Membrane region | Breakthrough Force (nN) | Membrane Thickness (nm) |
| Ld phase | 6 ± 1 | 4.7 ± 0.5 |
| Lo phase | 8 ± 1 | 6 ± 1 |
Table 1: Membrane properties of DOPC:SM:Chol (2:2:1) SLBs. The Ld phase has a breakthrough force of 6 ± 1 nN and a thickness of 4.7 ± 0.5 nm. The Lo has 8 ± 1 nN and a thickness of 6 ± 1 nm. The difference in height between the two phases is 2 ± 1.4 nm.
SLBs composed of DOPC:SM:Chol (2:2:1) were formed on mica after vesicle adsorption and rupture induced by calcium chloride. This lipid composition separated into Ld and Lo phases. The Lo phase is enriched in sphingomyelin and cholesterol and is less fluid/more viscous (Figure 1A) than the Ld phase11. The separation of Lo from Ld phase manifests as circular structures elevated above the surrounding (Figure 1B, C). The platforms are the Lo phases surrounded by the Ld phases. Membrane defects (or holes in the membrane) are also seen (Figure 1B, blue arrow) and a height profile across this defect shows the thickness of the bilayer. The Ld/Lo height difference can also be examined by looking at an AFM height profile (Figure 1C).
The preparation of lipid mixture is very important as the composition determines the bilayer properties. During the preparation of the supported bilayer, it is important to work at the indicated temperatures for the proper formation of lipid phases (step 1.4.5). During imaging, keeping a low force is very important so as not to destroy the bilayer nor to accumulate dirt on the tip.
After AFM imaging, regions of the SLB are selected and probed using force spectroscopy. Force spectroscopy allows us to probe other properties of the membrane, specifically the breakthrough force (Figure 1D). The Ld and Lo phases show different breakthrough force and thickness (Figure 1E, F). The properties are summarized in Table 1. We note that compared to Chiantia et al.11, similar values for breakthrough force in the Ld phase were obtained but a lower value for the Lo phase. This could be due to lower amounts of cholesterol used in our membranes (we used DOPC:SM:Chol ratio 2:2:1, while they used of 1.5:1.5:1). This also demonstrates the importance of mixing the right lipid ratio — a critical factor in reproducibility of results. Furthermore, using different lipids (chain length, and degree of unsaturation) also changes the bilayer properties6,15,18.
While plotting the distribution of breakthrough forces is useful and can already show differences in the bilayer properties, further analysis of the breakthrough force distribution can be used to deduce other mechanical properties including line tension and spreading pressure11,17,21. Briefly, the probability, P(F) of measuring a certain breakthrough force, F, is described by the continuum nucleation model11,15,17:
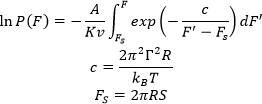
where A is the resonance frequency of the cantilever, K is the spring constant of the cantilever, v is the speed of the approach, Γ is the line tension (the edge energy required to keep a hole in the membrane open), R is the radius of the AFM tip, kB is the Boltzmann constant, T is temperature, and S is the spreading pressure or the energy associated to close the hole (opposite of membrane tension — the energy needed to be exerted by the membrane to open a hole32). This equation can be integrated and dP/dF can be calculated as:
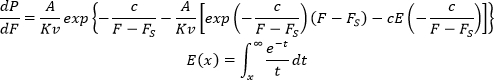
A, K, R are properties of the AFM cantilever/tip that can be acquired through cantilever calibration. T and v are experimental parameters that should be kept constant throughout the experiments. dP/dF is then fitted to the histogram to acquire the line tension and the spreading pressure. As several parameters affect P(F), experimentalists are advised to use similar tips and acquisition conditions to have comparable values for line tension and spreading pressure. Contamination of the AFM tip (including dirt and unfused vesicles on the tip acquired during imaging) leads to non-reproducible results. Furthermore, the choice of support affects the mechanical properties of the membrane20.
Another technique that can characterize mechanical properties of lipid bilayer is the micropipette aspiration of giant unilamellar vesicles (GUVs)33. In this technique, membrane tension is calculated from the deformation of GUVs during aspiration. Furthermore, by increasing the suction, one can calculate the tension at which the GUV ruptures (or lysis tension)34, which could be related to the line tension in the continuum nucleation model. One drawback of this techniques is the complexity of calculating membrane tension to phase separating membranes, as the different phases have different mechanical properties35. This is in contrast to AFM force spectroscopy, where individual phases can be characterized separately. Furthermore, whereas many GUVs are needed to produce statistically relevant results, the AFM can produce one distribution per SLB. However, membrane remodeling effects (for example, tubulation and invaginations) are more easily visualized with GUVs, making them better systems for characterizing these shape-related effects together with mechanical properties.
In further applications to study the effects of membrane proteins on bilayer properties, purified proteins may be incorporated in these vesicles to make proteoliposomes. One technique for doing this uses detergents to help the proteins to stabilize and insert into the membrane. Subsequent purification via dialysis or size-exclusion chromatography removes free proteins and detergent in solution36. Another approach requires the tagging of the purified proteins (for example, Histidine or Streptavidin tags) and incorporating affinity partners for this tag in the liposomes (with nickel-nitriloacetic acid (Ni-NTA) or biotinylated lipids).
In summary, we described a method to analyze lipid bilayers. Due to its high-resolution, AFM can reveal sub-micrometer structures in the membrane, which include lipid phases among others. Force spectroscopy, here used for characterizing lipid membranes, can also be used on membrane proteins and other biomolecules on the membrane.
