A two-dimensional gas chromatography-time-of-flight mass spectrometry method is described for characterization of the aqueous fraction of bio-crude produced from hydrothermal liquefaction of algae. This protocol can also be employed to analyze the aqueous fraction of liquid products from fast pyrolysis, catalytic fast pyrolysis, catalytic deoxygenation and hydro-treating.
Two-dimensional gas chromatography coupled with time-of-flight mass spectrometry is a powerful tool for identifying and quantifying chemical components in complex mixtures. It is often used to analyze gasoline, jet fuel, diesel, bio-diesel and the organic fraction of bio-crude/bio-oil. In most of those analyses, the first dimension of separation is non-polar, followed by a polar separation. The aqueous fractions of bio-crude and other aqueous samples from biofuels production have been examined with similar column combinations. However, sample preparation techniques such as derivatization, solvent extraction, and solid-phase extraction were necessary prior to analysis. In this study, aqueous fractions obtained from the hydrothermal liquefaction of algae were characterized by two-dimensional gas chromatography coupled with time-of-flight mass spectrometry without prior sample preparation techniques using a polar separation in the first dimension followed by a non-polar separation in the second. Two-dimensional plots from this analysis were compared with those obtained from the more traditional column configuration. Results from qualitative characterization of the aqueous fractions of algal bio-crude are discussed in detail. The advantages of using a polar separation followed by a non-polar separation for characterization of organics in aqueous samples by two-dimensional gas chromatography coupled with time-of-flight mass spectrometry are highlighted.
Steady growth in demand for liquid fuels, finite fossil fuel resources, uncertainty of fossil fuel supplies, and concerns over the increasing concentration of greenhouse gases in the atmosphere have increased global awareness for renewable resources1. Solar energy (including photovoltaics and solar-thermal), wind energy, hydropower, geothermal, and biomass are the primary renewable sources that could potentially replace fossil-derived energy2. Of these, biomass is the only carbon-based alternative energy resource for the production of liquid transportation fuels and high-value chemicals3. Biomass includes any organic material such as forest resources, agricultural residue, algae, oilseeds, municipal solid waste, and carbon-rich industrial wastes (e.g. from pulp and paper industry or from food processing)1. Biomass is classified into two broad categories: lignocellulosic and non-ligneous feedstocks based on compositional characteristics. Lignocellulosic biomass consists of carbohydrates and lignin, while non-ligneous feedstocks have proteins, carbohydrates and lipids/oils4. Lignocellulosic feedstocks, derived from terrestrial plants, can only satisfy 30% of the current liquid fuel (gasoline, jet fuel, and diesel) demand if sustainably cultivated and harvested5,6. Hence, non-ligneous aquatic microorganisms, such as microalgae and fungi, are considered potential feedstocks for the production of renewable liquid fuels to complement lignocellulosic resources.
Microalgae feedstocks have the potential to satisfy current liquid transportation fuels demand7,8. Algae have many advantages: high areal productivity8, the ability to grow in low-quality, brackish, or sea water9, and the ability to accumulate energy-dense triglycerides or hydrocarbons7,8. Hydrothermal liquefaction (HTL) is a viable and scalable conversion process which utilizes water naturally associated with algal or aquatic feedstocks10,11. It is a thermo-chemical process with operating temperatures of 250-400 °C and operating pressures of 10-25 MPa which produces a liquid product, or bio-crude, which can be upgraded into a fuel blend stock. Bio-crude produced from HTL of algae has distinguishable and easily separable organic and aqueous fractions. The organic fraction of bio-crude can be efficiently converted into a refinery ready blend stock via catalytic hydro-treating processes11. The aqueous fraction of bio-crude contains ~30% of the total carbon present in the algal feedstock. Although thousands of compounds have been identified in the HTL aqueous stream, the predominant fractions consist of low molecular weight oxygenates (including acids, alcohols, ketones, and aldehydes) formed by the degradation of carbohydrates and lipids, and nitrogen heterocyclics (including pyrroles, pyridines, pyrazines, and imidazoles) derived from protein decomposition12. Studies on utilizing the aqueous fraction to improve overall process economics as well as sustainability are ongoing. Synthesis gas can be produced from the aqueous fraction of algae bio-crude via catalytic hydrothermal gasification10,13,14. Alternatively, organics in the aqueous fraction can also be catalytically converted to fuel additives and specialty chemicals. Research on optimizing catalytic hydrothermal gasification and catalyst screening studies for conversion of organics in the aqueous liquid phase is currently underway at the Pacific Northwest National Laboratory (PNNL). For this work, qualitative as well as quantitative characterization of the aqueous fraction of algae bio-crude is required. Since the aqueous fraction of algae bio-crude is considered a waste stream, there are very few studies that have analyzed the aqueous fraction of algae bio-crude13,15. Moreover, recent studies concluded that converting this HTL algae water into high-value bio-products would improve the sustainability as well as economics of an HTL-based bio-refinery11. Therefore, this study focused on developing a method for qualitative characterization of the aqueous fraction of bio-crude obtained from HTL of algae by two-dimensional gas chromatography coupled with time-of-flight mass spectrometry (GC × GC–TOF-MS).
GC × GC–TOF-MS is the most promising chromatographic analytical technique to increase resolution (or separation of chemical compounds in a sample), peak capacity (i.e. number of resolved peaks), signal-to-noise ratio (for identification of chemical compounds with high confidence), and to avoid co-elution of chemical compounds16. In order to maximize resolution, peak capacity, and signal-to noise ratio, two GC columns with different stationary phases are connected in series using a press-fit connector or micro-union17(see Figure 1 which is a block diagram of GC × GC–TOF-MS system used in this study). A modulator is located between the press-fit connector and secondary columns to trap, refocus, and re-inject the effluents from the primary column into the secondary column18. Modulation occurs on the secondary column in the present study as shown in Figure 1. The secondary column is then connected to the TOF-MS via a transfer line assembly.
GC × GC–TOF-MS was used previously for qualitative as well as quantitative analysis of organic samples such as crude oil16,19, gasoline, jet-fuel, diesel, bio-diesel, and the organic fraction of bio-fuel20-22 produced from thermo-chemical as well as thermo-catalytic conversion processes23,24. For characterization of these organic samples in GC × GC–TOF-MS instruments, a long non-polar column was used as the primary column, while a short polar column was used as the secondary column. This conventional column configuration resolves chemical compounds based on differences in volatility over the first dimension, followed by polarity in the second dimension18. Aqueous or water samples from biological processes, food processing, and environmental wastes were also characterized using similar primary/secondary column configurations after the sample had been through preparation steps17,25-30. Sample preparation techniques such as derivatization, solid-phase extraction, and organic solvent extraction have all been utilized prior to GC × GC–TOF-MS analysis17,27-29,31,32. These techniques were aimed at decreasing the polarity of compounds in the sample for analysis using a conventional column configuration33. An alternative strategy was employed in this study based on the nature of the sample (here polar organic compounds in water) utilizing the reverse primary/secondary column configuration for GC × GC–TOF-MS analysis. Since the aqueous fraction of bio-crude produced from HTL has polar compounds13, a column combination of a primary polar column and a secondary non-polar column was used in the GC × GC–TOF-MS without any upstream sample preparation. This primary/secondary column combination resolves chemical compounds based on differences in polarity over the first dimension, followed by volatility in the second dimension. Limited analytical methods exist in the literature for characterization of aqueous samples using two-dimensional gas chromatography without prior sample processing15.
The objective of this study was to determine the chemical compounds present in the aqueous fraction of algae bio-crude. To achieve this objective, a GC × GC–TOF-MS data acquisition method was developed with a column combination of polar column (primary) × non-polar (secondary). Klenn et al. (2015) suggested that increasing the length of the primary column (especially 60 m GC columns) and lowering the offset temperature of the secondary column with respect to the primary column would maximize peak capacity and resolution16-18. Therefore, a 60 m primary column and 5 °C offset temperature of the secondary column with respect to the primary column were used in this study. The optimum modulation period was determined following a protocol described in this study (see section 4). The optimum ramp rate of GC column temperature was determined by a trial and error method and is similar to the value suggested in the literature16-18. To discuss the advantages of this column combination for aqueous samples, we have analyzed HTL algae water samples with the conventional column combination of non-polar × polar. Operating parameters suggested in the literature were employed for analyzing the aqueous fraction of algal bio-crude with a non-polar × polar column combination18.
1. Sample Preparation
2. Instrument Components
3. Protocols Before Analyzing Samples
4. Protocol to Determine the Optimum Modulation Period of Modulator
5. Experimental Parameters of Instrument Set-up
6. Data Analysis
A total ion chromatogram (TIC) obtained for the aqueous fraction of algae bio-crude analyzed with a column combination of polar × non-polar is shown in Figure 4. Retention times and similarity or match factor values of compounds identified by searching against a National Institute of Standards and Technology (NIST) library are tabulated in Table 1. Oxygenates (such as cyclopenatanone, furanic compounds and dianhydromannitol) and organic acids (including acetic acid, propanoic acid and butanoic acid) were observed in HTL algae water34. These chemicals could be formed from the degradation of the algae carbohydrate fraction during HTL13. In addition to oxygenates, the aqueous phase has nitrogen containing compounds (N-compounds) such as pyridine, pyrazine, acetamides, succinimide and their alkyl-derivatives. Presumably, these compounds are the degradation products of proteins in algal biomass4,35.
The high-intensity peaks identified in the contour plot for the aqueous fraction of algae bio-crude were validated by analyzing standards. Standards containing organic acids and N-compounds were prepared and analyzed in GC × GC–TOF-MS. Total ion chromatogram of the organic acids standard and N-compound standards are shown in Figure 5. Retention time and similarity values of the standards are tabulated in Table 2 and correspond to the identified chemical compounds in HTL algae water. Column bleed was observed for both standards and samples at high temperatures (>250 °C). This column bleed has been previously reported in the literature for polar GC columns18. Carbon dioxide (CO2) was observed in HTL algae water whereas it was not seen in the standards (see Figures 4 and 5). This indicates that the aqueous fraction of algae bio-crude has dissolved CO2, which may be produced during the HTL of algal feedstocks11.
The aqueous fraction of algae bio-crude was also analyzed with the conventional column combination of non-polar × polar which was widely used in the literature17. The total ion chromatogram of HTL algae water from a GC × GC–TOF-MS analysis with a non-polar primary separation followed by a polar secondary separation is shown in Figure 6. As shown in Figure 6, organic acids and N-compounds present in the aqueous fraction of algae bio-crude elute with more than one peak. Acetic acid and other organic acids elute throughout the duration of the analysis, especially in the first dimension. Retention times and similarity/confidence values of the compounds identified by searching against a NIST library are tabulated in Table 3. Peak capacity of the conventional column configuration (24, see Table 3) is lower than that of polar × non-polar (50, see Table 1) while using same data analysis method. It can be concluded that peak capacity, peak shapes, and resolution of the HTL algae water were poor for the analysis where the non-polar is the primary and the polar is the secondary separation. Therefore, this column configuration of non-polar × polar is not suitable for qualitative as well as quantitative characterization of aqueous algae bio-crude without prior sample preparation.
A long modulation period (see the secondary axis of Figure 6) was necessary to characterize the aqueous fraction of algae bio-crude for the non-polar × polar configuration. As previously shown in Figure 4, a short modulation time of 4 sec was sufficient for the characterization of HTL algae water using a column combination of polar × non-polar. Since a short modulation time is recommended for GC × GC analysis16-18 to retain the separation obtained in the first dimension, this is another advantage of using polar × non-polar for characterization of HTL algae water.
GC × GC–TOF-MS analysis of aqueous algae bio-crude with a polar × non-polar column configuration produces symmetrical peak shape, improves peak capacity and high resolution when compared to a conventional column configuration of non-polar ×polar. Hence, GC × GC–TOF-MS analysis described using polar × non-polar can be employed for quantification of chemical compounds present in aqueous fraction of algae bio-crude without any sample preparation techniques.
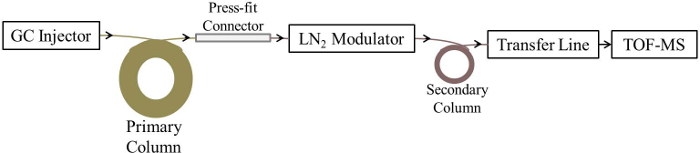
Figure 1: Block flow diagram of GC × GC-TOF-MS used in this study. Please click here to view a larger version of this figure.
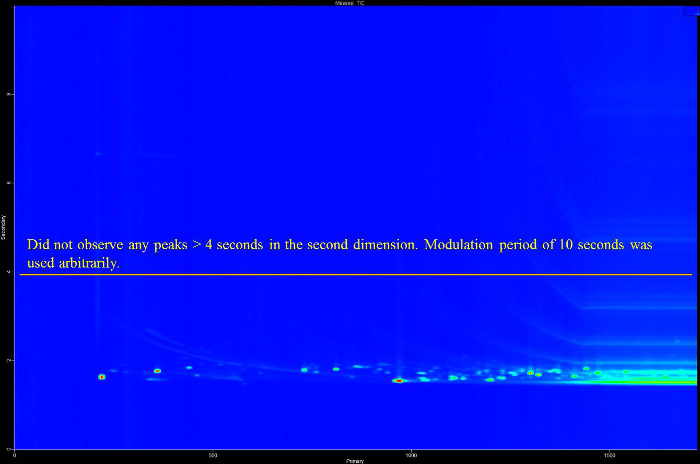
Figure 2: Contour plot of HTL algae aqueous fraction obtained using column combination of polar × non-polar for determining optimum modulation time. 10 seconds was randomly selected. No peaks were observed >4 sec in second dimension. Therefore, 4 sec was identified as optimum modulation time. Please click here to view a larger version of this figure.
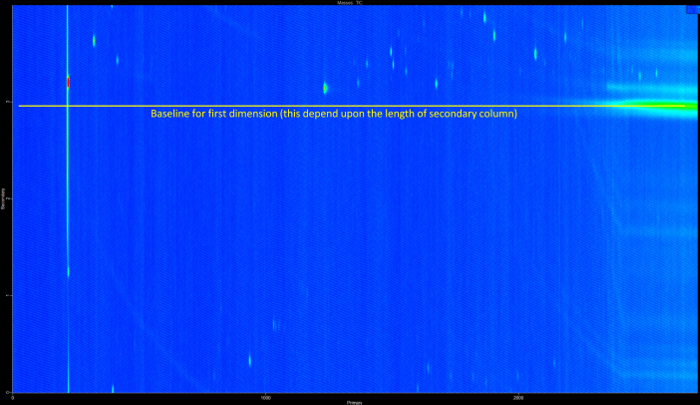
Figure 3: Contour plot of HTL algal aqueous fraction that shows 'wrap around' phenomena. Wrap around phenomena occurs if the peaks in the second dimension elutes below the baseline of first dimension. 3.5 m secondary column length was used to obtain this contour plot. This plot was collected to clearly explain wrap around phenomena. Please click here to view a larger version of this figure.
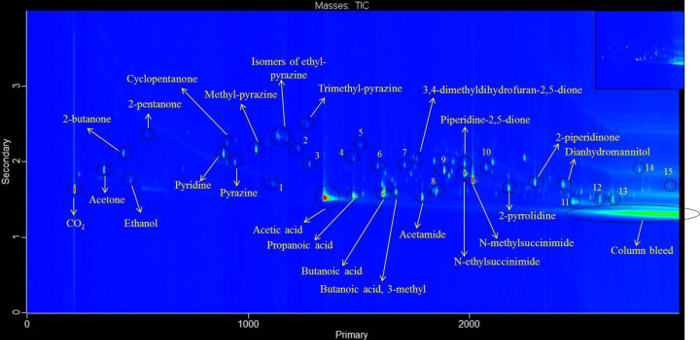
Figure 4: Contour plot of HTL algae aqueous fraction obtained using column combination of polar × non-polar. Chemical compounds were identified using NIST 2008 library. The units of primary and secondary axis are seconds. The similarity values of identified chemical compounds are tabulated in Table 1. 1 → 1-hydroxy-2-propanone; 2 → 2-cyclopenten-1-one, 2-methyl; 3 → N,N-dimethyl acetamide; 4 → 2-cyclopente-1-one, 3-methyl; 5 → 2-cyclopenten-1-one, 2,3-dimethyl; 6 → 3-pentenoic acid, 4-methyl; 7 → 2-pyrrolidinone, 1-methyl; 8 → propanamide; 9 →1H-Imidazole, 1-methyl-4-nitro-; 10 → N-propyl succinimide; 11 → glycerin; 12 → 3-pyridinol; 13 → 2,5-pyrrolidinedione; 14 → acetamide, N-(2-phenylethyl); 15 → N-(2-hydroxyethyl) succinimide. Please click here to view a larger version of this figure.
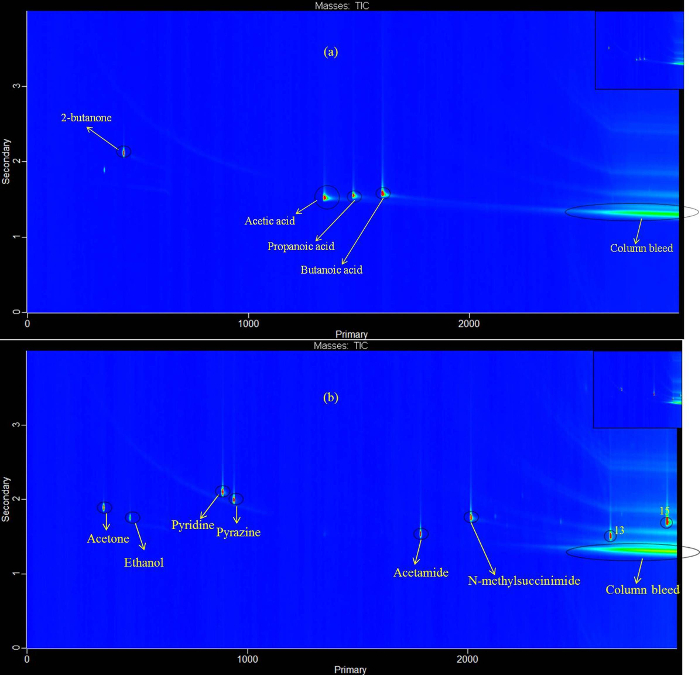
Figure 5: (a) Contour plot of standard containing acetic acid, propanoic acid, butanoic acid, and 2-butanone using column combination of polar × non-polar. (b) contour plot of standard containing acetone, ethanol, pyridine, pyrazine acetamide, N-methylsuccinimide, succinimide, and N-(2-hydroxyethyl)succinimide using column combination of polar × non-polar. The similarity values of standards are tabulated in Table 2. Please click here to view a larger version of this figure.
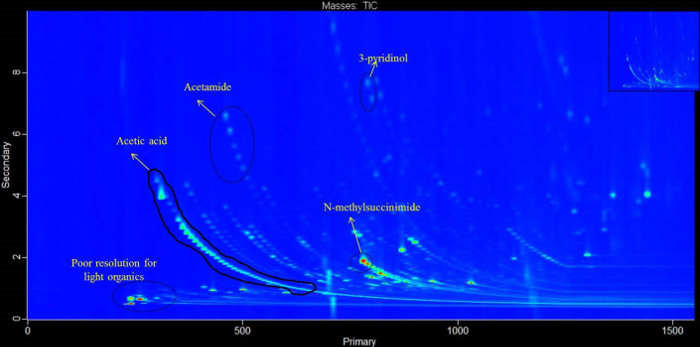
Figure 6: Contour plot of HTL algae aqueous fraction obtained using column combination of non-polar × polar. This figure shows poor resolution of light organics, organic acids and N-compounds. The similarity values of identified chemical compounds are tabulated in Table 3. Please click here to view a larger version of this figure.
Name | R.T. (sec) | Similarity |
Carbon dioxide | 215, 1.64 | 999 |
Acetone | 347, 1.89 | 967 |
2-Butanone | 435, 2.12 | 965 |
Ethanol | 467, 1.75 | 949 |
2-Pentanone | 539, 2.36 | 942 |
3-Pentanone | 539, 2.41 | 940 |
Pyridine | 887, 2.11 | 967 |
Cyclopentanone | 903, 2.25 | 962 |
Pyrazine | 939, 1.99 | 945 |
Pyridine, 2-methyl- | 943, 2.28 | 950 |
Pyrazine, methyl- | 1035, 2.16 | 964 |
Pyridine, 3-methyl- | 1087, 2.25 | 947 |
2-Propanone, 1-hydroxy- | 1107, 1.71 | 950 |
Pyrazine, 2,5-dimethyl- | 1131, 2.35 | 950 |
Pyrazine, 2,6-dimethyl- | 1139, 2.33 | 953 |
Pyrazine, ethyl- | 1151, 2.34 | 954 |
Pyrazine, 2,3-dimethyl- | 1171, 2.32 | 963 |
2-Cyclopenten-1-one, 2-methyl- | 1223, 2.19 | 960 |
Pyrazine, 2-ethyl-6-methyl- | 1235, 2.54 | 926 |
Pyrazine, trimethyl- | 1263, 2.49 | 944 |
Acetamide, N,N-dimethyl- | 1275, 1.97 | 957 |
Acetic acid | 1339, 1.53 | 963 |
Pyrrole | 1443, 1.65 | 970 |
Propanoic acid | 1475, 1.55 | 953 |
2-Cyclopenten-1-one, 3-methyl- | 1475, 2.04 | 956 |
2-Cyclopenten-1-one, 2,3-dimethyl- | 1503, 2.22 | 884 |
Propanoic acid, 2-methyl- | 1515, 1.58 | 929 |
3-Pentenoic acid, 4-methyl- | 1583, 1.95 | 897 |
Acetamide, N-ethyl- | 1603, 1.71 | 950 |
Butanoic acid | 1607, 1.58 | 941 |
Acetamide, N-methyl- | 1615, 1.63 | 963 |
Propanamide, N-methyl- | 1663, 1.70 | 956 |
Butanoic acid, 3-methyl- | 1667, 1.60 | 928 |
2-Pyrrolidinone, 1-methyl- | 1703, 1.96 | 936 |
3,4-Dimethyldihydrofuran-2,5-dione | 1759, 2.05 | 719 |
Acetamide | 1783, 1.53 | 976 |
1,2-Cyclopentanedione | 1819, 1.67 | 888 |
Propanamide | 1847, 1.57 | 870 |
1H-Imidazole, 1-methyl-4-nitro- | 1883, 1.88 | 671 |
2,5-Pyrrolidinedione, 1-ethyl- | 1975, 1.85 | 936 |
Piperidine-2,5-dione | 1975, 1.98 | 798 |
2,5-Pyrrolidinedione, 1-methyl- | 2011, 1.76 | 960 |
2,5-Pyrrolidinedione, 1-propyl- | 2075, 1.92 | 861 |
2-Pyrrolidinone | 2175, 1.65 | 976 |
2-Piperidinone | 2295, 1.73 | 959 |
Dianhydromannitol | 2419, 1.70 | 944 |
Glycerin | 2463, 1.47 | 888 |
3-Pyridinol | 2586, 1.50 | 921 |
2,5-Pyrrolidinedione | 2646, 1.50 | 923 |
N-[2-Hydroxyethyl]succinimide | 2902, 1.69 | 941 |
Table 1: Similarity values and retention time of chemical compounds present in HTL algae water using column combination of polar × non-polar. Compounds were identified using the NIST 2008 Library. The scale of similarity values is 0-999. Higher similarity values correspond to a closer match of the spectra obtained for that sample to that for the compound in the NIST database. R.T. represents retention time of chemical compounds (primary, secondary).
Name | R.T. (sec) | Similarity |
Acetone | 347 , 1.89 | 952 |
2-Butanone | 435, 2.12 | 934 |
Ethanol | 467 , 1.76 | 952 |
Pyridine | 887, 2.10 | 947 |
Pyrazine | 939, 1.99 | 928 |
Acetic acid | 1339, 1.53 | 981 |
Propanoic acid | 1471, 1.56 | 948 |
Butanoic acid | 1603, 1.59 | 935 |
Acetamide | 1783, 1.54 | 961 |
2,5-Pyrrolidinedione, 1-methyl- | 2011, 1.76 | 957 |
2,5-Pyrrolidinedione | 2642, 1.52 | 940 |
N-[2-Hydroxyethyl]succinimide | 2902, 1.71 | 935 |
Table 2: Retention time and similarity values of standards analyzed using polar × non-polar. Compounds were identified using the NIST 2008 library. The scale of similarity values is 0-999. Higher similarity values correspond to a closer match of the spectra obtained for the standard to that for the compound in the NIST database. R.T. represents retention time of chemical compounds (primary, secondary).
Name | R.T. (s) | Similarity |
Carbamic acid, monoammonium salt | 234 , 0.521 | 999 |
Carbamic acid, monoammonium salt | 234 , 0.653 | 981 |
Trimethylamine | 243 , 0.540 | 922 |
Acetone | 243 , 0.648 | 927 |
Dimethyl ether | 243 , 0.720 | 932 |
Dimethylamine | 252 , 0.578 | 925 |
2-Butanone | 261 , 0.684 | 933 |
Acetic acid | 261 , 3.139 | 963 |
Methanethiol | 306 , 0.550 | 924 |
Pyrazine | 333 , 1.157 | 949 |
Pyridine | 342 , 1.063 | 950 |
Cyclopentanone | 378 , 1.032 | 944 |
Pyrazine, methyl- | 405 , 1.217 | 954 |
Acetamide, N-methyl- | 414 , 4.850 | 887 |
2-Cyclopenten-1-one, 2-methyl- | 504 , 1.409 | 951 |
Pyrazine, 2,5-dimethyl- | 513 , 1.207 | 919 |
Pyrazine, 2,3-dimethyl- | 522 , 1.265 | 905 |
2,5-Pyrrolidinedione, 1-methyl- | 801 , 4.178 | 955 |
Quinuclidine-3-ol | 828 , 2.750 | 680 |
2,5-Pyrrolidinedione, 1-ethyl- | 873 , 3.058 | 889 |
2-Piperidinone | 954 , 5.474 | 954 |
Caprolactam | 963 , 2.458 | 746 |
N-[2-Hydroxyethyl]succinimide | 1089 , 2.429 | 857 |
N-[2-Hydroxyethyl]succinimide | 1260 , 2.278 | 814 |
1-Phenethyl-pyrrolidin-2,4-dione | 1791 , 3.742 | 788 |
5,10-Diethoxy-2,3,7,8-tetrahydro-1H,6H-dipyrrolo[1,2-a;1',2'-d]pyrazine | 2016 , 4.608 | 787 |
Table 3: Similarity values and retention time of chemical compounds identified in HTL algae water using column combination of non-polar × polar. Compounds were identified using the NIST 2008 library. The scale of similarity values is 0-999. Higher similarity values correspond to a closer match of the spectra obtained for the sample to that for the compound in the NIST database. R.T. represents retention time of chemical compounds (primary, secondary).
Results clearly illustrate the ability of the column combination of polar × non-polar to resolve polar compounds and light volatiles present in the aqueous fraction of algae bio-crude without prior sample preparation techniques. Drastic peak tailing was observed for organic acids and N-compounds while using the non-polar× polar column combination. This peak tailing was not observed for the early eluting light organics. This behavior has been reproducible when verifying the instrument is free of leaks (the vacuum in TOF-MS was below 2.7 × 10⁻⁵ Pa for GC carrier gas flow rate of 1.5 ml min-1). It would be expected that if there was an issue with dead volume in the press tight connector or if the cold jet flow rate would be excessive that the behavior would be observed across the chromatogram. However, even late eluting compounds (not identified on the figure) do not tail. Therefore, we conclude that this is a result of the aqueous sample injection/column configuration combination.
The split ratio is the volume of sample entering the column versus the amount lost to the split flow. The higher the split ratio the smaller the amount of sample introduced onto the column. Generally this produces more efficient peaks which would improve peak capacity. Determining the proper split ratio for samples can prevent problems from column overloading (split ratio too low) or issues with compound detection (split ratio too high). Therefore, a split ratio of 1:250 was used in the GC × GC–TOF-MS data acquisition methods for both column combinations to prevent column loading and also to improve peak capacity.
Similarity values for chemical compounds identified are in the range of 850-999. This indicates that chemical compounds are identified with more than 85% confidence. This was achieved by using an MS acquisition rate of 400 spectra/second in GC × GC–TOF-MS data acquisition methods. A 400 spectra/second acquisition rate improves the signal-to-noise ratio of peaks which increases the similarity values of identified chemical compounds17. Higher similarity values enable us to identify chemical compounds with high confidence. However, this high MS acquisition rate results in a long data analysis time. Therefore, it is recommended to use a 200 spectra/sec MS acquisition rate for quantification of these samples which decreases the data analysis time.
The GC × GC–TOF-MS data acquisition method developed for characterizing aqueous algae bio-crude with polar × non-polar could be further improved by increasing the length of the secondary column. By increasing the length of the secondary column, resolution can be improved in the second dimension which enables the separation of isomers present in the sample16,17. Peak capacity could also be further improved with increase in the length of the secondary column. HTL algae waters characterized in this paper are dilute11 (contain approximately 3 total wt% of carbon) and may not require a longer secondary column. However, this recommendation could be beneficial during characterization of complex and concentrated aqueous samples.
Since the maximum programmable temperature of the polar column is 260 °C, this method cannot elute high boiling point chemical compounds such as long chain fatty acids, mono-glycerides, di-glycerides, triglycerides and oligomers of amino acids as well as sugars16. Samples containing these compounds, when analyzed, may contaminate the GC injector and columns. Contamination of GC injector and columns leads to peak tailing, change in the retention time of chemical compounds, and high noise or low signal-to-noise ratio of the MS detector which are undesirable for qualitative as well as quantitative characterization. Hence, when utilizing this column combination for analyzing aqueous samples containing high boiling point chemical compounds analysts should employ appropriate quality control methods.
The chemical compounds identified in the aqueous fraction of algae bio-crude have a wide variety of applications. Pyridine, pyrazine and their alkyl derivatives are intermediate chemicals for production of agrochemicals, drugs36,37, and are widely used as solvents in homogenous catalysis38,39. Similarly, derivatives of succinimide also have a wide variety of applications including polymer intermediates, detergents40, clinical drugs41,42, fuel additives and lubricating oil additives40. The organic acids present in HTL algae water can be used as a feedstock in catalytic processes to produce ketones or esters for easy separation from the aqueous phase43.
The GC × GC–TOF-MS method developed for the column combination of polar × non-polar in this paper can also be employed to analyze water sample from biological process, food processing, and environmental wastes. Researchers used this column combination for characterization of organic samples44-47. It is reported that this column combination is best for effective separation of different classes of hydrocarbons – aliphatic, aromatics, alkyl benzene and binuclear aromatics44-46. Therefore, utilizing a polar separation for the first dimension of separation and non-polar for the second dimension of separation would be suitable column configurations for characterization of both aqueous as well as organic fraction of bio-crude produced from hydrothermal liquefaction of biomass.
The authors have nothing to disclose.
This manuscript has been authored by Battelle Memorial Institute under Contract No. DE-AC05-76RL01830 with the U.S. Department of Energy. The U.S Government retains and the publisher, by accepting the article for publication, acknowledges that the U.S. Government retains a non-exclusive, paid-up, irrevocable, worldwide license to publish or reproduce the published form of this manuscript, or allow others to do so, for U.S. Government purposes.
GC × GC – TOF/MS | Leco | PEG4D11DLN15 | Commercial Pegasus 4D |
ChromaTOF version 4.50 | Leco | Data analysis software | |
Rxi-5MS GC column | Restek | 13420 | 2.3 m column was used from this column. |
Stabilwax GC column | Restek | 10626 | |
HP-5 GC column | Agilent | 19091J-416 | |
Stabilwax GC column | Restek | 15121 | |
Presstight Connector | Restek | 20430 | |
GC injector liner | Restek | 23305.5 | |
GC Injector ferrules | Agilent | 5181-3323 | |
Non-stick liner O-rings | Agilent | 5188-5365 | |
Transfer line ferrules | Restek | 20212 | |
Ethanol | Sigma-Aldrich | 459844 | Chromatography grade |
Acetone | Sigma-Aldrich | 414689 | Chromatography grade |
Acetic acid | Sigma-Aldrich | 320099 | Chromatography grade |
2-butanone | Sigma-Aldrich | 360473 | Chromatography grade |
Propanoic acid | Sigma-Aldrich | 402907 | Chromatography grade |
Butanoic acid | Sigma-Aldrich | 19215 | Chromatography grade |
Pyridine | Sigma-Aldrich | 270970 | Chromatography grade |
Pyrazine | Sigma-Aldrich | 65693 | Chromatography grade |
Acetamide | Sigma-Aldrich | 695122 | Chromatography grade |
2,5-pyrrolididione | Sigma-Aldrich | S9381 | Chromatography grade |
N-methylsuccinimide | Sigma-Aldrich | 325384 | Chromatography grade |
N-(2-hydroxyethyl)succinimide | Sigma-Aldrich | 444073 | Chromatography grade |