Sample Preparation for Mass Cytometry Analysis
Summary
This article describes the collection and processing of samples for mass cytometry analysis.
Abstract
Mass cytometry utilizes antibodies conjugated with heavy metal labels, an approach that has greatly increased the number of parameters and opportunities for deep analysis well beyond what is possible with conventional fluorescence-based flow cytometry. As with any new technology, there are critical steps that help ensure the reliable generation of high-quality data. Presented here is an optimized protocol that incorporates multiple techniques for the processing of cell samples for mass cytometry analysis. The methods described here will help the user avoid common pitfalls and achieve consistent results by minimizing variability, which can lead to inaccurate data. To inform experimental design, the rationale behind optional or alternative steps in the protocol and their efficacy in uncovering new findings in the biology of the system being investigated is covered. Lastly, representative data is presented to illustrate expected results from the techniques presented here.
Introduction
Cytometry enables the simultaneous measurement of multiple antibody targets at a single cell level across large populations of cells. In traditional fluorescence-based flow cytometry, the number of parameters that can be quantified is limited by spectral overlap between the emission spectrum of multiple fluorophores, which requires increasingly complex compensation calculations as the number of parameters increases. These limitations are addressed by mass cytometry, where heavy metal-conjugated antibodies are detected and quantified by time of flight (TOF) mass spectrometry to greatly expand the number of parameters collected simultaneously and yield a high dimensional protein-abundance profile for each individual cell.
A basic understanding of the workings of the mass cytometry instrument is beneficial to the user and may be essential for troubleshooting. For a more thorough description of tuning and running a mass cytometry machine, see the related manuscript1. Briefly, a cell sample is labeled with a panel of metal conjugated antibodies targeting cell surface markers, cytoplasmic proteins, nuclear proteins, chromatin-bound proteins or other epitopes of interest (Figure 1i). The labeled cells are loaded onto the machine, either one at a time by manual injection or using an autosampler that samples from a 96-well plate. The loaded cells are injected through a nebulizer, which generates a spray of liquid droplets encapsulating the cells (Figure 1ii). This spray is positioned so that the cells are ionized by an argon plasma torch. This ionization generates a particle cloud comprised of all the constituent atoms of each cell (Figure 1iii). As this particle cloud travels to the detector, low atomic mass atoms are separated from the high mass ions by a quadrupole mass filter. The remaining high mass ions continue to the detector, where the abundance of each isotope is quantified (Figure 1iv). The raw data collected by the detector, are analyzed by the mass cytometry instrument software to identify cell events. For each identified cell event, the signal detected in each channel is quantified and saved to an output .fcs file. The mass channels used for detecting the heavy metal conjugated antibodies exhibit minimal spectral overlap, which ranges from 0-4% with most contributions below 1%. Because of this low cross-talk between channels, it is generally unnecessary to transform the data with a compensation matrix before analysis2. However, care should be taken during the design of the experimental panel of antibodies to ensure that an antibody with a high-abundance epitope is not assigned to a mass channel that contributes signal to a channel assigned to a low-abundance antibody, as this may create an artificially high population in the channel receiving the signal contribution.
The exact preparation of samples for mass cytometry analysis is highly dependent upon the types of samples being collected and the experimental hypothesis being tested. We provide examples of two protocols for harvesting different types of cells (human embryonic stem cells) and primary cells (mouse breast tumor epithelial cell isolate). When beginning a mass cytometry study, it is advisable to first carry out a small pilot experiment to ensure that all protocols and antibodies to be utilized are working well in the investigator's hands. This is especially essential when custom conjugated antibodies are to be used, as the partial reduction reaction during the antibody conjugation has the potential to disrupt antibody affinity; therefore, each custom antibody needs to be validated empirically to ensure data accuracy. Other considerations include determining if cell surface antibodies to be used in the assay will recognize their epitopes after fixation or if they need to be applied to live cells. Some fixation may prevent proper staining with cell surface antibodies as is known to occur with peptide-MHC staining3,4. Performing cell surface antibody staining on live cells may be necessary for some antibodies, but this precludes the option of barcoding prior to antibody labeling as most barcoding methods are performed after fixation5 although antibody-based barcoding6,7 is an exception.
When determining the number of cells to be prepared for analysis, it is important to know that only a fraction of the cells loaded onto the machine will be detected and produce data. This loss is primarily due to inefficiencies when the nebulizer sprays the sample at the torch. The exact percent loss depends upon the mass cytometry machine setup and cell type but can range from 50-85% and should be considered when designing the experiment. This protocol has been optimized for 2×10⁶ cells per sample but can be adapted for processing smaller or larger sample sizes. This protocol can be used with minimal modifications for sample sizes from 1 x 10⁶ to 4 x 10⁶, however it is critical that sample size be kept consistent within an experiment. Changes in cell number can affect the intensity of barcoding and antibody staining and should be kept roughly consistent across samples to be directly compared.
Some procedures, such as dead cell labeling and DNA labeling, should be carried out in the vast majority, if not all experimental designs. The labeling of dead cells in experiments analyzing only surface markers can be achieved using Rh103, but Rh103 should be avoided for experiments where permeabilization is required as it results in staining loss. For experiments involving permeabilization, it is advisable to utilize cisplatin8 and, when possible, an antibody recognizing cleaved PARP or cleaved Caspase to detect apoptotic and dead cells.
Barcoding samples can reduce antibody consumption, decrease acquisition time and eliminate sample-to-sample variability9. The process of barcoding involves applying a unique sample-specific code to all cells, which is used to assign each cell to its sample of origin. After barcoding the samples may be pooled prior to antibody staining, a process that ensures all samples are stained equally. To minimize experimental error, it is prudent to barcode and pool any samples that are to be directly compared to each other. Currently there exist several methods for barcoding samples for mass cytometry analysis5,6,7, two of which are presented here (see below).
With currently available reagents it is possible to quantify the abundance of 38 antibody targets, identify cells in S-phase10, distinguish live and dead cells8 and measure cellular levels of hypoxia11 in a multiplexed experiment of multiple samples. This ability to collect high parameter single cell data for large cell populations enables improved profiling of highly heterogeneous cell populations and has already produced a number of novel biological insights12,13,14,15,16. Distilling the resulting complex data to interpretable information has required the use of computational algorithms including Spanning Tree Progression of Density Normalized Events (SPADE)17 and viSNE18.
This article presents an accessible overview of how to design and carry out a mass cytometry experiment and introduces basic analysis of mass cytometry data.
Protocol
1. Cell Harvesting
- Harvesting cells from primary tissue
NOTE: The process described for harvesting cells from primary tissue is specifically applicable to mouse breast tumor tissue and may not be applicable as is to primary tissues from other sources.- Prepare digestion buffer by dissolving 5 mg hyaluronidase and 30 mg collagenase in 10 mL DMEM/F12 media per gram of tissue to be processed. Filter sterilize digestion buffer.
- Isolate primary mammary gland tumor from mouse and record tumor weight.
- Mince tissue with #10 scalpel for at least 5 min.
- Add minced tissue to appropriate volume of digestion buffer (10 mL buffer per gram of tissue).
- Shake minced tissue in digestion buffer at 100 rpm for 1-3 h at 37 °C.
- Obtain single cell suspension by passing cells through 0.4 μm filter into a 50 ml tube.
- Centrifuge cells at 300 x g for 10 min at 4 °C. Decant or carefully aspirate the supernatant without disturbing the pellet.
- Resuspend pellet in 4 mL DMEM/F12 and transfer to 5 mL round bottom tube.
- Harvesting cells from tissue culture
- Wash plate or flask of adherent cells with calcium and magnesium free phosphate buffered saline (PBS) at room temperature.
NOTE: The technique described for harvesting cells is specifically applicable to adherent human embryonic stem cell (hESC) culture cells. However, the remainder of the described protocol is broadly applicable to other cultured cell lines, non-adherent lines and primary cells. - Add warmed (37 °C) trypsin or other enzymatic digestion reagent optimized for achieving a single cell suspension from the adherent cells. Follow manufacturer's protocol.
NOTE: Trypsin and other enzymatic dissociation reagents have the potential to affect cellular markers. - Incubate the plate at 37 °C for 2-5 min to detach cells. For high confluency cultures, gently tap the plate to help detach the cells.
- Transfer fully detached cells from the plate into a 5 mL round bottom tube and gently pipet using a 1 mL pipet to dissociate cells.
NOTE: For processing large numbers of samples all steps can alternatively be performed in a 96 well round bottom plate. For processing samples in a 96 well format all washes can be performed at a volume of 250 μL. The volumes described in other steps can be adjusted so the total volume does not exceed 300 μL. - Quench the enzymatic digestion reagent with an equal volume wash buffer (0.5% BSA and 0.02% sodium azide in PBS).
NOTE: Sodium azide is a hazardous chemical. Proper safety precautions must be observed for its preparation and handling. - Centrifuge cells at 300 x g for 5 min at 37 °C. Decant or carefully aspirate the supernatant without disturbing the pellet.
- Resuspend cells in 1 mL serum free media.
- Count cells by transferring 10 μL of the cell suspension to a 1.5 mL microcentrifuge tube. Dilute aliquot to a known ratio in trypan blue and transfer to a hemocytometer or automated cell counting system.
- Wash plate or flask of adherent cells with calcium and magnesium free phosphate buffered saline (PBS) at room temperature.
- Labeling of S-phase population
NOTE: If S-phase labeling is not to be performed proceed to stem 1.4.- Prepare 1 mL of 10 μM 5-Iodo-2'-deoxyuridine (IdU) in serum free DMEM F12 or other appropriate media for each 2 x 10⁶ cells to be analyzed.
- Add 500 μL of 10 μM IdU in serum free media for each 2 x 10⁶ cells.
NOTE: While IdU labeling can be performed in media containing serum, free protein will react with cisplatin, preventing proper labeling of dead cells. If media containing serum is used during IdU labeling an additional wash step is serum free media is necessary to remove serum proteins before cisplatin live/dead staining. - Gently resuspend pellets with 1 mL pipet.
- Incubate for 10 min at 37 °C with gentle rocking.
- Live/Dead labeling
- For each sample prepare 500 μL of 50 μM cisplatin in serum free DMEM-F12 or cell type appropriate media.
NOTE: If labeling of the S-phase population by IdU is not to be performed, resuspend samples at a concentration of 4 x 10⁶ cells/mL. Resuspending the cells before adding cisplatin enables quicker mixing of solutions for uniform live/dead labeling. - Add 500 μL of 50 μM cisplatin per 2 x 10⁶ cells to samples.
- Incubate at room temperature (RT) for 1 min on an orbital shaker with constant mixing.
- Quench the cisplatin with an equal volume of wash buffer.
- Centrifuge cells at 300 x g for 5 min at RT. Decant or carefully aspirate the supernatant without disturbing the pellet.
- Wash samples twice with 500 μL wash buffer to remove excess cisplatin.
- Wash samples twice with 500 μL PBS to remove excess protein.
- For each sample prepare 500 μL of 50 μM cisplatin in serum free DMEM-F12 or cell type appropriate media.
- Sample fixation
- Resuspend sample in 500 μL PBS.
- Add equal volume of 4% PFA in PBS for a final concentration of 2%; pipette to mix.
NOTE: Prepare 4% PFA fresh from powder, adjust pH to 6.9 and pass through a 0.44 μm filter. 4% PFA in PBS can be stored at 4 °C for up to two weeks. Avoid premade formalin supplied in ampules, unless specifically tested, as it often contains metal contaminants which may interfere with the measured mass channels. Lower concentration of PFA may be sufficient and help to minimize the effect of fixation on antibody binding but should be tested empirically. - Incubate for 15 min at RT on an orbital shaker with constant mixing.
- Centrifuge cells at 300 x g for 5 min at 4 °C. Decant or carefully aspirate the supernatant without disturbing the pellet.
- Wash samples with PBS to remove PFA solution.
NOTE: At this step samples can be stored briefly at 4 °C. Prolonged storage at 4 °C may result in degradation of the sample and decreased staining.
2. Barcoding
NOTE: While methodology for utilizing monoisotopic cisplatin barcoding and palladium barcoding is presented simultaneously, either can be used independently or avoided entirely if not required by the experiment.
- Monoisotopic Cisplatin Barcoding
NOTE: Since cisplatin barcoding and cisplatin Live/Dead staining rely on overlapping channels care should be taken to ensure that background cisplatin Live/Dead staining in the live cells is minimized as this may interfere with the accuracy of the cisplatin barcode.- Dilute 1 mM monoisotopic cisplatin stock solutions to 200 μM in PBS.
- For each unique cisplatin barcode prepare a 1.5 mL tube with 500 μl PBS for each 2 x 10⁶ cells receiving that barcode.
- To prepare each unique barcode add each applicable monoisotopic cisplatin to a final concentration of 200 nM.
- Resuspend cells in 500 μl of PBS per 2 x 10⁶ cells.
- Add an equal volume of the corresponding barcode solution to each sample.
- Incubate samples at RT for 5 min on an orbital shaker with constant mixing.
- Quench cisplatin with an equal volume of wash buffer.
- Centrifuge cells at 300 x g for 5 min at 4 °C. Decant or carefully aspirate the supernatant without disturbing the pellet.
- Wash samples twice with 500 μL wash buffer to remove excess cisplatin.
- Palladium Barcoding
NOTE: Palladium barcoding reagents can be either prepared5 or purchased commercially.- Transient partial permeabilization19
NOTE: Palladium chelation barcoding requires partial permeabilization for the reagents to pass through the cell membrane and robustly label the cell.- Wash samples with 500 μL PBS.
- Wash samples with 500 μL PBS plus 0.02% saponin.
- Resuspend pellet in residual volume.
- Apply palladium barcoding.
- Dilute 100x stock of palladium barcoding reagent in 1 mL ice-cold PBS plus 0.02% saponin.
- Rapidly add diluted barcoding reagent to resuspended sample.
- Incubate for 15 min at RT on an orbital shaker at with constant mixing.
- Wash samples twice with 500 μL wash buffer.
- Transient partial permeabilization19
3. Cell Surface Staining
NOTE: Cell surface staining can be performed on live cells prior to fixation. This may be necessary for antibodies that lose affinity for their epitope after fixation. Some cell samples may benefit from additional blocking, such as Fc blocking for leukocytes, prior to antibody labeling to reduce background. Optimal blocking should be empirically determined for specific sample type.
- Prepare cell surface antibody staining panel.
- Combine 0.5 μL, or empirically determined quantity, of each 0.5 mg/mL cell surface antibody per sample into a 1.5 mL tube. Add washing buffer if necessary to bring volume up to 10 μL per sample. Mix by pipetting.
NOTE: Determine working dilution for each antibody prior to experiment empirically by titration experiment. - Split cell surface antibody pool equally into one 1.5 mL tube for each sample to be stained.
- Prepare 500 μl of wash buffer in a 1.5 mL tube for each sample.
- Combine 0.5 μL, or empirically determined quantity, of each 0.5 mg/mL cell surface antibody per sample into a 1.5 mL tube. Add washing buffer if necessary to bring volume up to 10 μL per sample. Mix by pipetting.
- Apply cell surface staining to samples in normalized volume for all samples.
NOTE: To ensure consistent antibody labeling across multiple samples it is vital to carefully control the sample volume and antibody concentration. The following steps aim to achieve this consistency by ensuring that the final sample volumes after the antibody has been added are uniform.- Centrifuge cells at 300 x g for 5 min at 4 °C. Decant or carefully aspirate the supernatant without disturbing the pellet.
- With a 200 μL pipette set to 50 μL, remove remaining solution from sample pellet and transfer to a tube of the aliquoted cell surface antibody pool.
- Pipette up all liquid in the aliquot tube without drawing air into the pipette tip.
- While holding the pipette plunger to avoid drawing air move the tip into a prepared tube of 500 μL wash buffer and release the plunger.
- Add back the contents of the pipette tip to the sample and resuspend the sample in the liquid with gentle pipetting.
- Incubate the samples for 1 h at RT on an orbital shaker with constant mixing.
- Wash samples twice with 500 μL wash buffer to ensure that all free antibody is washed away.
- Wash samples with 500 μL PBS.
- Resuspend the cell pellet in 500 μl PBS.
- Add equal volume of 4% PFA in PBS; pipette to mix.
- Incubate for 10 min on an orbital shaker.
4. Cell Permeabilization and Intracellular Staining
- Cell permeabilization
- Centrifuge cells at 300 x g for 5 min at 4 °C. Decant or carefully aspirate the supernatant without disturbing the pellet.
- Resuspend cells in residual volume by gently vortexing until the pellet is dissociated.
NOTE: Failure to dissociate cells prior to adding MeOH will result in cells adhering together and producing a thin film which will result in partial sample loss. - Immediately add 1 mL of 100% MeOH per 2 x 10⁶ cells and gently pipette to mix.
NOTE: Other permeabilization methods can be substituted for MeOH and may be necessary to achieve optimal permeabilization for some cell types. For some cell sources a 0.1% Triton X-100, 0.2% Tween-20 or 0.1% saponin in PBS solution for permeabilization may maintain cell integrity better while still providing consistent permeabilization. - Incubate samples for at least 1 h or up to a maximum of 24 h at 4 °C for permeabilization.
NOTE: At this step samples in MeOH can be stored for up to 1 month at -80 °C. - Centrifuge cells at 300 x g for 5 min at 4 °C. Decant or carefully aspirate the supernatant without disturbing the pellet.
- Add 1 mL of washing buffer for each ml MeOH used to permeabilize the sample. Gently resuspend cell pellet.
- Wash sample twice with 500 μL wash buffer.
- Prepare intracellular antibody staining panel.
- Combine 0.5 μL, or empirically determined quantity, of each 0.5 mg/mL intracellular antibody per sample into a 1.5 mL tube. Add washing buffer if necessary to bring volume up to 10 μL per sample. Mix by pipetting.
- Split intracellular antibody pool equally into one 1.5 mL tube for each sample.
- Prepare 500 μL of wash buffer in a 1.5 mL tube for each sample.
- Apply intracellular staining to samples in normalized volume for all samples.
NOTE: To ensure consistent antibody labeling across multiple samples it is vital to carefully control the sample volume and antibody concentration.- Centrifuge cells at 300 x g for 5 min at 4 °C. Decant or carefully aspirate the supernatant without disturbing the pellet.
- With 200 μL pipette set to 50 μL remove remaining solution from sample pellet and transfer to a tube of the aliquoted cell surface antibody pool.
- Pipette up all liquid in the aliquot tube without drawing air into the pipette tip.
- While holding the pipette plunger to avoid drawing air move the tip into a prepared tube of 500 μL wash buffer and release the plunger, drawing up wash buffer for a total sample volume of 50 μL.
- Add back the contents of the pipette tip to the sample and resuspend the sample in the liquid with gentle pipetting.
- Incubate the samples for 1 hr at RT on an orbital shaker with constant mixing.
- Wash samples twice with 500 μL wash buffer.
- Wash samples with 500 μL PBS.
5. Iridium Labeling
- Fix samples
- Resuspend samples in 500 μL of PBS.
- Add 500 μL of 4% PFA in PBS.
- Incubate for a minimum of 15 min at RT on an orbital shaker with constant mixing.
- Apply Iridium labeling of DNA
- Dilute the 125 μM 500x iridium intercalating reagent in 4% PFA in PBS to a concentration of 62.5 nM.
- Add 500 μL 62.5 nM iridium PFA solution to samples.
NOTE: For experiments using permeabilized cells, dilute the 500x Ir191/193 stock for a final dilution of 1:2,000 to avoid overstaining. - Incubate for 15 min at RT on an orbital shaker with constant mixing.
NOTE: If performing monoisotopic cisplatin barcoding do not incubate samples with iridium for longer than 15 min since strong Ir193 signals can contribute to the Pt194 mass channel and negatively impact barcoding quality. - Centrifuge cells at 300 x g for 5 min at 4 °C. Decant or carefully aspirate the supernatant without disturbing the pellet.
- Wash samples twice with 500 μL 0.1% BSA in filtered deionized water.
NOTE: Once prepared we recommend running samples within 24 h if possible. Prepared samples may be stored short term at 4 °C, but care should be taken to avoid degradation. If possible the final washes should be performed in filtered deionized water without BSA as this will decrease the deposition on the spray chamber and sampler cones of the machine which will decrease instrument cleaning. For hESCs it is necessary to perform these washes while including BSA to avoid sample loss from sticking to the tube surface.
6. Prepare Samples for Acquisition
- Count cells
- Resuspend cells in 500 μL 0.1% BSA in filtered deionized water and filter into a fresh tube through a 35 μm cell strainer cap.
NOTE: Lowering the BSA level for the final washes decreases the residue left on the Mass cytometry nebulizer. Non-adherent cells can be washed and resuspended in filtered deionized water. - Count cells by transferring 10 μL of the cell suspension to a microcentrifuge tube. Dilute aliquot to a known ratio in trypan blue (to aid with cell visualization) and transfer to a hemocytometer or automated cell counting system.
- Centrifuge cells at 300 x g for 5 min at 4 °C. Decant or carefully aspirate the supernatant without disturbing the pellet.
- Resuspend cells in 500 μL 0.1% BSA in filtered deionized water and filter into a fresh tube through a 35 μm cell strainer cap.
- Prepare and load samples
- To prepare calibration beads remove from refrigerator and shake vigorously to resuspend.
- If running samples using a mass cytometry autosampler, add 50 μL of calibration beads to each well of sample plate then add the desired number of cells to be analyzed. If running samples by manual injection add 50 μL of calibration beads to sample, dilute sample in filtered deionized water, mix well and load sample into Mass cytometry sample injection port. The appropriate sample dilution may vary depending upon the cell type being analyzed, but a dilution of 106 is generally appropriate1.
Representative Results
The protocol presented here can be broadly applied to a wide variety of cultured and primary cell samples with only minor modifications. Depending upon the requirements of the experiment, it can be performed in a modular manner when certain elements, such as barcoding or cell surface staining, are not necessary. Utilized in its entirety this protocol enables the preparation of multiplexed mass cytometry samples labeled for dead cell exclusion, S-phase population identification and stained for the quantification of up to 38 antibody targets.
Expected results produced by the methods outlined in this protocol (Figure 2) are depicted in Figure 3. Upon collection of data, normalization of signal intensity based upon the calibration bead intensity can be performed within the mass cytometry software. Following normalization, initial data processing to remove calibration beads, gate on single cells and remove dead cells can be performed manually using any software capable of analyzing flow cytometry data. Removal of calibration beads can be performed manually by gating on the Ir191+ Ce140- population (Figure 3A) or with a MATLAB based algorithm20. Single-cell events (black outline, Figure 3B) can be gated while removing debris and cell multiplets, by gating on the biaxial plot of Ir193 and Event Length (Figure 3B). Cisplatin labeling of dead cells can be utilized to quantify the amount of cell death; shown are examples of samples with low (Figure 3D) and higher (Figure 3E) quantities of dead cells. Dead cells can be removed from the data by gating off the Pt198+ population (Figure 3E). Barcoding of samples, whether with monoisotopic cisplatin or palladium reagents, results in distinct separation of samples within the barcoding parameters (Figure 3C), which allows cells to be assigned to their original sample identity. Additional optional methods, such as IdU labeling, permit the detection of specific populations, e.g., S-phase cells (Figure 3F). Following initial normalization, debarcoding and gating, the high dimensional data can be analyzed utilizing a variety of algorithms including SPADE17 and several others designed for mass cytometry data analysis and visualization18. Algorithms such as SPADE take the high dimensional data, which can be difficult to interpret since it cannot be directly visualized in its high dimensional state, and generate a lower dimensional representation of the data, which is more amenable to visual interpretation (Figure 3G).
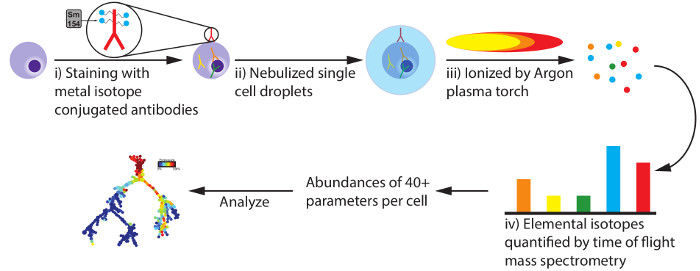
Figure 1: Basic principles of mass cytometry measurement. Preparation of cell samples for mass cytometry analysis involves staining cells with antibodies labeled with metal isotopes mostly from the lanthanide series of elements. In this scheme each antibody raised against a specific epitope is labeled with an isotope possessing a unique atomic mass, such as Samarium 154. Antibodies against epitopes that are surface, cytoplasmic, nuclear or chromatin localized can potentially be used. Labeled cells are injected and sprayed through the mass cytometry nebulizer as single cell droplets where they are ionized by an argon plasma torch. The resultant particle cloud is stripped of low mass atoms by a quadrupole mass filter while the abundance of larger atomic mass ions are measured by the detector. The measured quantity of each unique mass ion corresponds to the cellular abundance of its associated antibody's target epitope. While a theoretical limit of over 100 parameters could be quantified utilizing this methodology, the current commercially available reagents permit detection of over 40 parameters per cell. Please click here to view a larger version of this figure.
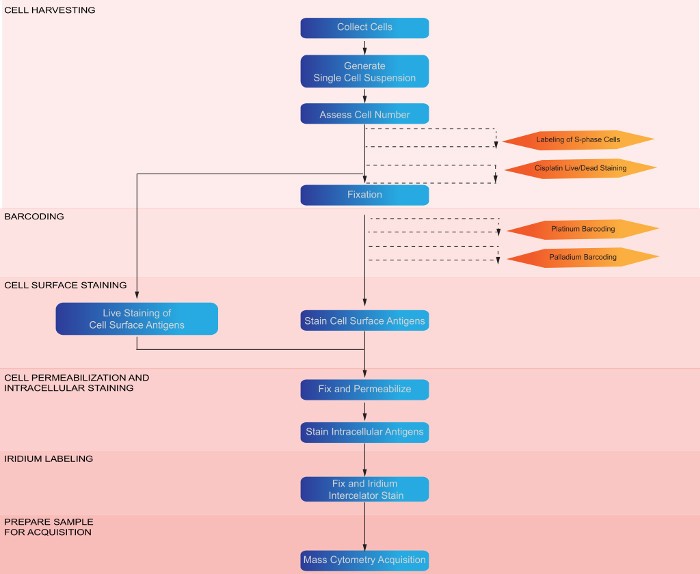
Figure 2: Workflow diagram of experimental procedure and optional steps. Depiction of the major steps involved in the protocol preparing cells for mass cytometry. Optional steps are indicated by orange boxes. Please click here to view a larger version of this figure.
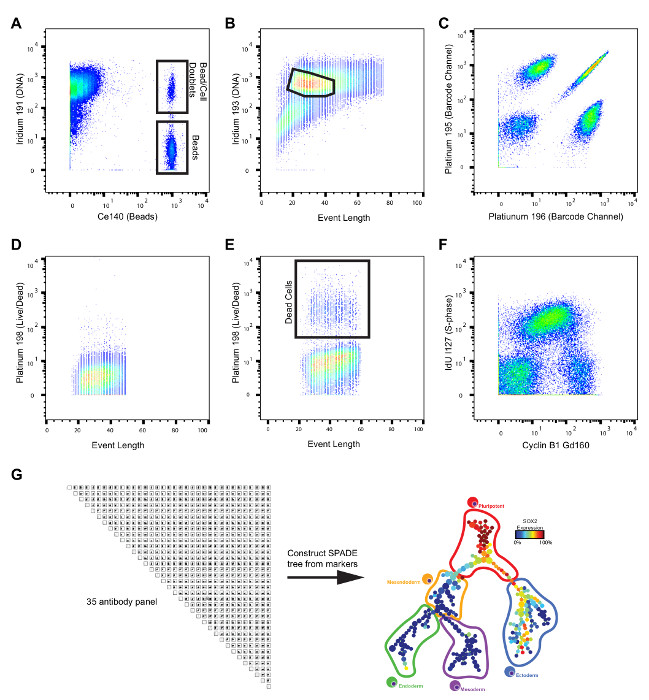
Figure 3: Example of data generated from mass cytometry analysis. (A) Biaxial plot showing the separation of cells (high Ir191, low Ce140), beads (low Ir191, high Ce140) and bead-cell doublets (high Ir191, high Ce140). (B) Biaxial plot showing expected appearance of Ir193 vs Event length. Gating of single cells which removes cellular debris and cell multiplets is shown. (C) Biaxial plot showing example view of two mass channels from cisplatin barcoding. (D–E) Example data from cisplatin Live/Dead staining for samples with a low percentage (D) and a high percentage (E) of dead cells. (F) Biaxial plot of H9 hESC cells labeled with IdU to distinguish cells in S-phase and an antibody against Cyclin B1 to further distinguish cell cycle. (G) N x N plot of data from a 35 antibody mass cytometry experiment of hESCs and a representative SPADE tree constructed from the protein markers and colored by abundance of one of the measured parameters. Please click here to view a larger version of this figure.
Discussion
The protocol presented here has been successfully employed for the processing of various cultured cell lines (H1 and H9 hESCs, mESCs, MCF7, HEK 293, KBM5, HMEC, MCF10a) and primary tissue samples (mouse bone marrow, mouse embryonic liver, mouse adult liver, mouse tumor). Irrespective of the source, any tissue that can be dissociated into single cells while preserving the cellular state should be amenable to analysis by mass cytometry, but may require some protocol optimization. It is important to note that some epitopes may be affected by the specific dissociation, fixation and permeabilization treatments utilized and these methods may need to undergo sample-specific optimization. If low signal is observed for an antibody it may be possible to improve by performing cell surface labeling on live cells, changing permeabilization methods, or decreasing fixation time.
When possible within the experimental design, including barcoding in the sample processing workflow ensures consistency between samples at the level of cell and antibody concentration. Without barcoding, even when great care is taken to control sample processing, it is likely that slight variations in antibody concentration and cell concentration will be introduced between samples. Furthermore, as the percentages of cells positive for specific epitopes will likely vary between samples, the effective antibody-to-epitope ratio may necessarily differ between samples even if the total antibody concentration is kept consistent, potentially leading to inconsistencies in antibody staining. These variations, while generally minor when observing a single channel, can become greatly compounded when performing a high-parameter experiment and may be misinterpreted as biologically meaningful if care is not taken during data analysis.
Analysis of the resulting data from a mass cytometry experiment can take many forms, and a number of computational approaches have been adapted specifically for this application. While providing an exhaustive survey of useful algorithms for mass cytometry data analysis is beyond the scope of this manuscript, approaches that have been successfully utilized are highlighted and interested readers are directed to multiple resources covering this topic21,22,23. Two of the most widely employed, currently available approaches for analysis of mass cytometry data are Spanning Tree Progression of Density normalize Events (SPADE) and viSNE. SPADE forms clusters from groups of cells with similar marker expression and represents each cluster as a node. These nodes are arranged into a SPADE tree where similar nodes are connected by a line (Figure 3G). viSNE utilizes the t-Distributed Stochastic Neighbor Embedding algorithm24 to generate a two-dimensional representation of the high dimension data while preserving the overall data structure. Both SPADE and viSNE are written in MATLAB, the source code is freely available and can be run by users with MATLAB. Additionally, a standalone version of SPADE is available.
While mass cytometry currently permits collection of the highest number of parameters, fluorescent tag based cytometry may be a better approach for some applications. Fluorescence flow cytometry can analyze more cells per second, up to 5 x 10⁴ compared to 500-1,000 for mass cytometry, and has more available validated antibodies25. Additional advancements in fluorescence flow cytometry, such as hyperspectral cytometry26 and new fluorophores27 make fluorescence flow cytometry a viable alternative for all but very high parameter experiments. Additional techniques such as measurement of RNA28 previously only possible by fluorescence based flow cytometry have been recently adapted to mass cytometry permitting simultaneous detection of protein and RNA29. Future expansion of available isotopes and reagents to more completely utilize the mass window of measurable isotopes and expand the repertoire of measurable cellular characteristics will expand the depth of profiling possible by mass cytometry.
The large number of parameters that may be analyzed simultaneously by mass cytometry greatly expands the experimental questions that can be investigated. We hope that this article and accompanying video protocol will enable interested researchers to more effectively utilize mass cytometry to advance their research.
Divulgazioni
The authors have nothing to disclose.
Acknowledgements
Work in the Barton lab was supported by a grant from the Cancer Prevention and Research Institute of Texas (CPRIT RP110471). This research was supported in part, by a training grant fellowship for Ryan L. McCarthy from the National Institutes of Health Training Program in Molecular Genetics 5 T32 CA009299. The core facility that maintains and runs the mass cytometry machine is supported by CPRIT grant (RP121010) and NIH core grant (CA016672).
Materials
| mTeSR1 medium kit | Stem Cell technologies | 05850 | Warm at room temperature before use |
| DMEM F-12 | ThermoFisher | 11330-032 | Warm at 37°C before use |
| Accutase | Stem Cell technologies | 07920 | Warm at 37°C before use |
| Bovine serum albumin | Equitech | BAH62 | |
| phosphate buffered saline | Hyclone | SH30256.01 | |
| Saponin | Sigma-Aldrich | 47036 | |
| Cell ID Pt194 | Fluidigm | Provided at 1mM | |
| Cell ID Pt195 | Fluidigm | Provided at 1mM | |
| Cell ID Pt196 | Fluidigm | Provided at 1mM | |
| Cisplatin | Enzo Life Sciences | ALX-400-040-M250 | Soluble to 25mg/ml in DMSO |
| Cell-ID 20-plex Pd Barcoding Kit | Fluidigm | 201060 | |
| 5-Iodo-2'-deoxyuridine | Sigma-Aldrich | I7125 | Soluble to 74mg/ml in 0.2N NaOH |
| Rhodium 103 intercelating agent | Fluidigm | 201103A | |
| Methanol | Fisher | BP1105-4 | Chill at -20°C before use |
| Sodium Azide | Sigma-Aldrich | S2002 | |
| 5ml round bottom tubes | Falcon | 352058 | |
| 5ml 35um filter cap tubes | Falcon | 352235 | |
| EQ four element calibration beads | Fluidigm | 201078 | |
| Hyaluronidase Type I-S | Sigma-Aldrich | H3506 | |
| Collagenase from Clostridium histolyticum | Sigma-Aldrich | C9891 | |
| Disposable Scalpel #10 | Sigma-Aldrich | Z69239 |
Riferimenti
- Leipold, M. D., Maecker, H. T. Mass cytometry: protocol for daily tuning and running cell samples on a CyTOF mass cytometer. J Vis Exp. , e4398 (2012).
- Leipold, M. D. Another step on the path to mass cytometry standardization. Cytometry A. 87, 380-382 (2015).
- Newell, E. W., et al. Combinatorial tetramer staining and mass cytometry analysis facilitate T-cell epitope mapping and characterization. Nat Biotechnol. 31, 623-629 (2013).
- Leong, M. L., Newell, E. W. Multiplexed Peptide-MHC Tetramer Staining with Mass Cytometry. Methods Mol Biol. 1346, 115-131 (2015).
- Zunder, E. R., et al. Palladium-based mass tag cell barcoding with a doublet-filtering scheme and single-cell deconvolution algorithm. Nat Protoc. 10, 316-333 (2015).
- Lai, L., Ong, R., Li, J., Albani, S. A CD45-based barcoding approach to multiplex mass-cytometry (CyTOF). Cytometry A. 87, 369-374 (2015).
- Mei, H. E., Leipold, M. D., Schulz, A. R., Chester, C., Maecker, H. T. Barcoding of live human peripheral blood mononuclear cells for multiplexed mass cytometry. J Immunol. 194, 2022-2031 (2015).
- Fienberg, H. G., Simonds, E. F., Fantl, W. J., Nolan, G. P., Bodenmiller, B. A platinum-based covalent viability reagent for single-cell mass cytometry. Cytometry A. 81, 467-475 (2012).
- Krutzik, P. O., Nolan, G. P. Fluorescent cell barcoding in flow cytometry allows high-throughput drug screening and signaling profiling. Nat Methods. 3, 361-368 (2006).
- Behbehani, G. K., Bendall, S. C., Clutter, M. R., Fantl, W. J., Nolan, G. P. Single-cell mass cytometry adapted to measurements of the cell cycle. Cytometry A. 81, 552-566 (2012).
- Edgar, L. J., et al. Identification of hypoxic cells using an organotellurium tag compatible with mass cytometry. Angew Chem Int Ed Engl. 53, 11473-11477 (2014).
- Bendall, S. C., et al. Single-cell mass cytometry of differential immune and drug responses across a human hematopoietic continuum. Science. 332, 687-696 (2011).
- Horowitz, A., et al. Genetic and environmental determinants of human NK cell diversity revealed by mass cytometry. Sci Transl Med. 5, 208ra145 (2013).
- Zunder, E. R., Lujan, E., Goltsev, Y., Wernig, M., Nolan, G. P. A continuous molecular roadmap to iPSC reprogramming through progression analysis of single-cell mass cytometry. Cell Stem Cell. 16, 323-337 (2015).
- Han, L., et al. Single-cell mass cytometry reveals intracellular survival/proliferative signaling in FLT3-ITD-mutated AML stem/progenitor cells. Cytometry A. 87, 346-356 (2015).
- Bendall, S. C., et al. Single-cell trajectory detection uncovers progression and regulatory coordination in human B cell development. Cell. 157, 714-725 (2014).
- Qiu, P., et al. Extracting a cellular hierarchy from high-dimensional cytometry data with SPADE. Nat Biotechnol. 29, 886-891 (2011).
- Amir el, A. D., et al. viSNE enables visualization of high dimensional single-cell data and reveals phenotypic heterogeneity of leukemia. Nat Biotechnol. 31, 545-552 (2013).
- Behbehani, G. K., et al. Transient partial permeabilization with saponin enables cellular barcoding prior to surface marker staining. Cytometry A. 85, 1011-1019 (2014).
- Finck, R., et al. Normalization of mass cytometry data with bead standards. Cytometry A. 83, 483-494 (2013).
- Chester, C., Maecker, H. T. Algorithmic Tools for Mining High-Dimensional Cytometry Data. J Immunol. 195, 773-779 (2015).
- Diggins, K. E., Ferrell, P. B., Irish, J. M. Methods for discovery and characterization of cell subsets in high dimensional mass cytometry data. Methods. 82, 55-63 (2015).
- Leelatian, N., Diggins, K. E., Irish, J. M. Characterizing Phenotypes and Signaling Networks of Single Human Cells by Mass Cytometry. Methods Mol Biol. 1346, 99-113 (2015).
- van der Maaten, L. J. P., Hinton, G. E. Visualizaing Data using t-SNE. J. Mach. Learn. Res. 9, 2431-2456 (2008).
- Kling, J. Cytometry: Measure for measure. Nature. 518, 439-443 (2015).
- Gregori, G., et al. Hyperspectral cytometry. Curr Top Microbiol Immunol. 377, 191-210 (2014).
- Chattopadhyay, P. K., et al. Brilliant violet fluorophores: a new class of ultrabright fluorescent compounds for immunofluorescence experiments. Cytometry A. 81, 456-466 (2012).
- Rieger, A. M., Havixbeck, J. J., Barreda, D. R. X-FISH: Analysis of cellular RNA expression patterns using flow cytometry. J Immunol Methods. 423, 111-119 (2015).
- Frei, A. P., et al. Highly multiplexed simultaneous detection of RNAs and proteins in single cells. Nat Methods. 13, 269-275 (2016).
