Summary

Three-dimensional Super Resolution Microscopy of F-actin Filaments by Interferometric PhotoActivated Localization Microscopy (iPALM)

Published: December 01, 2016
doi:

Summary

We present a protocol for the application of interferometric PhotoActivated Localization Microscopy (iPALM), a 3-dimensional single-molecule localization super resolution microscopy method, to the imaging of the actin cytoskeleton in adherent mammalian cells. This approach allows light-based visualization of nanoscale structural features that would otherwise remain unresolved by conventional diffraction-limited optical microscopy.

Abstract

Fluorescence microscopy enables direct visualization of specific biomolecules within cells. However, for conventional fluorescence microscopy, the spatial resolution is restricted by diffraction to ~ 200 nm within the image plane and > 500 nm along the optical axis. As a result, fluorescence microscopy has long been severely limited in the observation of ultrastructural features within cells. The recent development of super resolution microscopy methods has overcome this limitation. In particular, the advent of photoswitchable fluorophores enables localization-based super resolution microscopy, which provides resolving power approaching the molecular-length scale. Here, we describe the application of a three-dimensional super resolution microscopy method based on single-molecule localization microscopy and multiphase interferometry, called interferometric PhotoActivated Localization Microscopy (iPALM). This method provides nearly isotropic resolution on the order of 20 nm in all three dimensions. Protocols for visualizing the filamentous actin cytoskeleton, including specimen preparation and operation of the iPALM instrument, are described here. These protocols are also readily adaptable and instructive for the study of other ultrastructural features in cells.

Introduction

The visualization of complex cellular structures has long been integral to biological insights and discovery. Although fluorescence microscopy can image cells with high molecular specificity, its resolving power is limited by diffraction to ~ 200 nm in the image plane (x,y, or lateral dimension) and > 500 nm along the optical axis (z, or axial dimension)1,2. Hence, the observation of ultrastructural features has historically been limited to electron microscopy (EM). Fortunately, the recent development of super resolution microscopy has circumvented this limit, enabling spatial resolution in the 10 – 100 nm range1-6. In particular, super resolution approaches based on single molecule localization, known by acronyms such as PALM (PhotoActivated Localization Microscopy)4, FPALM (Fluorescence PhotoActivated Localization Microscopy)5 (d)STORM (direct Stochastic Optical Reconstruction Microscopy)6,7, PAINT (Point Accumulation for Imaging Nanoscale Topography)8, GSDIM (Ground State Depletion Microscopy followed by individual molecular return)9, or SMACM (Single-Molecule Active-Control Microscopy)10, as well as their 3-dimensional (3D) implementations, such as interferometric PALM (iPALM)11 or 3D-STORM12, have been valuable in revealing novel insights into the nanoscale organization of numerous biological structures, including neuronal axons and synapses13, focal adhesions14,15, cell-cell junctions16, nuclear pores17, and centrosomes18-20, to name a few.

Another ultrastructural feature in cells for which super resolution microscopy is potentially useful is the actin cytoskeleton. The complex meshwork of filamentous (f)-actin in the cell cortex plays an essential role in the control of cellular shape and mechanical properties21. The organization of f-actin is actively and dynamically regulated though numerous regulatory proteins that strongly influence polymerization, crosslinking, turnover, stability, and network topology22. However, although the characterization of the f-actin meshwork architecture is important for mechanistic insights into a diverse range of cellular processes, the small size (~ 8 nm) of the f-actin filaments hampers their observation by conventional diffraction-limited light microscopy; thus, the visualization of actin fine structure has hitherto been exclusively performed by EM. Here, we describe protocols for visualizing the f-actin cytoskeleton in adherent mammalian cells, using the iPALM super resolution microscopy technique to take advantage of its very high precision capability in 3D11,23. Although the iPALM instrument is highly specialized, instruction on setting up such an instrument has been described recently23, while access to the iPALM microscope hosted by the Howard Hughes Medical Institute has also been made available to the research community with minimal cost. Additionally, the specimen preparation methods described herein are directly applicable to alternative 3D super resolution approaches, such as those based on astigmatic defocusing of the point spread function (PSF)12 or bi-plane detection24, which are more broadly available.

We note that a necessary ingredient for single-molecule localization-based super resolution microscopy in general is the photoswitchable fluorophore25, which allows the three critical requirements for single-molecule localization-based super resolution microscopy to be fulfilled: i) high single-molecule brightness and contrast relative to background signals; ii) sparse distribution of single molecules in a given image frame; and iii) high spatial density of labeling sufficient to capture the profile of the underlying structure (also known as Nyquist-Shannon sampling criterion)26. Thus, for satisfactory results, emphasis should be placed equally on both the proper preparation of specimens to optimize fluorophore photoswitching and to preserve the underlying ultrastructure, as well as on the instrumentation and acquisition aspects of the experiments.

Protocol

1. Imaging Specimen Preparation

  1. Since background fluorescence signals interfere with fluorescence from fluorophore labels, clean the coverglasses by first rinsing them in de-ionized water (ddH2O) and then air-drying them using compressed air. Subsequently, perform plasma etching in a plasma cleaner for 15 sec, or longer if necessary.
  2. To enable drift correction and iPALM calibration, use #1.5 round (22-mm diameter) pre-cleaned coverglasses embedded with fluorescent nanoparticles as fiducial marks, which serve as highly photostable fiducials for reliable calibration and drift correction. Due to the long acquisition time required to accumulate sufficient fluorophore density (> 15 – 30 min), sample drift is inevitable.
  3. Place each fiducialed coverglass into a 6-well tissue culture plate. Sterilize them by ultraviolet (UV) radiation in a laminar flow hood for 15 min.
  4. In a sterile laminar flow hood, prepare fibronectin solution for coverglass coating by diluting 1 mg/ml fibronectin stock solution in sterile Dulbecco's phosphate-buffered saline (DPBS) to a final concentration 2 – 10 µg/ml. Rinse each coverglass three times with DPBS and incubate with 2 ml of the fibronectin solution overnight at 4 °C. Subsequently, aspirate out the fibronectin solution and rinse once with DPBS.
  5. Rinse the cells briefly with DPBS. Incubate with 1 – 2 ml of trypsin for a few min at 37 °C until the cells detach and quench with ~ 10 ml of fresh serum-containing cell culture medium. For example, for human umbilical vein endothelial cells (HUVEC), use large vessel endothelial culture medium supplemented with large vessel endothelial factors and penicillin or streptomycin.
    1. Replate the cells onto the fibronectin-coated coverglass (for sparse density, plate < 50,000 cells per coverglass) and maintain the culture in an incubator set at 95% humidity, 5% CO2, and 37 °C.
  6. For proper preservation of the fine structures of the f-actin cytoskeleton, use buffer solutions based on Good's buffer reagents27.
    1. For example, prepare PHEM buffer as a 2x stock solution (120 mM PIPES, 50 mM HEPES, 20 mM EGTA, 4 mM MgCl2, pH 7.0 with KOH) by dissolving 6.5 g of HEPES, 3.8 g of EGTA, and 190 mg of MgCl2 in ~ 300 ml of ddH2O, with the pH adjusted to 7.0 by dropwise addition of concentrated KOH solution; then, add ddH2O to bring the volume to 500 ml. Sterilize the buffer using a 0.22-µm filter, store it at 4 °C, and dilute it 1:1 with ddH2O before use.
  7. For best results with high density labeling of f-actin, use phalloidin conjugated with organic fluorophores, such as Alexa Fluor 647. At the desired time point after cell replating, fix the cells as follows:
    1. Aspirate the media from each culture well containing the cell specimen. Gently but quickly dispense 2 ml of warm (37 °C) extraction fixatives containing 0.25% glutaraldehyde in PHEM buffer with 0.25% Triton X-100. Incubate it at room temperature for 1 – 2 min. For subsequent steps, use 2 ml of fixative or quenching buffer per coverglass, unless indicated otherwise.
    2. Replace the extraction fixative with a 2.5% glutaraldehyde fixative in PHEM buffer and let the samples incubate for 10 – 12 min. This and following steps are all carried out at room temperature.
    3. Aspirate out the fixatives and gently replace them with PHEM buffer. Tilt and swirl gently, and then wash again with PHEM. Repeat twice.
    4. To quench autofluorescence from glutaraldehyde, which can overwhelm signals from the desired fluorophores, incubate the specimens with a freshly prepared quenching buffer containing NaBH4 at a mass concentration of 0.1% in PHEM. Profuse bubbles will be observed. Occasionally tap the sample dish gently to dislodge the bubbles. Let it incubate for 5 – 10 min.
    5. Aspirate out the quenching buffer and gently replace it with PHEM buffer. Rinse a few times to clear away the bubbles. Pipette in 2 ml of PHEM buffer and let it incubate in the dark for 5 min. Repeat twice and let the specimen rest in PHEM buffer when done.
    6. Prepare a humidity chamber for phalloidin incubation using a large plastic Petri dish padded with a piece of paper towel generously moistened with 5 – 10 ml of ddH2O. Place a large sheet of clean Parafilm on top of the wet paper towel.
    7. Due to the relatively high cost of labeled phalloidin, use a small volume for each labeling. For high density labeling, start with a concentration of 0.3 µM. Prepare ~ 60 µl per coverglass using phalloidin-Alexa Fluor 647 in PHEM buffer.
    8. Pipette 55 – 60 µl of the phalloidin solution onto the Parafilm sheet in the humidity chamber. Using fine forceps, gently remove the specimen coverglass. Be careful to note the correct cell-containing face.
    9. Quickly and gently tap away excess buffer by touching the edge of the coverglass with a folded piece of delicate absorbent paper, and then place the coverglass cell side facing down onto the drop of phalloidin solution on the Parafilm. Make sure that there are no bubbles trapped by the coverglass.
    10. Place the cover on the humidity chamber. Wrap the chamber in aluminum foil to protect it from ambient light, and let the sample incubate overnight at 4 °C. The sample can be kept in this condition for several days. Make sure that the humidity chamber remains moist if long storage is planned.
  8. Prior to imaging, gently place the coverglass cell side up onto a new 6-well plate containing 2 ml of PHEM buffer per well.
  9. Prepare oxygen-scavenged thiol-based imaging buffers using the following stock solutions: 1 M glucose, 1 M cysteamine, and 100x glucose oxidase/catalase enzyme mixture (4 mg of catalase and 10 mg of glucose oxidase in 100 µl of PHEM buffer, mixed well by vortexing)28. Right before imaging, mix 75 µl of 1 M glucose solution, 30 µl of 1 M cysteamine solution, and 3 µl of 100x stock enzyme mixture. Adjust the volume to 300 µl with PHEM buffer and use immediately after mixing to mount the sample.
  10. For iPALM, prepare the imaging sample using a pre-cleaned #1.5 coverglass (22-mm diameter).
    1. Alternatively, use a glass slide (3" x 1") with a double-sided adhesive spacer to aid in the assembly if astigmatism-based 3D-STORM12 is to be used instead.
    2. To assemble the imaging sample, use fine forceps to gently remove the specimen coverglass from the buffer well. Then, quickly and gently tap away excess buffer by touching the edge of the coverglass with folded absorbent paper.
    3. Place the coverglass cell side facing up on a piece of clean lens paper. Rinse the sample by placing 30 – 50 µl of imaging buffer onto the sample, and remove excess buffer by tilting and tapping with folded absorbent paper.
    4. Repeat the rinsing step a few times, and then place 30 – 50 µl of imaging buffer onto the sample. Blot dry the edge of the coverglass and place multiple very small dots of fast-curing epoxy onto the dried area.
    5. Slowly lower another pre-cleaned #1.5 coverglass (plain, round coverglass, 18-mm diameter) onto the center of the cell-containing 22-mm coverglass. Let the imaging buffer wet both coverglasses by capillary action. The small dots of fast-curing epoxy should adhere to both coverglasses.
    6. Gently press upon the assembled sample using folded absorbent paper to spread the pressure evenly. Use sufficient pressure to make the sample cell-thin and even (< 15 µm), but not so much as to crush the cells. Gauge the proper thickness by observing the Newton's rings pattern. Also, make sure to perform this step gently to minimize air bubbles. If needed, practice with empty coverglasses several times beforehand.
  11. Seal the sample with melted vaseline-lanolin-paraffin (VALAP, stock prepared from 100 g each of petroleum jelly, lanolin, and paraffin, melted together)29, rinse the sealed sample with ddH2O, and blow dry with compressed air. The sample is now ready for mounting onto the microscope for imaging.

2. Sample Placement and iPALM Alignment

  1. Move the spring-loaded top objective lens upward to allow for the removal of the sample holder. Place the sealed specimen prepared in step 1.10 onto the sample holder and secure with several small rare-earth magnets. Apply immersion oil on both sides of the imaging sample. Place the sample holder back into the optical path and gently lower the top objective lens.
  2. Turn on the excitation lasers. Turn on the Electron Multiplying Charge-Coupled Device (EMCCD) camera in frame-transfer mode.
    1. Rotate in the proper emission filters. Activate a mechanical shutter to block the top beam path (Figure 1A) and open the bottom beam path. Bring the bottom objective lens into focus by translation in small increments using the piezo actuator.
    2. Once the fiducial is in focus, open the top beam path while blocking the bottom beam path and bring the top objective lens into focus in a similar manner. Monitor the width of the fiducial on the computer display for optimal focus.
  3. For proper centration, open both the top and bottom beam paths. Manually adjust the top objective lens while the bottom objective is held constant using a pair of micro-fine set screws, until the fiducial images are overlapped as closely as possible, ideally within one pixel.
    1. Subsequently, perform fine adjustments so that the fiducial images in step 2.3 overlap within one tenth of an EMCCD pixel. Adjust the top 2-axis piezo-mounted mirrors via the control software while holding both objective lenses and the bottom reflection mirrors constant. Compare the centers of the fiducials of the top and the bottom objective views via the computer display to guide the process.

3. Calibration of the iPALM Setup

NOTE: Since fluorescence emission is incoherent, for interference to be observed in iPALM, the path lengths through the top and bottom objectives must be close to each other, within a few microns. This can be achieved as follows:

  1. With the lasers on, the cameras continuously streaming, and both the top and bottom beam paths open, oscillate the sample holder z-piezo using a sinusoidal voltage waveform generated by the control software for a continuous z-axis oscillation over a magnitude of 400 nm.
  2. Taking advantage of the fact that, when out of optimal alignment, the fiducial intensity varies little with the oscillation, manually translate the motorized beam splitter assembly up or down until the intensity of the fiducial oscillates due to the desired single-photon interference effect. This signifies the close matching of the optical path lengths. A peak-to-valley ratio of > 10 can be achieved in optimal cases (Figure 1D).
  3. To ensure that both the amplitude and phase at each surface are as uniform as possible across the field, adjust the bottom mirror of the beam splitter assembly in small steps to fine-tune the gap and the tilt angles. Perform beam splitter fine alignment by translating the sample in 8 nm z-steps over 800 nm.
    1. Monitor the fiducial intensity among cameras #1 – 3. Adjust the height, position, and tilt of the bottom mirror within the beam splitter assembly in small steps, such that the oscillation phase of camera #1 relative to camera #2 is maximized, ideally at 120° (Figure 1B-D).
    2. Once the initial alignment is complete, translate the sample to scan for a suitable field of view that contains both cells to image and multiple fiducials nearby. Place an enclosure around the system to block stray light and ambient perturbations. Once the imaging area is found, carry out the procedure in step 3.4 again, and record the calibration curve for use in subsequent z-coordinate extractions using the command "Acquire Calibration Scans vs Sample Piezo Position" in the main interface.

4. Data Acquisition

  1. Once a desired area is found and the calibration curve is obtained, enter the appropriate file names into the software. Open both the top and bottom beam paths. Increase the excitation power of the 642-nm laser to maximum. For Alexa Fluor 647, an initial period of fluorophore switching off may be needed (Figure 2A).
    1. Expose with a constant 642-nm excitation for 5 min, or longer if necessary, until single molecule blinking is observed (Figure 2B). The software allows an automatic increase of 405-nm photo activation during the course of the acquisition. Large numbers of acquisition frames are usually required for filamentous features to be clearly visible (> 50,000 frames). When ready, commence the acquisition of raw image sets using the command "Start iPALM Acquisition" in the main interface.
  2. During the acquisition, tune the photoactivation level by adjusting the intensity of the 405-nm laser to maintain the proper blinking density as needed (see examples in Figure 2B).
    NOTE: Once the acquisition is completed, the software will automatically convert the image files into the proper binary format. The data repository in the computation server is mounted as a networked drive, allowing data to be directly copied there for further processing.

5. Data Processing and Analysis

  1. Perform localization analysis using a custom-developed software to extract best-fit parameters for all single molecules as well as for the fiducials11,15,23. This yields not only the x,y-coordinate, but also the intensity that is used for calibration curve analysis.
    1. Import the raw calibration data acquired in step 3.5 using the command "Extract Peaks Multiple Labels" under the "File" menu to perform the single-molecule localization. Following the initial localization analysis, coordinates obtained from cameras #1 – 3 are present in red, green, and blue channels, respectively, and can be saved for further analysis using the command "Save Processed as IDL (.sav)" under the "File" menu.
  2. To bring data from cameras #1 – 3 into registration using the fluorescent fiducials embedded on the coverslips, select several bright fiducials to provide coverage of the central image (e.g., Figure 1B) using the command "Anchor Fiducial Points" under the "Image Transformations" menu. Use the triple sets of localization coordinates from cameras #1 – 3 obtained from the bright fiducials in step 5.1 to calculate the rotation and scaling matrix that will bring cameras #1 and #3 into register with camera #2. With a sufficiently large number of fiducials, higher-order polynomial warping can be performed for better fits.
  3. Once the transformation matrix is calculated, transform the raw data of cameras #1 – 3 together to obtain the summed raw data. Perform another round of localization analysis to yield a more precise x,y-coordinate and to determine the relative contribution of each camera channel to the summed raw data; use the command "Transform Raw, Save and Save Sum (.dat)" under the "Image Transformations" menu. This intensity ratio contains the z-coordinate information.
  4. Select a bright fiducial and perform z-calibration fitting using the function "Test Wind Point 3D" in the pop-up dialog by clicking "Z-coordinate Operations" under the "Special Functions" menu. This will fit 3-sinusoidal functions to the intensities of the 3 camera channels to determine the calibration curve. The calibration file is then saved for further use on the main datasets.
  5. To test the quality of the calibration curve, perform z-coordinate extraction, as described previously23. For well-behaved fiducials in a well-calibrated system, the z-coordinate should scale linearly, since the calibration datasets are taken with a linear sweep in z-position. Furthermore, the z-positions of all fiducials should scale with a similar slope.
  6. Once a satisfactory calibration is obtained, perform localization and transformation analysis for the raw image datasets acquired in step 4 following same procedure outlined in steps 5.1-5.3. When done, load the calibration file from step 5.4 and perform z-coordinate extraction using the functions "Pick WND File" and "Extract Z Coordinate" in the pop-up dialog by clicking "Z-coordinate Operations" under the "Special Functions" menu.
    NOTE: Since the acquisition time is > 15 min, mechanical drift is to be expected.
  7. To perform drift correction in x,y, select a bright fiducial from the localization coordinates. This fiducial should be present in all frames. Then, use the x,y-coordinate drift of the fiducial to align all other coordinates within the same frame back into registration (Figure 3A-B) using the function "Test/Write Guide Star" under the "Image Transformations" menu. Z-coordinate registration can be performed similarly by accessing the "Test Guide Star" and "Write Guide Star" functions in the pop-up dialog by clicking "Z-coordinate Operations" under the "Special Functions" menu.
  8. As the sample may exhibit slight tilt, perform tilt correction by providing the x,y,z-coordinates of 3 reference points defining the plane that should be set level using the function "Remove XYZ Tilt" in the pop-up dialog by clicking "Z-coordinate Operations" under the "Special Functions" menu.
  9. Subsequent to the drift and tilt corrections, save the localization coordinates. Reconstruct a super resolution image for further analysis (Figure 4A-D) by using the "Render" command on the main interface. Color can be used to indicate the z-coordinate. Alternatively, a side view of the selected area can also be rendered. The localization coordinates can be exported as text files for further quantification, or the reconstructed image can be saved as a .tif file.

Representative Results

Critical requirements for iPALM are the alignment, registration, and calibration of the optical systems. These are necessary to ensure proper interference within the 3-way beam splitter requisite for z-coordinate extraction. To enable continuous monitoring, constant point sources of fluorescence are necessary. This can be achieved using fluorescent Au or bi-metallic nanoparticles23 whose photoluminescence arise from localized surface plasmon resonance (LSPR). They act as a stable single dipole upon illumination and can typically be localized with 5 – 10 nm accuracy. These commercially available nanoparticles emit a level of brightness within the range of most single-molecule fluorophores, such that both the fluorophores and the fiducials can be imaged with similar excitation intensities and gain settings on the EMCCD cameras, without saturation (Figure 1B). Furthermore, these fiducials also greatly facilitate focusing, whereby the apparent width of the fiducials can be monitored during the focus adjustment. Also, stringent cleaning of the coverglass surface, such as by Piranha etching or plasma cleaning, is also required, since spurious background fluorescence of uncleaned or poorly cleaned coverglasses can easily overwhelm single-molecule signals, as described earlier.

iPALM relies on multiphase interferometry to enable high-precision z-coordinate measurement simultaneously with PALM (for x,y). In the iPALM instrument, each emitted fluorescence photon can be considered to propagate through both optical paths, which then self-interfere in a custom-fabricated 3-way beam splitter. The z-coordinate is thus encoded in the phase of the interfered photon. The mutual phase differences of ~ 120° of the output beams from the 3-way beam splitter result in the intensity variation of the single-molecule images between the 3 cameras, allowing zcoordinate extraction from a calibration curve. Based on this, the iPALM sample holder assembly is an essential component, since it is equipped with a pair of piezoelectric actuators that allow nm-precision translation in z that can be used for alignment and calibration.

At the proper focus and alignment, the translation of the sample along the z-axis will generate an interference effect. This is manifested as the oscillation of the fiducial intensity between the three camera channels (Figure 1C-D). These oscillations also indicate that both the top and bottom optical beam paths are nearly matched, allowing single-photon interference. Usually, upon turning on the instrument, the initial phases of each camera will not be optimal and the scan of z-position is needed as a diagnostic tool for calibration and alignment. To arrive at the optimal phases, the bottom mirror of the beam splitter (Figure 1A) can be adjusted using the piezoelectric tip-tilt stage. The calibration scan of z-position is taken after each small 10 – 20 nm adjustment. The intensity of the fiducial in each channel is then determined by localization analysis (i.e., fitting with a 2D-Gaussian function). The intensity normalized by total intensity can be approximated by a sinusoidal waveform, allowing the phase term to be calculated; thus, the phase corresponding to each camera can be determined, as seen in Figure 1C. We note that the single-photon interference principle used in iPALM can also be demonstrated using a much simpler 2-way beam splitter. However, a 2-way beam splitter is impractical for 3D super resolution microscopy since at or near the limit of destructive interference, the signal in one channel is minimal, resulting in noisy estimates of intensity and localization coordinates, which effectively restrict the z-coordinate determination to the range where both cameras have substantial intensity (< 100 nm). The minimum number of channels needed to overcome this effect is three, and 3- and 4-way projection systems have been described in the literature11,30.

Under optimal conditions, for a 3-way beam splitter, the phase differences between the 3 cameras should be about 120°. The 3-way beam splitter for iPALM contains 3 reflective interfaces, as diagrammed in Figure 1A. The beam splitter is positioned above a flat dielectric mirror, with a thin gap filled with refractive index-matching oil, to allow fine adjustment of path lengths within the beam splitter and to achieve optimal phase differences. As shown in Figure 1C-D, at the proper alignment for iPALM, the cameras are close to a 120° mutual phase difference. In practice, a phase difference greater than 105° is generally acceptable. Such calibration both indicates that the system is well aligned and that it will be used for subsequent z-coordinate extraction. It is also helpful to evaluate the calibration curve generated using different fiducials. Most fiducials with moderate brightness generally emit as a single dipole, yielding well-behaved calibration curves. However, occasional aggregates of fiducials (often those with extreme brightness) may behave in an anomalous manner, yielding unreliable calibration curves. It is also advisable to choose fiducials near the center of the imaging field and near the area of biological interest (Figure 1B), particularly since the high NA objectives lens used in the iPALM setup is not flat-field corrected. The effective field-of-view is limited to the central area, apparent from the greater fiducial widths toward the edge of the field.

Subsequent to the initial alignment, the fields-of-view containing cells with desirable morphology and multiple fiducials to ensure good calibration are chosen for imaging. This can be achieved by slowly translating the sample holder using 2-axis servomotor drives. Translation of the sample will result in some defocusing, since the sample is not always perfectly flat. Therefore, focus must be continually adjusted during the translation. Once the imaging field has been chosen, another round of calibration to optimize the calibration curve is then carried out to fine-tune the system alignment and to obtain the actual calibration curve. Importantly, areas under the nucleus or near regions with heterogeneous refractive index (e.g., air bubbles) should be avoided in general, since these will cause significant alteration of the relative path lengths, distorting the z-coordinate.

With high density labeling, fluorescence signals from organic fluorophores such as Alexa Fluor 647 can be extremely bright. As shown in Figure 2A, with the proper buffer preparation containing a high concentration of thiol (-SH) groups31, the fluorophore should be rapidly switched off under high excitation illumination. This results in the suppression of the fluorescence signals from the majority of the molecules. At a given instance, a very small minority of fluorophores stochastically return to the "on" state. These are expected to be sparsely distributed and thus can be visualized as single molecules for one or a few frames before switching "off." The photoswitching dynamics are strongly dependent upon the excitation intensity and the concentration of -SH, and thus, for a given system, care must be taken to optimize the proper labeling density, particularly since a relatively high excitation intensity (640 – 647 nm) is needed to switch off a majority of Alexa Fluor 647 molecules. If the excitation is not sufficiently strong, a significant fraction of Alex Fluor 647 will remain in the "on" state, resulting in high background, difficulties in observing single molecule fluorescence, and, ultimately, poor quality single-molecule localization results. Under a properly balanced condition, single-molecule raw data should contain a sufficiently large number of molecules (hundreds) per frame (Figure 2B), while each molecule is sparse enough to allow unambiguous detection and localization analysis. It is also worth noting that for iPALM, the principles of photoswitching are identical to those of PALM or STORM, and thus, samples properly prepared for iPALM can be directly used on the simpler 3D-PALM or 3D-STORM systems. To acquire a high enough density of molecules to satisfy Nyquist sampling, usually 50,000 or more frames of raw data are required (i.e., 150,000 total frames for the 3 cameras). As the acquisition progresses, an increasing fraction of fluorophores could be depleted by destructive photobleaching, resulting in sparser single molecule density. To compensate for this, brief pulses of 405 nm blue light (405 nm) can be illuminated onto the sample at intervals to promote fluorophore activation.

Due to the long acquisition time required, optimal results for iPALM (or single-molecule localization microscopy in general) require low sample drift and/or good drift correction. For example, using the exposure time of 50 msec in frame transfer mode (20 Hz frame rate), the total acquisition time for 50,000 frames is 42 min. During this period, mechanical drift over tens of nm is expected. Indeed, in addition to the high localization precision and high labeling density, the resolution also depends on drift correction quality. There are multiple origins to these drifts with thermal fluctuation being a major cause. Due to this consideration, where possible, iPALM parts are custom-machined using Invar, a low thermal expansion alloy, or stainless steel, both of which have much lower thermal expansion characteristics than brass or aluminum. Unfortunately, this also imposes additional cost relative to aluminum, which is a more commonly used metal for optomechanical components, being much cheaper and easier to machine. Other sources of drift can be mechanical vibrations from peripheral equipment, ambient environments, or air currents. These should be minimized by placing the system in a suitable enclosure and by redirecting the air flow direction in the microscope area. The setup should be built on a research-grade optical table and, if possible, fan-containing components should be placed off the optical table. Nevertheless, despite all precautions, some amount of drift will remain. Critically, these drifts must be minimized such that the image remains in focus throughout the acquisition time. In our systems, these passive methods suffice to minimize drift to acceptable levels. However, it should be possible to implement active drift compensation methods to enable long-term and high precision imaging32.

Following the processing of the raw data, 3D localization coordinates can be obtained with typically 5 – 10 million single-molecule peaks per dataset. As shown in Figure 3, the drift as a function of time can be visualized from the localization coordinates of the fiducials. Multiple fiducials can be used to calculate the average drift correction trajectory (Figure 3A-B). Also, it is customary to filter out peaks that fit poorly to the 2D-Gaussian function during localization analysis. This could be due to spurious noises or partially overlapping single-molecule peaks and can be differentiated by the large residual square error calculated during the fitting process. Peaks with low brightness (as indicated by the photon count) and, thus, higher uncertainty (i.e., larger than ~ 25 nm) are also filtered out, as these likely arise from non-specific background fluorescence. Similarly, peaks for which the intensities from the 3 camera channels fit poorly to the calibration curve are also rejected, as the z-coordinates obtained are unreliable. It should be noted that the full information content of iPALM (and localization microscopy in general) is massive, since the analysis results not only in the fluorophore coordinates, but also in several additional parameters such as intensity, width, brightness, etc. However, in practice, since relatively few computational tools are currently available for analysis in the coordinate space, localization coordinates are typically rendered or reconstructed into pixel-based images for further analysis.

The commonly used approach for iPALM image reconstruction is to represent each localization coordinate with a normalized 2D Gaussian function, with the localization uncertainty set as the Gaussian width33. Thus, the high-precision coordinates (typically single-molecule peaks with high brightness against low background) appear as sharp and narrow peaks, while the low-precision coordinates (typically low brightness or high background single-molecule peaks) appear as dimmer and broader peaks. In this manner, each molecule contributes the same amount of intensity to the image. For a 3D data set, the z-coordinate can be represented using color, typically based on a hue scale (Figure 4C-D). Alternatively, the images can be shown as a side view (x,z or y,z) projection or as volumes. A number of publicly available software can be used to visualize such data34.

As shown in Figures 4-6, iPALM images yield a significant improvement over diffraction-limited fluorescence microscopy. The f-actin architecture in HUVEC cells can be visualized with much enhanced spatial resolution. In regions of the cortex, networks of distinct filaments can be seen, whereas in stress fibers, bundles, and lamellipodia, the densely packed f-actin networks are observed to have a filamentous texture, although individual filaments are not distinguishable. This is likely due to the limitations in both the brightness of the fluorophores and the localization precision. The presence of distinct cortical filaments suggests that the ultrastructure of the f-actin network is sufficiently well-preserved; thus, iPALM could be a useful tool for characterizing the cortical architecture. In Figure 5, a sub-region of a HUVEC cell is displayed with the profiles of an actin filament quantified. It can be seen that the z-histogram of a filament is about 15 nm in width, relatively small compared to ~ 45 nm for the transverse (x,y) view, showing that iPALM yields a significant resolution improvement in z-resolution relative to the x,y-plane, as expected. However, since the actual diameter of f-actin is ~8 nm, it is unclear whether the observed filament is a single filament or a bundle of a few filaments. Correlative imaging using iPALM and EM could be a useful strategy for further characterization of f-actin architecture, though this approach has not been applied to study f-actin yet23.

Figure 1
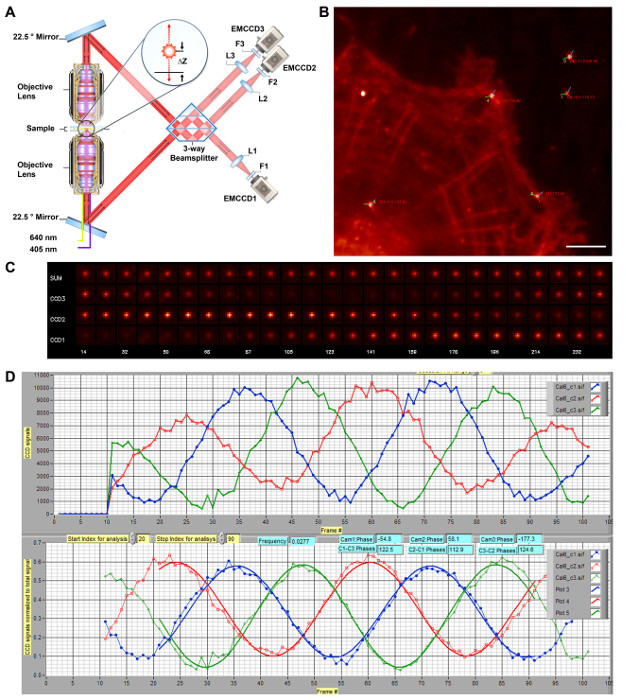
Figure 1: Schematic Diagram of iPALM 3-D Super Resolution Microscopy. A) Schematics of iPALM optics. The dual objective lenses (Nikon, NA 1.49 60X) allow each emitted fluorescence photon to propagate through both the top and bottom optical beam paths, and they are redirected to interfere in the beam splitter by a pair of mirrors oriented at 22.5°. The phase of the self-interfered photon is directly proportional to δZ, thus encoding the z-coordinate of the fluorophore, and can be measured using a 3-way beam splitter with mutual phase differences of ~120° between the three output beams. They are focused by the tube lenses (L1-L3, f = 400 nm) and filtered by emission filter (F1 – F3). Each single molecule therefore appears with different intensities between cameras (EMCCD1-3) but at similar x,y-coordinates. (A) is reproduced and modified from Ref. 11. (B) Diffraction-limited image of HUVEC cells labeled for f-actin with Alexa Fluor 647. Bright spots denote Au nanoparticle fiducials. The phase angles for cameras #1 – 3 are represented by red, green, and blue lines, respectively, centered on each fiducial, with the phase difference between cameras #1 – 3 indicated. Scale bar: 5 µm. (C) Fiducial images showing the interferometric effects. Images of an Au nanoparticle fiducial for each camera (CCD1-3) or total (sum), taken as the z-position (in nm, on bottom row) is scanned for the calibration. The intensity within each camera can be seen to oscillate with a phase relationship, as shown in (B). (D) iPALM calibration curve. The sample is translated along the z-axis. The intensities of an Au nanoparticle fiducial for the EMCCD1-3 are show as red, green, and blue lines, respectively (top). These are then normalized and fit to determine the phase differences (bottom). During alignment, the system is adjusted to achieve the maximal phase differences between all three cameras. The calibration curve is taken at each imaging site to use in the extraction of the z-coordinate of each single molecule. Please click here to view a larger version of this figure.

Figure 2
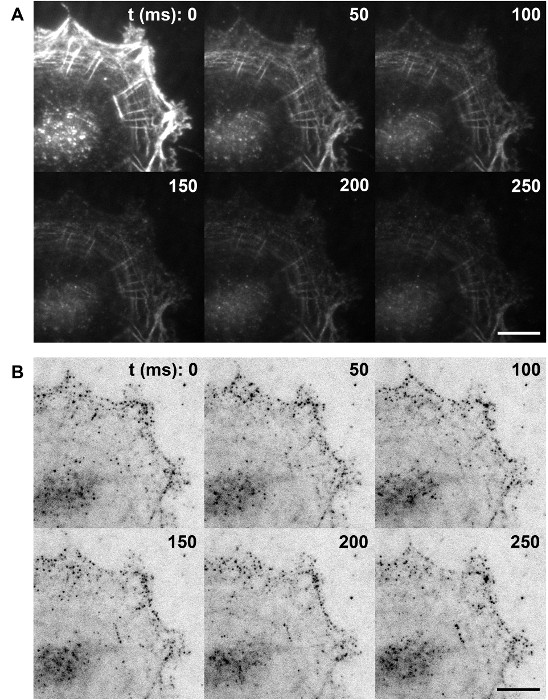
Figure 2: Single Molecule Imaging of Photoswitching Alexa Fluor 647-phalloidin as Actin Labels. (A) Initial photoswitching step. F-actin in fixed cells is labeled at a high density by phalloidin conjugated to Alexa Fluor 647. High intensity illumination in a thiol-containing image buffer results in rapid switch-off of most fluorophores. (B) Representative frames of raw single-molecule frames. At steady-state blinking, the activated Alexa Fluor 647 should be sufficiently sparse that individual single molecules appear as a PSF-sized spot. Images of the same cells shown in (A), shown with inverse contrast. Scale bars in A and B: 5 µm. Please click here to view a larger version of this figure.

Figure 3
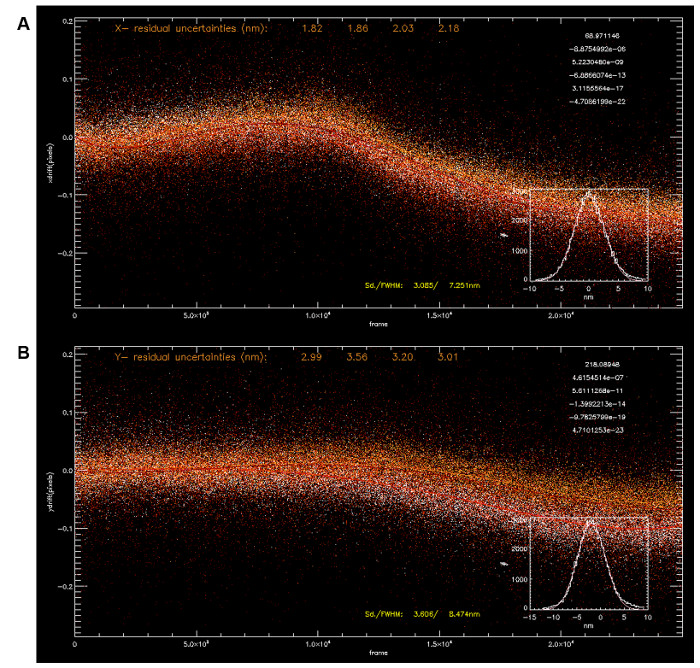
Figure 3: Drift Correction using Multiple Fiducials. Localization coordinates for four fiducials (A, x-coordinate; B, y-coordinate) were used to calculate drift using polynomial fittings (5th order, fit parameters on top right corner). The average drift trajectory allows correction of drift with sub-5 nm precision (x: 3.085 nm, y: 3.606 nm). Please click here to view a larger version of this figure.

Figure 4
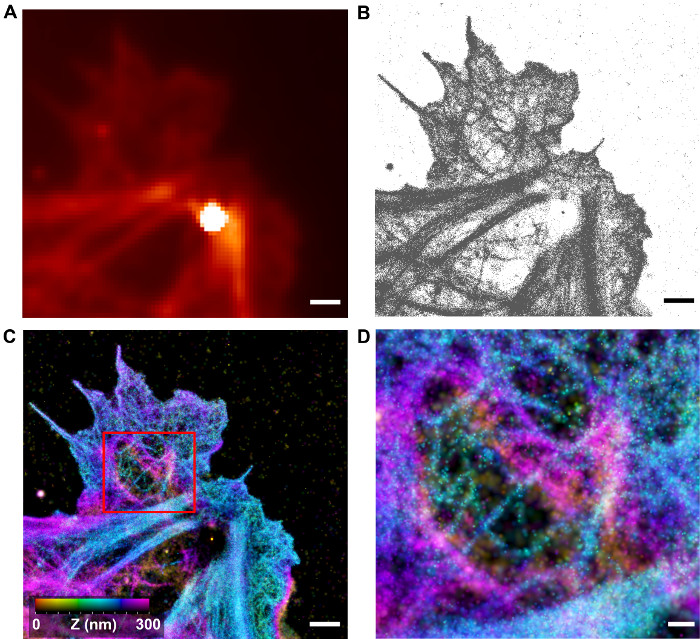
Figure 4: Visualization of 3-D f-actin Architecture by iPALM. (A) Diffraction-limited image of HUVEC cells with f-actin labeled by Alexa Fluor 647-phalloidin (corresponding to subareas of the cell in Figure 2). The bright spot is due to the Au nanoparticle fiducials. (B) Localization coordinates determined by iPALM analysis for the area in (A). (C) Reconstructed iPALM image, with each localization coordinate rendered by a 2D-Gaussian with the width corresponding to localization uncertainty. The z-coordinate is colored according to the color bar. Areas of dense and sparse filamentous features can be seen. Scale bars (A-C): 1 µm. (D) Zoom-in view of boxed area in C showing filamentous cortical actin topology. Scale bar: 250 nm. Please click here to view a larger version of this figure.

Figure 5
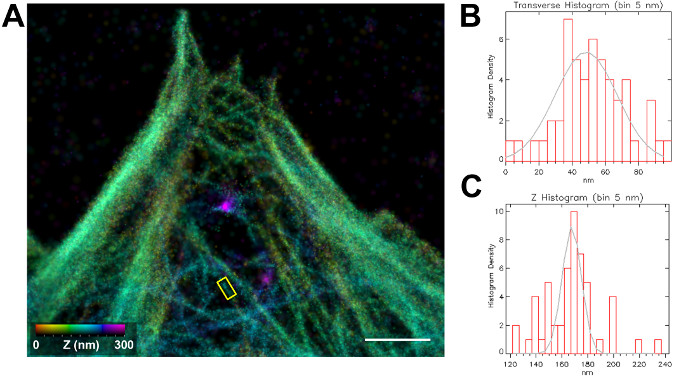
Figure 5: Nanoscale Dimension of f-actin Visualized by iPALM. (A) Reconstructed iPALM image HUVEC cells with f-actin labeled by Alexa Fluor 647-phalloidin. The color indicates the z-coordinate according to the color bar. Scale bar: 1 µm. (B) Transverse cross-section histogram of x,y-localization coordinates along the long axis of the boxed area in (A). To obtain the histogram, the coordinates are projected onto the long axis of the box and binned with a 5-nm bin-size. The gray curve indicates a Gaussian best fit to the histogram, with a full width at half maximum (FWHM) of 43.88 nm. (C) Histogram of the z-position of localization coordinates in the boxed area in (A). The z-positions are binned with a bin size of 1 nm. The gray curve indicates a Gaussian best fit to the histogram, with a FWHM of 17.50 nm. Please click here to view a larger version of this figure.

Figure 6
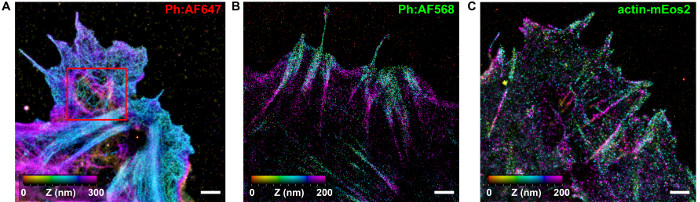
Figure 6: Comparison of iPALM Imaging of f-actin Using Different Labeling Reagents. Reconstructed iPALM images of f-actin labeled using Alexa Fluor 647-conjugated phalloidin (A), Alexa Fluor 568-conjugated phalloidin (B), or by transfection with actin-mEos2 fusion protein expression vector (C). Scale bars (A-C): 1 µm. Please click here to view a larger version of this figure.

Discussion

The optical system of iPALM is based on a 4-π dual-opposed objective design, as shown in Figure 1A. The setup is constructed using both custom-machined and commercial opto-mechanical parts, as described earlier23 and listed in Table 1. In addition to our setup, the Howard Hughes Medical Institute (HHMI) hosts a system that is accessible to the scientific community at the Advanced Imaging Center at the Janelia Research Campus. For the full mechanical drawings, control schematics, and software, readers are encouraged to inquire with Harald Hess at HHMI for further information. A primary advantage for using iPALM as well as other single-molecule localization microscopy methods for visualizing f-actin is the relative ease of sample preparation compared to EM techniques, which generally require harsh sample processing, laborious preparation, and highly skilled practitioners3,23. Additionally, fluorescence is naturally amenable to multichannel imaging, which remains difficult for EM. Nevertheless, as described further below, there are several current limitations for the approach, both in terms of specimen preparation and imaging process. First, as is the case for EM sample preparation, care must be taken to ensure good ultrastructural preservation of the specimens35, since a protocol adequate for a diffraction-limited level of resolution can cause severe perturbations at the nanoscale level. For actin imaging, proper fixation of the cells is an important factor affecting specimen quality. Glutaraldehyde is a preferred fixative since it preserves the cytoskeleton and membrane very well, though in cases of co-staining with antibody, epitope sites could be affected. In such cases, paraformaldehyde may offer an acceptable compromise, as it tends to better preserve antibody epitope sites. Importantly for single-molecule localization microscopy, these fixatives tend to generate background autofluorescence; thus, post-fixation quenching by borohydride is necessary, particularly in the case of glutaraldehyde.

Additionally, the proper selection of fluorophores and labeling strategies are among the most important factors for successful experiments. Due to the nanoscale dimension of f-actin, high densities of labels are required to capture the underlying filamentous networks, as stipulated by the Nyquist sampling theorem36. For actin, phalloidin allows very high density labeling, with a wide range of organic fluorophores available from many manufacturers. However, since phalloidin is toxic, cell fixation and permeabilization is required. Alternative strategies for live-cell compatible actin labeling include using fusion of fluorescent proteins (FP), either with monomeric actin or with small actin-binding polypeptides. However, we found that these tend to yield a lower labeling density compared to phalloidin (Figure 6). We note that purified actin can also be directly labeled with organic fluorophores and introduced into living cells by electroporation37, but this approach is expected to be costly and labor-intensive. In terms of the fluorophores, Alexa Fluor 647 has generally been found to offer consistently good performance for localization microscopy. This can be described in terms of the contrast ratio-the brightness quotient between the single molecule peak and the background fluorescence38. A higher labeling density requires a higher contrast ratio, since the background could cumulatively degrade the localization precision. In our experience, several other fluorophores, such as ATTO488, ATTO520, and Alexa Fluor 568 (Figure 6B), can be used to visualize the f-actin, although with less consistent results compared to Alexa Fluor 647, which offers robust photoswitching performance across a wide range of imaging buffer conditions.

In terms of the imaging process, limitations in biological imaging methods have often been conceptualized as a trade-off in spatial resolution, temporal resolution, and imaging range (both field-of-view/depth-of-field and duration)39. This equally applies to the advantages and limitations of iPALM. Compared to other 3-dimensional super resolution microscopy techniques, iPALM has remained the highest-resolving optical approach to date, particularly along the z-axis, with the z-resolution nearly 2 times better than the x,y-resolution11. However, the reliance of iPALM on interferometry for a high z-resolution also imposes a restriction on the imaging depth, since the calibration curve is periodic. In other words, z-coordinates repeat every 250 nm or so (for ~ 700 nm emission wavelengths of Alexa Fluor 647). In practice, this can be addressed by using TIRF illumination, which limits the excitation zone to within the evanescent field depth of < 200 nm from the coverglass. Thus, fluorophores deeper into the specimen are not excited and remain invisible. However, this also limits the biological structures that can be imaged to those in close proximity to the coverglass, such as focal adhesions, cortical cytoskeleton, and ventral plasma membrane, while more interior structures are out of reach. For fixed specimen, one remedy is to perform cryosectioning40. However, such an approach is highly laborious and requires specialized expertise that is not commonly accessible.

Alternatively, iPALM can be adapted for an extended z-range by combining interferometry with the astigmatic-defocusing scheme12 used in 3D-STORM. This approach provides dual z-coordinate readouts, the first by interferometry, which is high-precision but periodic, and the second by astigmatic defocusing, which is less precise but non-periodic. The latter can then be used to "unwrap" or break the degeneracy of the interferometric z-coordinates, thus enabling the tripling of the iPALM imaging depth to ~750 nm, effectively approaching the intrinsic focal depth of high NA objective lenses. With phase unwrapping, iPALM has been used to image structures deep within the samples, such as mitochondria, albeit with slightly reduced precision in all 3 dimensions due to the additional defocusing40.

Another intrinsic limitation of iPALM is the imaging speed. Since large numbers of frames are required to obtain a high density of localization coordinates, the camera speed is usually the limit on the acquisition rate. With current EMCCD cameras running at 10 – 20 MHz readout rates, tens of minutes are required for a sufficient number of frames. Such long time scales require that the specimen be fixed. Here, recent advances in camera technology, such as the much faster scientific Complementary Metal Oxide Semiconductor (sCMOS) camera, may enable a rapid increase in imaging speed41, although this has not been implemented for iPALM yet. For some single-molecule localization microscopy approaches, a dense single-molecule field can be analyzed using a modified algorithm42 or compressed sensing43. The adaptation of such strategies may also speed up iPALM by allowing denser single-molecule images and, hence, fewer frames.

With limitations in speed and imaging range and strengths in spatial resolution, a major application for iPALM is as an ultrastructural method that leverages the benefits of fluorescent labeling to unveil nanoscale organization of specific proteins14,15,44. Further improvement, both in terms of optics and fluorophore technologies, should enable further enhancement in iPALM spatial resolution. For example, iPALM image processing currently employs a relatively simple first-order approximation approach, with each single molecule modeled by a 2D-Gaussian function and assumed to be an isotopically averaged dipole. This could be augmented with recent methods, which employ a more accurate model of the point-spread function and dipole orientation, or explicit treatment of optical aberrations across the field of view to significantly improve spatial resolution. Likewise, photocaging has been reported, which enhances fluorophore brightness by orders of magnitude45. Indeed, since key elements of their ultrastructural organization have been well-characterized, the f-actin cytoskeleton could be a highly valuable model system for testing further methodological developments in iPALM. The ability to analyze protein organization by light microscopy with true EM-level resolving power is expected to greatly enhance our understanding of myriad aspects of cellular structure and function.

Divulgazioni

The authors have nothing to disclose.

Acknowledgements

YW and PK gratefully acknowledge funding support from the Singapore National Research Foundation, awarded to PK (NRF-NRFF-2011-04 and NRF2012NRF-CRP001-084). We also thank the MBI open lab and microscopy core facilities for infrastructure support.

Materials

optical table Newport, CA  RS4000 iPALM, installed on 4 Newport Stabilizer vibration isolators 
vibration isolator for optical table Newport, CA  S-2000 
laser-642 Newport, CA  1185055 output power=100mw
laser-561 Newport, CA  1168931 output power=200mw
laser-488 Newport, CA  1137970 output power=200mw
laser-405 Newport, CA  1142279 output power=100mw
broadband dielectric mirrors  Thorlabs, NJ BB1-E02 laser combiner
dichroic beamsplitter  Semrock, NY LM01-427-25
acousto-optic tunable filter  AA Opto-Electronic, France AOTFnC-VIS-TN
Linear polarizer Newport, CA  05LP-VIS-B
baseplate local workshop customized
turning mirror (22.5°) Reynard Corpporation, CA customized 22.5° mirror
motorized optic mounts  New Focus, CA 8816
motorized XYZ translation stage Thorlabs, NJ MT3/M-Z6 sample holder
T-Cube DC servo motor controller Thorlabs, NJ TDC001
Piezo Phase Shifter Physik Instrumente, Germany S-303.CD
objective lens Nikon, Japan MRD01691 objective. Apo TIRF 60X/1.49oil
translation stage New Focus, CA 9062-COM-M
Pico Motor Actuator New Focus, CA 8301
rotary Solenoid/Shutter DACO Instruments, CT 5423-458
3-way beam splitter Rocky Mountain Instruments, CO customized beamsplitter
Piezo Z/Tip/Tilt scanner Physik Instrumente, Germany S-316.10
motorized five-axis tilt aligner  New Focus, CA 8081
Picmotor ethernet controller New Focus, CA 8752
Piezo controllers/amplifier/digital operation module Physik Instrumente, Germany E-509/E-503/E-517
band-pass filter Semrock, NY FF01-523/20 filters
band-pass filter Semrock, NY FF01-588/21
band-pass filter Semrock, NY FF01-607/30
band-pass filter Semrock, NY FF01-676/37
notch filter Semrock, NY NF01-405/488/561/635
motorized filter wheel with controllter Thorlabs, NJ FW103H
EMCCD Andor, UK  DU-897U-CSO-#BV 3 sets
Desktop computers for controlling cameras and synchronization Dell Precision T3500 PC, 4 sets
coverslips with fiducial Hestzig, VA 600-100AuF sample preparation. fiducial marks with various density and spectra  available
fibronectin  Millipore, MT FC010
paraformaldehyde Electron Microscopy Sciences, PA 15710 fixation. 16%
glutaraldehyde  Electron Microscopy Sciences, PA 16220 25%
triton X-100 Sigma aldrich, MO T8787
HUVEC cells Life Technologies, CA C-015-10C
Medium 200 Life Technologies, CA M-200-500
Large Vessel Endothelial Factors Life Technologies, CA A14608-01
Dulbecco's Phosphate Buffered Saline 14190367
Pennicillin/Streptomycin 15140122
Trypsin/EDTA Life Technologies, CA 25200056
PIPES Sigma aldrich, MO P1851 PHEM
HEPES 1st base, Malaysia BIO-1825
EGTA Sigma aldrich, MO E3889
MgCl2 Millipore, MT 5985
 Alexa Fluor 647 Phalloidin Invitrogen, CA A22287 staining
sodium borohydride (NaBH4)  Sigma aldrich, MO 480886 quenching
glucose 1st base, Malaysia BIO-1101 imaging buffer
glucose oxidase Sigma aldrich, MO G2133
catalase Sigma aldrich, MO C9322
cysteamine  Sigma aldrich, MO 30070
Epoxy Thorlabs, NJ G14250
vaseline Sigma aldrich, MO 16415 sample sealing
lanolin Sigma aldrich, MO L7387
parafin wax Sigma aldrich, MO 327204
Immersion oil  Electron Microscopy Sciences, PA 16915-04 imaging. Cargille Type HF

Riferimenti

  1. Kanchanawong, P., Waterman, C. M. Localization-based super-resolution imaging of cellular structures. Methods Mol Biol. 1046, 59-84 (2013).
  2. Bertocchi, C., Goh, W. I., Zhang, Z., Kanchanawong, P. Nanoscale imaging by super resolution fluorescence microscopy and its emerging applications in biomedical research. Crit Rev Biomed Eng. 41, 281-308 (2013).
  3. Kanchanawong, P., Waterman, C. M. Advances in light-based imaging of three-dimensional cellular ultrastructure. Curr Opin Cell Biol. 24, 125-133 (2012).
  4. Betzig, E., et al. Imaging intracellular fluorescent proteins at nanometer resolution. Science. 313, 1642-1645 (2006).
  5. Hess, S. T., Girirajan, T. P., Mason, M. D. Ultra-high resolution imaging by fluorescence photoactivation localization microscopy. Biophys J. 91, 4258-4272 (2006).
  6. Rust, M. J., Bates, M., Zhuang, X. Sub-diffraction-limit imaging by stochastic optical reconstruction microscopy (STORM). Nat Methods. 3, 793-795 (2006).
  7. Heilemann, M., et al. Subdiffraction-resolution fluorescence imaging with conventional fluorescent probes. Angew Chem Int Edit. 47, 6172-6176 (2008).
  8. Sharonov, A., Hochstrasser, R. M. Wide-field subdiffraction imaging by accumulated binding of diffusing probes. P Natl Acad Sci USA. 103, 18911-18916 (2006).
  9. Fölling, J., Bossi, M., Bock, H., Medda, R., Wurm, C. A., Hein, B., Jakobs, S., Eggeling, C., Hell, S. W. Fluorescence nanoscopy by ground-state depletion and single-molecule return. Nat Methods. 5, 943-945 (2008).
  10. Biteen, J., et al. Single-moldecule active-control microscopy (SMACM) with photo-reactivable EYFP for imaging biophysical processes in live cells. Nat Methods. 5, 947-949 (2008).
  11. Shtengel, G., et al. Interferometric fluorescent super-resolution microscopy resolves 3D cellular ultrastructure. P Natl Acad Sci USA. 106, 3125-3130 (2009).
  12. Huang, B., Wang, W., Bates, M., Zhuang, X. Three-dimensional super-resolution imaging by stochastic optical reconstruction microscopy. Science. 319, 810-813 (2008).
  13. Dani, A., Huang, B., Bergan, J., Dulac, C., Zhuang, X. Super resolution imaging of chemical synapses in the brain. Neuron. 68, 843-856 (2010).
  14. Liu, J., et al. Talin determines the nanoscale architecture of focal adhesions. P Natl Acad Sci USA. 112 (35), E4864-E4873 (2015).
  15. Kanchanawong, P., et al. Nanoscale architecture of integrin-based cell adhesions. Nature. 468, 580-584 (2010).
  16. Wu, Y., Kanchanawong, P., Zaidel-Bar, R. Actin-delimited adhesion-independent clustering of e-cadherin forms the nanoscale building blocks of adherens junctions. Dev Cell. 32 (2), 139-154 (2015).
  17. Szymborska, A., et al. Nuclear Pore Scaffold Structure Analyzed by Super-Resolution Microscopy and Particle Averaging. Science. 341, 655-658 (2013).
  18. Lawo, S., Hasegan, M., Gupta, G. D., Pelletier, L. Subdiffraction imaging of centrosomes reveals higher-order organizational features of pericentriolar material. Nat Cell Biol. 14, 1148-1158 (2012).
  19. Mennella, V., Agard, D. A., Huang, B., Pelletier, L. Amorphous no more: subdiffraction view of the pericentriolar material architecture. Trends Cell Biol. 24, 188-197 (2014).
  20. Mennella, V., et al. Subdiffraction-resolution fluorescence microscopy reveals a domain of the centrosome critical for pericentriolar material organization. Nat Cell Biology. 14, 1159-1168 (2012).
  21. Fletcher, D. A., Mullins, R. D. Cell mechanics and the cytoskeleton. Nature. 463, 485-492 (2010).
  22. Salbreux, G., Charras, G., Paluch, E. Actin cortex mechanics and cellular morphogenesis. Trends Cell Biol. 22, 536-545 (2012).
  23. Shtengel, G., et al. Imaging cellular ultrastructure by PALM, iPALM, and correlative iPALM-EM. Method Cell Biol. 123, 273-294 (2014).
  24. Juette, M. F., et al. Three-dimensional sub-100 nm resolution fluorescence microscopy of thick samples. Nat Methods. 5, 527-529 (2008).
  25. Lippincott-Schwartz, J., Patterson, G. H. Photoactivatable fluorescent proteins for diffraction-limited and super-resolution imaging. Trends Cell Biol. 19, 555-565 (2009).
  26. Shannon, C. Communication in the presence of noise. Proc. IRE. 37, 10-21 (1949).
  27. Good, N. E., et al. Hydrogen ion buffers for biological research. Biochimica. 5, 467-477 (1966).
  28. Aitken, C. E., Marshall, R. A., Puglisi, J. D. An oxygen scavenging system for improvement of dye stability in single-molecule fluorescence experiments. Biophys J. 94, 1826-1835 (2008).
  29. Shin, W. D., Goldman, R. D., Swedlow, J. R., Spector, D. L., et al. . Live Cell Imaging: A Laboratory Manual. , (2010).
  30. Aquino, D., et al. Two-color nanoscopy of three-dimensional volumes by 4Pi detection of stochastically switched fluorophores. Nat Methods. 8, 353-359 (2011).
  31. Dempsey, G. T., Vaughan, J. C., Chen, K. H., Bates, M., Zhuang, X. Evaluation of fluorophores for optimal performance in localization-based super-resolution imaging. Nat Methods. 8, 1027-1036 (2011).
  32. Pertsinidis, A., Zhang, Y., Chu, S. Subnanometre single-molecule localization, registration and distance measurements. Nature. 466, 647-651 (2010).
  33. Baddeley, D., Cannell, M. B., Soeller, C. Visualization of Localization Microscopy Data. Microsc Microanal. 16, 64-72 (2010).
  34. El Beheiry, M., Dahan, M. ViSP: representing single-particle localizations in three dimensions. Nat Methods. 10, 689-690 (2013).
  35. Schnell, U., Dijk, F., Sjollema, K. A., Giepmans, B. N. Immunolabeling artifacts and the need for live-cell imaging. Nat Methods. 9, 152-158 (2012).
  36. Shroff, H., Galbraith, C. G., Galbraith, J. A., Betzig, E. Live-cell photoactivated localization microscopy of nanoscale adhesion dynamics. Nat Methods. 5, 417-423 (2008).
  37. Yamashiro, S., et al. New single-molecule speckle microscopy reveals modification of the retrograde actin flow by focal adhesions at nanometer scales. Mol Biol Cell. 25, 1010-1024 (2014).
  38. Shroff, H., et al. Dual-color super resolution imaging of genetically expressed probes within individual adhesion complexes. P Natl Acad Sci USA. 104, 20308-20313 (2007).
  39. Chen, B. C., et al. Lattice light-sheet microscopy: imaging molecules to embryos at high spatiotemporal resolution. Science. 346, (2014).
  40. Brown, T. A., et al. Super resolution fluorescence imaging of mitochondrial nucleoids reveals their spatial range, limits, and membrane interaction. Mol Cell Biol. 31, 4994-5010 (2011).
  41. Huang, F., et al. Video-rate nanoscopy using sCMOS camera-specific single-molecule localization algorithms. Nat Methods. 10, 653-658 (2013).
  42. Daostorm, S. DAOSTORM: an algorithm for high-density super-resolution microscopy. Nat methods. 8, 279 (2011).
  43. Zhu, L., Zhang, W., Elnatan, D., Huang, B. Faster STORM using compressed sensing. Nat Methods. 9, 721-723 (2012).
  44. Van Engelenburg, S. B., et al. Distribution of ESCRT machinery at HIV assembly sites reveals virus scaffolding of ESCRT subunits. Science. 343, 653-656 (2014).
  45. Vaughan, J. C., Jia, S., Zhuang, X. Ultrabright photoactivatable fluorophores created by reductive caging. Nat Methods. 9, 1181-1184 (2012).
check_url/it/54774?article_type=t

Play Video

Citazione di questo articolo
Wang, Y., Kanchanawong, P. Three-dimensional Super Resolution Microscopy of F-actin Filaments by Interferometric PhotoActivated Localization Microscopy (iPALM). J. Vis. Exp. (118), e54774, doi:10.3791/54774 (2016).

View Video