Cell migration is essential for development, tissue maintenance and repair, and tumorigenesis, and is regulated by growth factors, chemokines, and cytokines. This protocol describes the dot assay, a two-dimensional, unconstrained migration assay to assess the migratory phenotype of attached, cohesive cell sheets in response to microenvironmental cues.
Although complex organisms appear static, their tissues are under a continuous turnover. As cells age, die, and are replaced by new cells, cells move within tissues in a tightly orchestrated manner. During tumor development, this equilibrium is disturbed, and tumor cells leave the epithelium of origin to invade the local microenvironment, to travel to distant sites, and to ultimately form metastatic tumors at distant sites. The dot assay is a simple, two-dimensional unconstrained migration assay, to assess the net movement of cell sheets into a cell-free area, and to analyze parameters of cell migration using time-lapse imaging. Here, the dot assay is demonstrated using a human invasive, lung colony forming breast cancer cell line, MCF10CA1a, to analyze the cells’ migratory response to epidermal growth factor (EGF), which is known to increase malignant potential of breast cancer cells and to alter the migratory phenotype of cells.
Migration assays are widely used to evaluate the invasive and metastatic potential of tumor cells in vitro. Most commonly, the wound or scratch assay is used to assess migration of epithelial sheets into a cell cleared area1,2,3. To perform the scratch assay, cells are plated into a monolayer and a "scratch" or cell-free area is created with a pipette tip. The scratch assay is easy to set up with commonly available tissue culture supplies and can be performed in multi-well plates, allowing for processing of multiple samples. However, as the scratch is made, cells are physically removed from the monolayer and often undergo cell death. Furthermore, extracellular matrix attached to the plate is often damaged during the scratching process. Similarly, the use of silicon inserts (such as Ibidi chambers4) or of stencils5,6,7 can lead to mechanical disruption of the cells and the partial removal of matrix proteins used for coating the plates. Another disadvantage of assays monitoring closure of wounds or scratches is their limited time course, as cell migration can only be analyzed until the scratch is closed.
In performing the dot assay, cells are plated as a circular colony onto a coated or uncoated plate8. The rationale for this plating strategy is to obtain cell sheets with defined edges, that can migrate or invade into the surrounding cell-free areas without disturbing the culture by removal of cells or inserts. The overall goal of the dot assay is to observe migration of cell sheets as measured by edge displacement or colony diameter, as well as to perform time-lapse imaging to analyze the migratory phenotype of cells in higher spatio-temporal resolution.
Cell migration can be affected by a variety of microenvironmental cues like chemokines, cytokines, and growth factors such as EGF. EGF is a growth factor that exerts its biological effects via binding to its receptor, EGF receptor9, and increases invasive and metastatic behavior of tumor cells4,9,10. Here, the dot assay is used to study EGF stimulated cell migration in a human invasive, lung colony forming breast cancer cell line (MCF10CA1a)8,11,12.
1. Coating of Dishes (Day 1)
NOTE: Make sure not to leave fingerprints or dirt on the bottom of the plate when handling it.
2. Plating the Dot Assay (Day 2)
3. Stimulating Cells (Day 3)
4. Visualization of Cell Colonies and Cell Migration
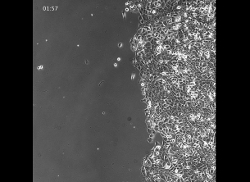
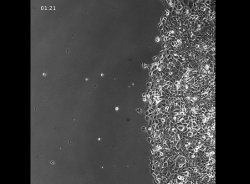
The dot assay presented here (Figure 1) was performed using invasive, lung colony forming breast cancer cells (MCF10CA1a) as a model system. The dot assay yields highly reproducible cell dots even in the hand of beginners, making it a convenient and easy to execute assay (Figure 1D). The dot assay combined with HE staining, or time-lapse imaging and subsequent particle image velocimetry (PIV) allows the study of various migration parameters including displacement of epithelial edges, cell speed, and cell directionality as cells at the edges of an epithelial sheet migrate into a cell-free area. Initially, phase contrast imaging of cell dots revealed that invasive, lung colony forming breast cancer cells (MCF10CA1a) maintain a mesenchymal phenotype after stimulation with EGF. However, single cells leaving the sheet are observed more frequently in EGF-stimulated cell dots (Figure 2, arrows). The response of MCF10CA1a cells to EGF was further assessed by HE staining of cultures that were stimulated with EGF for 4 days. Indeed, EGF-stimulation resulted in an increased colony diameter (Figure 3). These observations indicate that migration of EGF stimulated cells might be altered.
Therefore, the dot assay was next utilized to perform a more detailed analysis of the dynamic migration phenotype of MCF10CA1a cell sheets. Cells at the sheet edges were imaged for 9 h following stimulation of cells with EGF (Video 1 and Video 2) and images were then analyzed by PIV in Matlab4,13,14. PIV revealed that EGF increases cell speed (Figure 4A) to 0.63 µm/min from 0.45 µm/min in control cells. At the same time, EGF increased directionality of cells, and this is indicated by a reduction of the variability of cell directionality (angular spread) from 0.95 in control cultures to 0.79 in EGF-stimulated cultures (Figure 4B). EGF increased the radial displacement of the epithelial edge over 9 h from 257 µm to 356 µm (Figure 4), as was also observed by HE staining after 4 days (Figure 3). Thus, the use of the dot assay in combination with different subsequent assays shows that EGF alters migration at the edges of MCF10CA1a cells sheets such that the cell speed and directionality are increased, resulting in an increased colony radius.
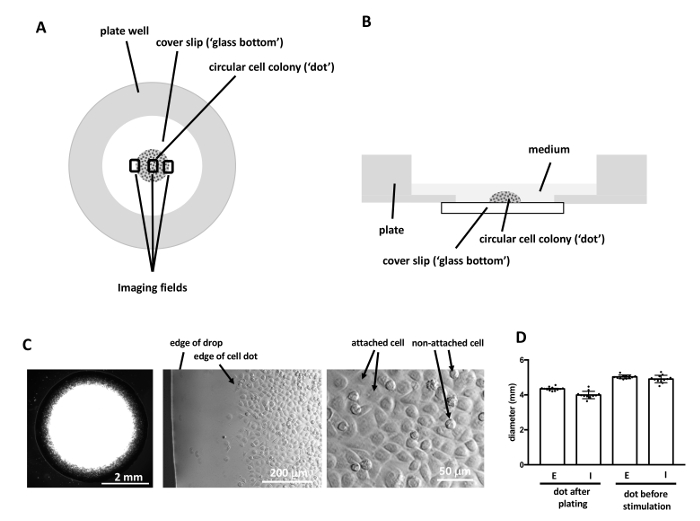
Figure 1: Imaging the dot assay. (A, B) Cells are plated as a circular colony in the center of glass bottom plate wells. For migration analysis, images are taken at two opposing edges as well as the center of the colony (A). (C) Dark field image of cell dot during plating (left), and in higher magnification (phase contrast) showing the edge of the drop and the edge of the cell dot after cells attached to the plate (center). Attached cells are flat and polygonal, while non-attached cells are round (right). (D)The diameter of dots is highly reproducible. Dots were imaged immediately after plating and before cells were stimulated and the diameter determined using ImageJ. The dot size is highly reproducible within one experiment as well as between different users and little training is required to gain proficiency in plating the cell dots (E = more than 10 years of experience in tissue culture, I = less than 4 weeks of experience in tissue culture). n = 12 dots per group. Please click here to view a larger version of this figure.
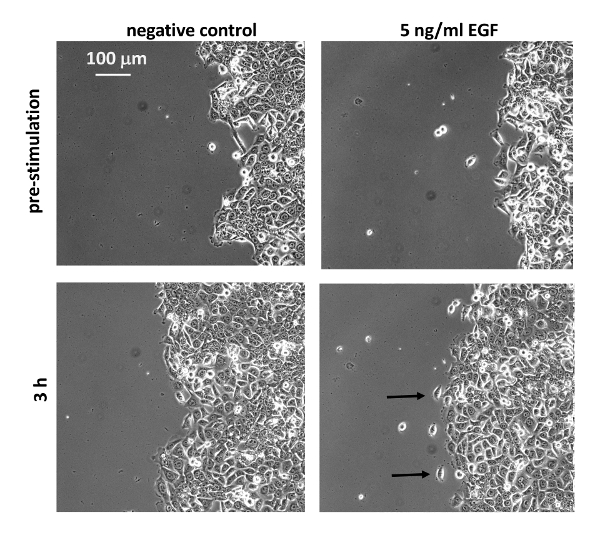
Figure 2: EGF modulates the morphological phenotype of MCF10CA1a cells. MCF10CA1a cells were starved for 3 h in DMEM/F12 supplemented with 0.1% horse serum before they were stimulated with EGF (5 ng/mL). At the edge of EGF-stimulated colonies single cells tend to migrate out of the sheet (arrows). Please click here to view a larger version of this figure.
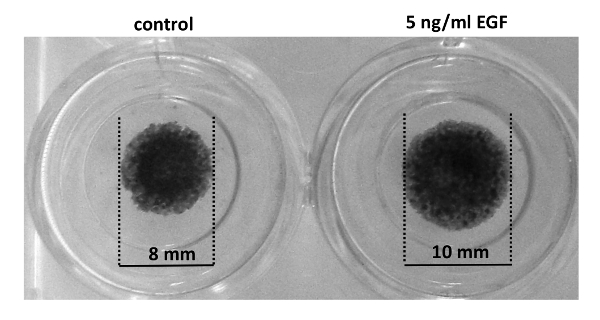
Figure 3: EGF increases net growth of cell colonies. MCF10CA1a cells were starved for 3 h in DMEM/F12 medium supplemented with 0.1% horse serum before they were stimulated with EGF (5 ng/mL). 4 days later, cells were ethanol fixed and stained with Hematoxylin & Eosin. EGF-stimulated dots have a higher diameter after 4 days. Please click here to view a larger version of this figure.
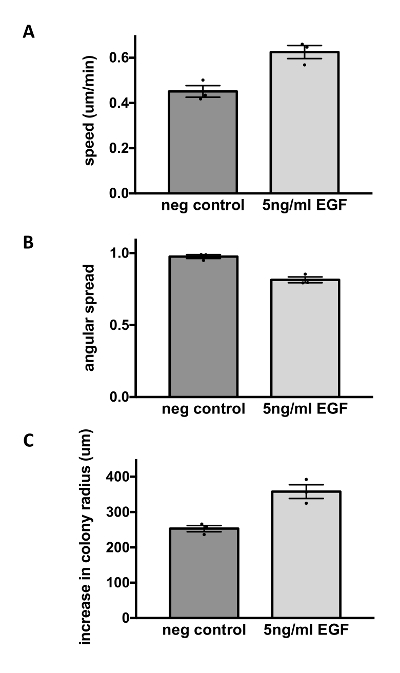
Figure 4: EGF modulates the migratory phenotype of MCF10CA1a cells. MCF10CA1a cells were starved for 3 h in DMEM/F12 medium supplemented with 0.1% horse serum before they were stimulated with EGF (5 ng/mL). Cells were imaged every 3 min for 9 h. Subsequent particle image velocimetry analysis was performed in Matlab13. Speed values represent the average speed over time for each field. Angular spread of velocity vectors was calculated as:
where 
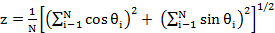
, and ranges from 0 (high directionality) to (low directionality). A decrease in angular spread is considered an increase in directionality. Radial displacement was calculated by subtracting the colony radius at t = 0 h from the colony radius at t = 9 h. EGF-stimulation of MCF10CA1a cell dots resulted in increased cell speed (A; upper panel), decreased angular spread or increased directionality (B; middle panel), and increased colony radius (C; bottom panel). Data represent mean ± SEM of n = 3 experiments. Please click here to view a larger version of this figure.
Video 1: Time-lapse imaging of unstimulated MCF10CA1a cells. Images were taken every 3 min for 9 h. Please click here to view this video. (Right-click to download.)
Video 2: Time-lapse imaging of MCF10CA1a cells stimulated with EGF (5 ng/mL). Images were taken every 3 min for 9 h. Please click here to view this video. (Right-click to download.)
During tumor progression cells migrate away from the tissue of origin to invade the surrounding tissue and metastasize to distant sites15. Migration of cells away from a cell colony can be observed in the dot assay. Here, the dot assay is illustrated by analyzing the migratory phenotype of human breast cancer cells in response to EGF.
To obtain accurate and replicable results several steps in the set-up of the dot assays are critical. First, the coating of the plate determines if and how strong cells can adhere to the plate and if cells migrate. Care should be taken that the coating of the plate with collagen IV or other extracellular matrix is homogenous to minimize experimental variability. Furthermore, it must be ensured that the cells investigated attach to and migrate on the coated plate, and multiple experiments with different matrices in several concentrations might be necessary to optimize the coating conditions for a chosen cell line. Second, the accurate plating of the cells is crucial for reproducibility. The footprint of the cell drop determines the size of the cell dot as well as its shape. Ideally, the drop is placed without the pipette tip touching the surface. The shape of the drop is then mostly determined by the surface tension of the plate surface, resulting in a circular footprint of reproducible diameter. Consequently, the diameter of the cell dot can be altered by changing the volume of cell suspension plated.
Thus, several points are to be consider when performing the dot assay. Firstly, the cell density of the cell suspension needs to be adjusted to the coating as well as to the cell type used. In general, if the drop spreads wider, higher cell densities are needed to plate cells into confluent monolayers. Furthermore, more cells need to be plated to obtain a confluent monolayer if cells are small and do not spread much as compared to large, spreading cells. Secondly, the dot assay can be adopted to different plate formats, and for this, the dot size can be adapted to smaller wells by reducing the volume of the dot plated, and if desired, larger dots can be plated by using higher drop volumes. Thirdly, some cell lines will not attach to the plate within 30 min, in which case the plating time can be extended up to 3 h. Similarly, the coating of the plate must be suitable for cells to migrate on and care should be taken not to scratch the coating when plating the cells. If cells do not attach or migrate on the chosen matrix, other types of coating, for example collagen 1 or fibronectin, can be explored, or concentrations of matrix proteins, incubation times, and incubation temperatures during the coating of plates changed. Suitable extracellular matrix for specific cell lines might be found in literature.
The dot assay has few limitations. It is a two-dimensional migration assay and thus this may be considered as a disadvantage compared to three-dimensional assays, which are, however, more difficult to perform than two-dimensional assays. A major problem perhaps is that cell proliferation can influence results, particularly if fast proliferating cell lines are used and cell migration is assessed over longer time periods as was done here for the analysis of the colony diameter after 4 days. Similarly, in scratch assays the closure of a scratch wound is affected by cell proliferation within the cell sheet; and in Boyden chamber assays, particularly if serum or other mediators that induce cell proliferations are used as a chemoattractant, increased cell proliferation in the bottom chamber can skew results. Single cell tracking can be used to specifically observe movement of non-proliferating cells. Furthermore, cell proliferation can be reduced by (i) serum starvation as done here and/or (ii) inhibition of mitosis by addition of mitomycin or other proliferation inhibitors4,16. To reduce cell proliferation, however, care must be taken to not damage the cells to an extent that they can no longer migrate. Interestingly, we found in a similar unconstrained migration assay that cell proliferation is not correlated with edge displacement, although it is involved in maintaining epithelial sheet integrity during migration4,5,17. This opens an interesting question: Is cell proliferation a necessary component of migration of a cell sheet? It is expected that migration of cell sheets with strong cell-cell adhesions into the surrounding environment will be negatively affected if proliferation is blocked entirely, as the sheet eventually will no longer be able to expand and support migration of cells. At this point, the cells should either slow or stop migration, or the sheet should disrupt. Conversely, the migration of sheets with low cell-cell adhesions might be less impacted as cells can leave the sheet to migrate independently, such as scattering at the edge of the epithelial sheet. Thus, the cell migration and cell proliferation are interdependent, and any attempt of blocking cell proliferation to study sheet migration needs to be carefully considered. Thus, assays analyzing sheet migration are mostly performed under serum starvation which reduces but does not abolish cell migration.
Other migration assays to study sheet migration on two-dimensional surfaces include the scratch or wound assay and, more recently, unconstrained migration assays using silicon or PDMS chambers and stencils which allow plating of cells in defined areas and unconstrained migration of cells into the cell-free area after removal of the chamber or stencil1,3,4,5,6,7,16. These latter assays and the dot assay offer high reproducibility in the hand of experienced as well as unexperienced users as the cell plating determines the shape and size of the colony. In contrast, scratching of the cellular monolayer in scratch assays requires practice, and even in the hands of experts parts of the sheet can be ripped off erroneously if cell lines that form tight monolayers are used. This issue is improved when silicone chambers or stencils are used for plating the cells, although we observed erroneous wounding of cell sheets after removal of Ibidi chambers. The dot assay avoids this issue as the cells are plated into a colony and allowed to grow freely. For the same reasons, the dot assay also allows the cells to migrate on the unaltered coating, which is easily disturbed by scratching or removal of the chamber/stencil in other migration assays. Furthermore, as cells are not injured by scratching or removal of chambers/stencils, cell death and the associated release of cytokines associated with the removal of chambers/stencils has no impact on migration in the dot assay. Lastly, cells are often over-plated in scratch assays and assays using chambers or stencils. Thus, after clearing cells by scratching them off or removing the physical barriers that hinder cell migration, the cell monolayer will relax and cell are pushed, spreading into the cell-free area without actively migrating. In contrast, in the dot assay, cell sheets can establish themselves overnight before migration is observed, and cell migration rather than relaxation of the cell sheet can be observed.
The dot assay, which can be easily performed without any specialized equipment, lends itself to a range of subsequent assays, including staining of cells to assess gross colony morphology and cell scattering8, immunostaining8, time-lapse imaging, and subsequent data analysis using ImageJ, Matlab, or other image analysis software13. Additional parameters such as correlation of neighboring vectors or their separation trajectories can be assessed to more precisely describe the coherence of cell movement within sheets13. Time-lapse imaging can also be combined with immunostaining and ImageJ supported cell tracking to gain further insight into cell migration. For example, dots can be immunostained for cytoskeletal proteins after time-lapse imaging, and cells can then be tracked using ImageJ to analyze how expression of these proteins influences the migratory phenotype of cells. Another future use is single cell tracking of cells that express nuclear fluorescent proteins. Importantly, the dot assay can be performed in multi-well plates and is such suitable for medium-to-high throughput imaging, making it an easily accessible and very affordable tool to screen the effect of drugs or shRNAs on sheet migration.
The authors have nothing to disclose.
The author wishes to thank Bhagawat Subramanian, Yi (Jason) Chang, Paul Randazzo, and Carole Parent for reading and commenting on the manuscript. This work was supported by the Intramural Research Program of the National Cancer Institute, National Institutes of Health.
MCF10CA1a cells | Karmanos Research Institute | N/A | cells used for asay |
mouse collagen IV | BD Biosciences | 354233 | used to coat plates |
trypsin / EDTA | Thermo Fisher | 25300054 | used to remove cells from tissue culture plates |
DPBS | Mediatech | 21-031-CV | used to wash cells |
DMEM / F12 | Thermo Fisher | 11320082 | used as culture medium |
horse serum | Thermo Fisher | 26050088 | used to supplement culture medium |
12well glass bottom plate | MatTek | P12G-1.5-14-F | used to grow cells for imaging |
LPA (1-Oleoyl Lysophosphatidic Acid ) | Cayman | 10093 | used to stimulate cells |
EGF (epidermal growth factor, human recombinant) | Peprotech | AF-100-15 | used to stimulate cells |
fatty acid free BSA | Sigma | A8806-1G | used to make buffer for LPA and EGF |
hematoxylin | Sigma | HHS32 | used to stain colonies |
eosin | Electron Microscopy Sciences | 26051-10 | used to stain colonies |
37C, 5% CO2 incubator | Sanyo | model MCO-18AIC (UV) | |
Zeiss AxioObserver with incubator chamber and motorized stage | Zeiss | model Axio Observer.Z1 | used for time lapse imaging |
ORCA Flash LT sCMOS camera | BioVision | C11440-42U-KIT | used for timelapse imaging in combination with Zeiss AxioObserver |
Metamorph | BioVision | MMACQMIC | software used for time lapse imaging |
inverted microscope | Olympus | model IX70 | used to count cells and to check colonies in tissue culture |
plastic box | Lock&Lock | N/A | used as humid chamber (any tight closing plastic box that fits the plates can be used) |