The current article describes the generation and metabolic characterization of high-fat diet-fed mice as a model of diet-induced insulin resistance and obesity. It further features detailed protocols to perform the oral glucose tolerance test and the insulin tolerance test, monitoring whole-body alterations of glucose metabolism in vivo.
Obesity represents the most important single risk factor in the pathogenesis of type 2 diabetes, a disease which is characterized by a resistance to insulin-stimulated glucose uptake and a gross decompensation of systemic glucose metabolism. Despite considerable progress in the understanding of glucose metabolism, the molecular mechanisms of its regulation in health and disease remain under-investigated, while novel approaches to prevent and treat diabetes are urgently needed. Diet derived glucose stimulates the pancreatic secretion of insulin, which serves as the principal regulator of cellular anabolic processes during the fed-state and thus balances blood glucose levels to maintain systemic energy status. Chronic overfeeding triggers meta-inflammation, which leads to alterations in peripheral insulin receptor-associated signaling and thus reduces the sensitivity to insulin-mediated glucose disposal. These events ultimately result in elevated fasting glucose and insulin levels as well as a reduction in glucose tolerance, which in turn serve as important indicators of insulin resistance. Here, we present a protocol for the generation and metabolic characterization of high-fat diet (HFD)-fed mice as a frequently used model of diet-induced insulin resistance. We illustrate in detail the oral glucose tolerance test (OGTT), which monitors the peripheral disposal of an orally administered glucose load and insulin secretion over time. Additionally, we present a protocol for the insulin tolerance test (ITT) to monitor whole-body insulin action. Together, these methods and their downstream applications represent powerful tools to characterize the general metabolic phenotype of mice as well as to specifically assess alterations in glucose metabolism. They may be especially useful in the broad research field of insulin resistance, diabetes and obesity to provide a better understanding of pathogenesis as well as to test the effects of therapeutic interventions.
In the developed world, obesity and diabetes reached epidemic dimensions due to physical inactivity and the excess consumption of processed food, effects which are driven by rapid urbanization, industrialization as well as globalization. Although research on insulin resistance and it's co-morbidities, such as hyperlipidemia and atherosclerosis, has gained prominence during the last decades, the complex biological mechanisms which regulate metabolism in health and disease remain incompletely understood and there is still an urgent need for new treatment modalities to prevent and treat these diseases1.
Insulin, and it's counter-regulatory hormone glucagon serve as the principal regulators of cellular energy supply and macronutrient balance, thus also maintaining proper systemic blood glucose concentrations2. Glucose itself acts as one of the main stimulators of insulin secretion by pancreatic β-cells, while other macronutrients, humoral factors as well as neural input further modify this response. Insulin consequently triggers the anabolic processes of the fed state by facilitating the diffusion of excess blood glucose into muscle and fat cells and further activating glycolysis as well as protein- or fatty acid synthesis, respectively. Additionally, insulin suppresses hepatic glucose output by inhibiting gluconeogenesis. Chronic excess energy consumption and meta-inflammation lead to hyperinsulinemia and peripheral insulin resistance due to the down-regulation of insulin receptor expression as well as alterations in downstream signaling pathways, thus resulting in impaired sensitivity to insulin-mediated glucose disposal as well as insufficient inhibition of hepatic glucose production3,4,5,6.
A wide range of animal models with genetic, nutritional, or experimental induction of disease have been proven to be excellent tools to study the molecular mechanisms of insulin resistance and various forms of diabetes as well as its accompanying illnesses7. A prime example is the widely used and well established HFD-induced mouse model, which is characterized by rapid weight gain due to increased dietary intake in combination with reduced metabolic efficiency, resulting in insulin resistance8,9. Both in animal models and humans, an elevation in fasting blood glucose and insulin levels, as well as an impaired tolerance to glucose administration are frequently used indicators of insulin resistance and other systemic alterations of glucose metabolism. Monitoring blood glucose and insulin levels at the basal state or after stimulation are therefore easily accessible readouts.
The present protocol outlines the generation of HFD-fed mice as well as two frequently used methods, the oral glucose tolerance test (OGTT) and the insulin resistance test (ITT), which are useful to characterize the metabolic phenotype and to investigate alterations in glucose metabolism. We describe the OGTT in detail, which assesses the disposal of an orally administered glucose load and insulin secretion over time. Further, we provide instructions on how to conduct the ITT to investigate whole-body insulin-action by monitoring blood glucose concentration in response to a bolus of insulin. The protocols described in this article are well-established and have been used in multiple studies10,11,12. In addition to slight modifications which may help to increase success, we provide guidelines for experimental design and data analysis, as well as useful hints to avoid potential pitfalls. The protocols described herein can be very powerful tools to investigate the influence of genetic, pharmacological, dietary, and other environmental factors on whole body glucose metabolism and on its associated disorders such as insulin resistance. In addition to stimulation with glucose or insulin, a variety of other compounds may be used for stimulation depending on the purpose of individual research. Although outside of the scope of this manuscript, many other downstream applications can be performed on the drawn blood samples, such as the analysis of blood values other than glucose and insulin (e.g., lipid and lipoprotein profiles) as well as detailed analysis of metabolic markers (e.g., by quantitative real time Polymerase Chain Reaction (PCR), Western blot analysis, and Enzyme-Linked Immunosorbent Assay (ELISA)). Further flow cytometry and Fluorescence Activated Cell Sorting (FACS) may be applied to investigate the effects in distinct single cell populations, while transcriptomic, proteomic, and metabolomic approaches may also be utilized for untargeted analysis.
Overall, we provide a simple protocol to generate an HFD-induced mouse model, while further describing two powerful approaches to study whole-body metabolic alterations, the OGTT and the ITT, which can be useful tools for studying disease pathogenesis and developing new therapies, especially in the field of metabolism-associated diseases such as insulin resistance & diabetes.
All methods described here have been approved by the Animal Care and Use Committee of the Medical University of Vienna and conducted according to the Federation of European Laboratory Animal Science Associations (FELASA). Please note that all procedures described in this protocol should only be performed after institutional and governmental approval as well as by staff that are technically proficient.
1. HFD-fed mice
NOTE: Maintain all C57BL/6J mice on a 12-h light/dark cycle with free access to food and water.
2. OGTT
NOTE: If blood sampling time points are chosen during OGTT every 15 min, the experiment should be performed with a maximum of 15 mice in parallel, in order to have at least 1 min handling-time per mouse.
3. ITT
NOTE: The same precautions described for OGTT (handling of mice, blood, glucometer, and petroleum jelly use) also have to be applied when performing the ITT. For example, all injections should be carried out within 15 min in 1 min intervals if 15 mice are tested in parallel. For the ITT, subsequent collection of blood samples with capillary tubes is optional.
Figure 1 illustrates a schematic time table for metabolic phenotyping of mice on diets. At an age of approximately 6 weeks, mice should be placed on an HFD, while an LFD-group may serve as the control group. Importantly, body weight should be determined weekly to observe if there is an expected increase in body weight. Any kind of stress (e.g., noise or aggressive male behavior) can interfere with body weight gain and should be eliminated immediately. Each cohort of mice for diet experiments should consist of at least 10 mice because these diet-experiments are time-consuming, and outliers are frequent (e.g., mice not gaining weight or mice with abnormal glucose or insulin levels). After the selected period of time (depending on the study hypothesis and the time point of expected changes), OGTT and ITT can be performed for the evaluation of glucose tolerance and insulin action. In this paper, late time points for the metabolic test were chosen.
Importantly, there should be a recovery time of at least 1 week between the OGTT and ITT as these experiments lead to substantial blood-loss and are thus very stressful for mice. If the blood collection volumes are decreased (e.g., if performing an ITT without additional blood collection first), this recovery period may also be shortened or omitted, in line with the guidelines for multiple blood draws in animals14,15,16,17.
In this large study with 60 C57BL/6J mice in total, half of the mice were set on HFD or LFD at an age of 6 weeks (n = 30/group) and body weight gain was monitored for 16 weeks on diet. The consumption of HFD resulted in a significant increase in body weight as shown in Figure 4. At 6 weeks of age, the body weight was 20.2 g in both groups. Whereas mice on LFD showed a consistent, slightly increasing body weight (31.2 g ± 2.7) during the observed period, mice on HFD increased their body weight rapidly, especially during the first weeks and reached their body weight maximum after 16 weeks on the diet. Although the weight curves showed a similar pattern during the experiment, the mice of the HFD-group reached a 1.5- to 2-fold higher body weight (44.4 g ± 4.0) compared to the LFD-fed mice.
To investigate the metabolic phenotype of the two cohorts, an OGTT (Figure 5) and ITT (Figure 6) were performed. As blood volume is limited in small rodents, a point-of-care (POC) assay for diabetic humans (glucometer) was used to monitor blood glucose levels during these metabolic phenotyping experiments. As demonstrated in Figure 2, the blood glucose monitors are easy to use, need only a small drop of blood, and display blood glucose levels within seconds for documentation. Figure 5 presents the time course of absolute glucose (Figure 5a–b) and absolute insulin (Figure 5c) levels during the OGTT. Generally, a healthy mouse with normal glucose tolerance shows a characteristic rapid rise in blood glucose, reaching its peak 15-30 min after the glucose challenge.
Subsequent glucose uptake, primarily conducted by muscle, fat-tissue, and liver-tissue leads to a gradual decrease of the blood glucose concentration. In all experiments, the LFD-fed mice served as the glucose tolerant control group and therefore fulfilled the expected metabolic profile: the peak of the blood glucose levels of ~240 mg/dL was reached approximately 15 min after glucose administration, immediately followed by a decrease reaching basal levels approximately 60 min after the glucose challenge, indicating proper glucose elimination. In sharp contrast, HFD-mice peaked at approximately ~320 mg/dL glucose and showed nearly no disposal of glucose, indicating glucose resistance. When blood glucose levels between two groups already differ in the fasting state (as in this representative example), a calculation of the area under the curve (AUC) above baseline glucose should be performed to validate the results (Figure 5a–b).
Additionally, the circulating blood insulin levels were determined using an insulin-ELISA test (Figure 5c) in order to provide more information about the underlying pathophysiology in this model. Whereas the insulin levels were nearly unchanged in the control group, mice fed an HFD showed 16-fold elevated fasting levels compared to the control group, as well as a greatly increased insulin response, indicating HFD-induced compensatory hyperinsulinemia as an attempt to counterbalance decreased glucose elimination capacity, which may be caused by insulin resistance. However, be aware not to over-interpret the results of the OGTT, as this test does not directly evaluate insulin action and should not be used to conclude statements about insulin resistance.
To measure insulin sensitivity in the HFD-fed mice, an ITT was performed 1 week after OGTT (Figure 6a). In this assay, the degree to which blood glucose concentrations fall following insulin administration represent the efficiency of whole-body insulin action. The HFD-fed mice showed an impaired reduction of blood glucose levels compared to the LFD-fed control group, at all time points during the ITT, thus suggesting insulin resistance. The ITT results are usually presented as the time course of glucose levels, but additionally also the inverse AUC below baseline glucose may be shown as demonstrated in Figure 6b. If the groups which are compared have similar fasting blood glucose levels (which is not the case in this experiment), the glucose levels during ITT can also be presented as the percentage of basal glucose. As in mice, a counter-regulatory response to insulin is activated if the blood glucose levels fall below ~80 mg/dL18: defects in this counter-regulatory response in a particular mouse model may be misinterpreted as an increase in insulin sensitivity. During HFDs and subsequent metabolic phenotypic experiments, outliers may frequently occur. Mice which do not gain weight on HFD, or those showing abnormal fasting glucose and/or insulin levels should be excluded from the analysis. For the latter two, an outlier test may be performed for each experimental group separately (e.g., Grubbs test)
In this study, as an example we showed and interpreted data of metabolic experiments in vivo, carried out on mice with diet-induced obesity, glucose intolerance, and insulin resistance, and compared them to a control group with normal body weight. As expected, there was impaired glucose tolerance and hyperinsulinemia in obese mice consistent with insulin resistance compared to the age-matched control mice; this was uncovered using well-established, reliable, time- and budget-friendly methods, which are relatively easy to perform. Differences in glucose tolerance, insulin levels as well as in insulin sensitivity, which are all obtained by the presented methods of OGTT and ITT, can often help to plan the next steps of a study, which may include more sophisticated experiments such as hyperglycemic or hyperinsulinemic clamps, as well as experiments with isolated pancreatic islets.
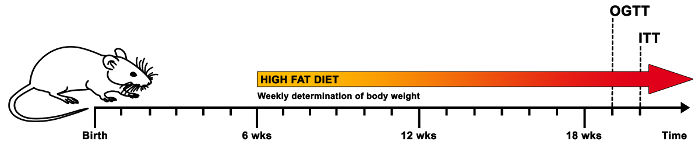
Figure 1. Schematic time table for a suggested diet regime and metabolic experiments in vivo. In order to investigate the metabolic effects of HFD in mice, the animals of the experimental group are placed on HFD at approximately 6 weeks of age, while the control group receives an LFD. The body weight of the mice should be determined on a weekly basis to assess proper weight gain. After approximately 12 weeks on diet (or a selected time point depending on the research hypothesis), the metabolic phenotype of the mice is evaluated by an OGTT followed by 1 week of recovery-time and subsequently an ITT. Please click here to view a larger version of this figure.
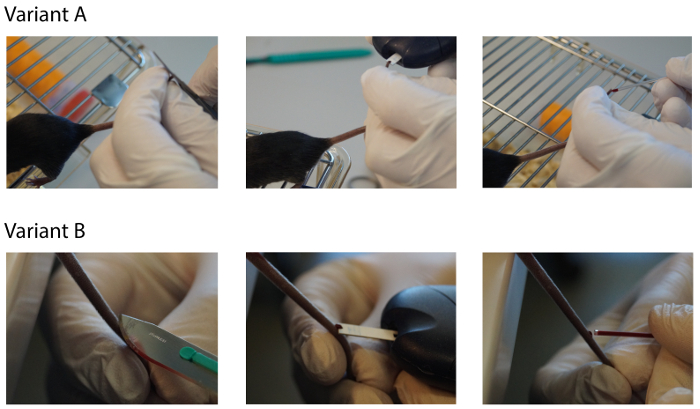
Figure 2. Methods for blood sampling during metabolic experiments. For the OGTT as well as for the ITT, where repeated blood sampling is required, we recommend drawing blood via carefully cutting a 1-2 mm piece of the tail tip with sharp scissors (Variant A), followed by the determination of blood glucose levels with a glucometer and further collection of blood with a capillary to determine insulin levels and other relevant blood values. Alternatively, blood might also be sampled via the tail vein (Variant B) or by arterial catheterization (not shown). Please click here to view a larger version of this figure.
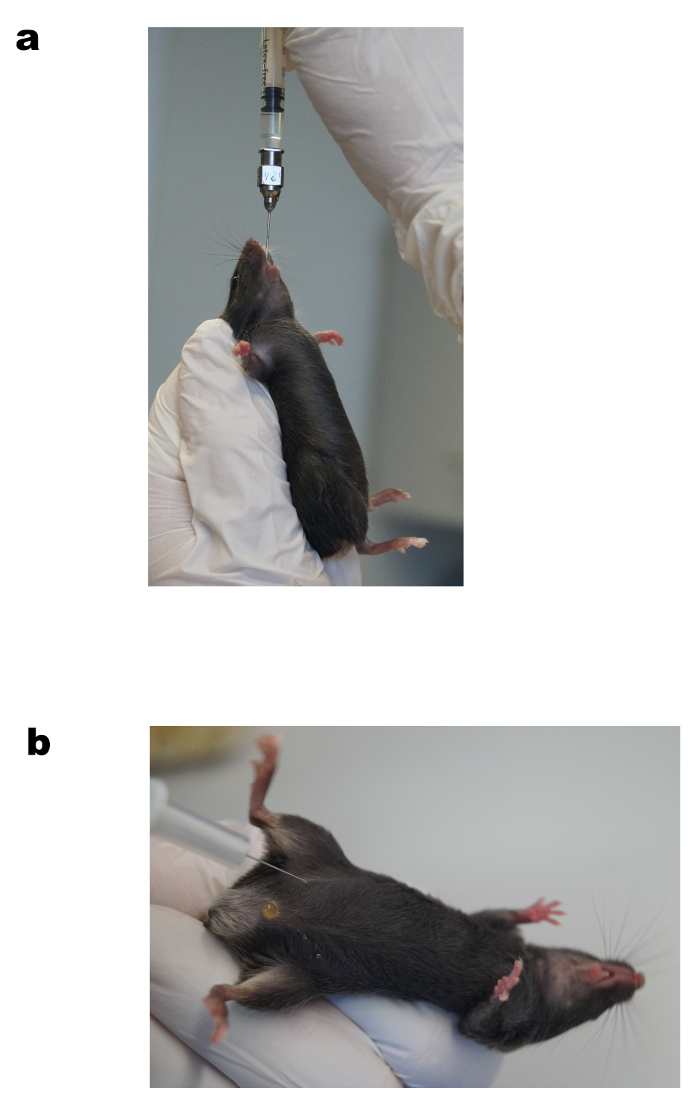
Figure 3. Oral gavage of glucose (a) and intraperitoneal insulin injection (b). Representative images of oral glucose administration using a feeding needle during OGTT (a) and the intraperitoneal injection of insulin during ITT (b). See protocol for a detailed description. Please click here to view a larger version of this figure.
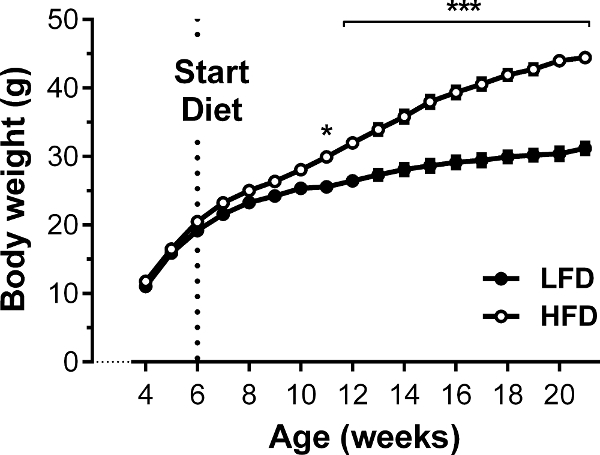
Figure 4. Body weight gain of HFD-fed and LFD-fed C57BL/6J mice. C57BL/6J mice were either set on 60% HFD, or 10% LFD to serve as a control, for a period of 20 weeks. Whereas mice on HFD showed an expected increase in body weight, especially in the first weeks on diet, LFD-fed mice showed nearly constant body weight during the observed period. Results are mean ± SEM. *p < 0.05, **p < 0.01, ***p < 0.001. n = 30 per group. ANOVA and Tukey's post hoc test were used to test for differences. Please click here to view a larger version of this figure.
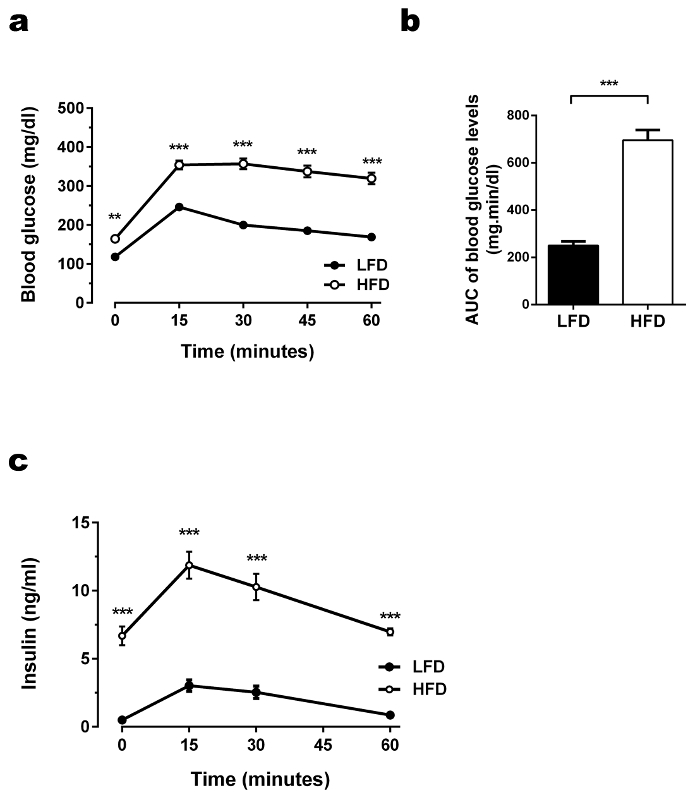
Figure 5. OGTT performed in HFD-fed and LFD-fed C57BL/6J animals. (a) Glucose levels during OGTT. After an overnight fast, glucose (mg/dL) levels were measured in fasting state and 15, 30, 45, and 60 min after administering glucose solution orally via gavage (1 g glucose/kg). Glucose levels in the HFD-group were elevated in the fasting state as well as after glucose challenge. The increase reached its peak after 15 min followed by a delayed and slow decrease. Results are mean ± SEM. *p < 0.05, **p < 0.01, ***p < 0.001. n = 30 per group. Statistical analysis was performed using ANOVA and Tukey's post hoc test.(b) Glucose area under the curve (AUC) during OGTT. To calculate the baseline corrected AUC, basal glucose levels (time point 0) were subtracted from all later obtained blood glucose levels for each mouse individually, followed by the calculation of the individual AUCs. The AUC above the baseline glucose illustrates the glucose resistance in the HFD-fed mice. Statistical analysis was performed using ANOVA and Tukey's post hoc test (glucose levels) or Student's two tailed t-test (AUC). (c)Insulin levels during OGTT. Insulin (ng/mL) levels were measured after a fasting period of 4 h and 15, 30, and 60 min after administering glucose solution orally via gavage (1 g glucose/kg). HFD-fed mice not only compensated for the glucose injection with a higher increase in blood insulin levels, they also started and ended the OGTT with elevated insulin levels compared to the control group. Results are mean ± SEM. *p < 0.05, **p < 0.01, ***p < 0.001. n = 30 per group. Statistical analysis was performed using ANOVA and Tukey's post hoc test. Please click here to view a larger version of this figure.
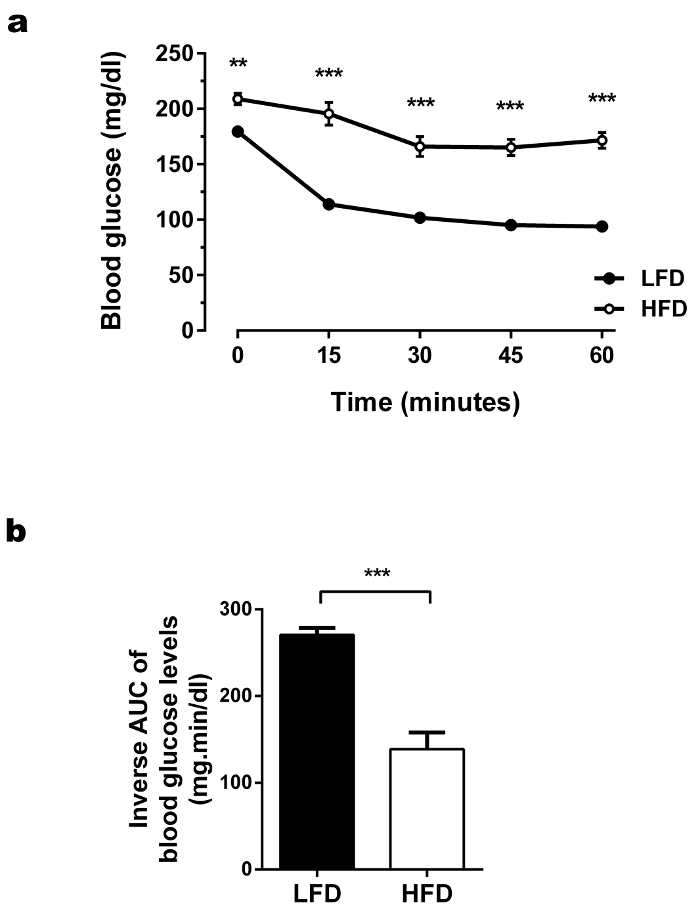
Figure 6. ITTs performed in HFD-fed and LFD-fed C57BL/6J animals. (a) Glucose levels during ITT. The glucose (mg/dL) levels were measured in fasting state and 15, 30, 45, and 60 min after injection of insulin intraperitoneally (0.75 U insulin/kg). During ITT, HFD-fed mice showed elevated glucose levels. The blood glucose levels were not adequately lowered in the HFD-fed mice after insulin injection. Results are mean ± SEM. *p < 0.05, **p < 0.01, ***p < 0.001. n = 30 per group. Statistical analysis was performed using ANOVA and Tukey's post hoc test. (b) Glucose area under the curve (AUC) during ITT. To calculate the baseline corrected inverse AUC, basal glucose levels (time point 0) were subtracted from all later obtained blood glucose levels for each mouse individually. The values were inverted (multiplication with -1), followed by the calculation of the individual AUCs. As a consequence of the higher glucose level in HFD-fed mice during OGTT, the baseline corrected inverse AUC was lower in the HFD-fed mice compared to control mice, which further suggested decreased insulin sensitivity. Statistical analysis was performed using ANOVA and Tukey's post hoc test (glucose levels) or Student's two tailed t-test (inverse AUC). Please click here to view a larger version of this figure.
Supplementary Figure 1. Checklist for experiment preparation. Please click here to download this file.
Supplementary Figure 2. Insulin levels during ITTs. Plasma insulin levels during the ITT in the LFD-fed versus the HFD-fed groups showed similar dynamics in the plasma insulin levels after insulin injection in both groups. As expected, the HFD mice exhibited strongly increased basal insulin levels compared to the control group. Further, the increase in the insulin levels in the HFD-fed mice was stronger, which may be partially caused by the overestimation of lean body mass if the amount of injected insulin is calculated based on the whole-body mass (the conventional normalization approach) as performed in this experiment. However, the insulin response was impaired in the HFD-fed group (insufficient reduction of plasma glucose levels), thus further emphasizing the insulin resistant state in these animals. Results are mean ± SEM. *p < 0.05, **p < 0.01, ***p < 0.001. Statistical analysis was performed using ANOVA and Tukey's post hoc test. Please click here to download this file.
With the high prevalence of diabetes and associated diseases in the world's population, there is a strong requirement for research addressing the molecular mechanism, prevention, and treatment of disease19. The presented protocol describes well-established methods for the generation of HFD mice, a robust animal model used for metabolic research, as well as the conduction of the OGTT and ITT, which are potent tools for the assessment of whole-body metabolic alterations such as insulin resistance. The methods presented in this paper may be useful to study the role of suspected genes, environmental factors as well as pharmacological, dietary, physical, or genetic therapies on whole body glucose-metabolism9,10. While glucose serves as the principal stimulus for insulin secretion in an OGTT, the presented protocol may be modified by (co-) applying other substances such as other macronutrients and hormones which are known to modify the insulin response2. Similarly, the ITT protocol may be modified by the (co-) application of other substances (e.g., glucagon or catecholamines) according to the individual research question. The main readouts of the described OGTT and ITT protocols are blood glucose and insulin concentrations; however, the measurement of other blood parameters such as glucagon, fatty acid, and lipoprotein levels, as well as of various metabolic markers on the mRNA and protein level may also be useful depending on the aim of the study.
Investigators should be aware that the neuroendocrine responses to hypoglycemia, insulin secretion, insulin action as well as the overall metabolic phenotype strongly depend on the genetic background of the mice10. Here, we utilized mice within the C57BL/6J genetic background as an HFD-induced model of diabetes, which have a partial impairment in glucose-mediated insulin secretion due to a naturally occurring deletion in the nicotinamide nucleotide transhydrogenase gene20, making them a suitable model for studying obesity associated insulin resistance8,9. The protocols described here may however also be utilized to metabolically characterize alternative mouse models of insulin resistance and diabetes, which are usually based on monogenic disorders or on the chemical destruction of β-cells21,22,23. Precautions during experimental design include testing age-matched mice, as insulin sensitivity declines with age24, and further to carry out the experiments in mice from the same sex. As genetic mutations and treatments may result in different phenotypes depending on sex25,26, it may also be advisable to investigate both sexes separately from each other.
The blood sampling method described in this protocol does not require anesthesia, which may influence heart rate, blood flow, and glucose metabolism, yielding non-physiological results10. Alternatively, an arterial catheter may be implanted, which allows vascular sampling without handling stress during the experiment, but also adds effort, costs as well as the risk of animal loss to the experiment. For the OGTT, mice are typically fasted overnight (14-18 h), which provokes a catabolic state in mice, strongly depleting liver glycogen stores. Though this reduces the variability in baseline blood glucose levels, the prolonged fast decreases the metabolic rate and enhances glucose utilization in mice, which is in contrast to the situation in humans10,27. As the feeding patterns in mice also do not mimic human behavior, it may be thus more physiological to perform an OGTT after a short fast. As circadian rhythms have a strong effect on systemic glucose metabolism28, it is important to consider at which time of day the experiments described here are conducted. In order to investigate the metabolism of mice during their active period (the dark phase), a reversed light-dark cycle may be valuable to generate more physiological results.
The described route of administration may also be varied depending on the specific hypothesis being tested. Oral administration of glucose during a glucose tolerance test leads to more variable insulin secretion, as gastric emptying, gastrointestinal motility, hormones (incretins), and neural input modify and prolong the insulin response2,10. During the well described "incretin effect", the absorption of glucose from the intestine leads to the release of gastrointestinal hormones such as GLP1, which potentiates oral glucose-delivered insulin release29. To circumvent these effects, a glucose bolus may also be administered intravenously (IVGTT) or intraperitoneally (IPGTT). Both glucose and insulin excursions significantly differ depending on the chosen delivery route. Compared to the OGTT, intraperitoneal administration of glucose leads to an increased and prolonged peak in plasma glucose levels, while plasma insulin levels rise in a delayed, but more sustained fashion30. Similarly, intravenous glucose administration is characterized by a delayed insulin response31. The sharp increases in insulin levels as well as more robust AUC-insulin data obtained during the OGTT suggest that oral delivery of glucose may be more sensitive to detect alterations in glucose metabolism in chow-fed versus HFD-fed mice30,31. Both intragastric and intraperitoneal delivery are similar in terms of severity for the animal and technical difficulty, while intravenous administration is usually more difficult as well as more stressful for the mice32. Oral administration further eliminates the 10-20% rate of error during intraperitoneal injections into the intestinal lumen or the stomach, which may impact the rate of glucose delivery and redistribution33,34.
Although it is the most physiological route of the glucose delivery, the OGTT is limited in accounting for only glucose absorption, while a full meal also contains proteins, complex carbohydrates, fats, fibers, and micronutrients. The standard approach during OGTT is to base the glucose dose on the body weight of the mouse, while usually 1-3 g of glucose/kg of body weight are administered35,36. In certain cases, a higher glucose loading than 1g/kg may be needed to reveal an impaired glucose tolerance30. Many mouse models of obesity and diabetes are characterized by alterations in body composition, especially a massive increase in fat mass, while lean body mass (muscle, brain, and liver), which is the main site of glucose disposal does not change proportionally. The conventional normalization approach to body weight will thus result in a disproportionally higher dose of glucose to which the lean tissue in an obese mouse is exposed compared to the non-obese mouse. This bias increases with a higher glucose dose30. Therefore, optimally the dose of glucose (OGTT) as well as insulin (ITT) should be calculated based on the lean body mass, if body composition data are available37. If the assessment of body composition is not possible due to technical limitations, the dosing should be performed according to the body weight (Supplemental Figure 2), while applying a fixed dose, such as in a human OGTT should be the last resort if performing these tests in mice10,35,36. In the presented protocol, a hand-held whole-blood monitor was used to measure blood glucose levels, which is advantageous in tests such as OGTT and ITT that require multiple sampling of small blood volumes. However, these devices are designed for human blood, having a reduced dynamic range. Alternatively, the glucose levels can be measured in the collected plasma samples, e.g., by fully automated chemistry analyzers in routine laboratories. In addition to insulin, C-peptide may be measured in the described protocols as a more direct indicator of β-cell secretory function, which is not extracted by the liver in contrast to insulin38,39. If gluconeogenesis needs to be assessed, the pyruvate tolerance test (PTT) may be applied, which is another variant of the here described protocols, monitoring glycemic excursions after the administration of a pyruvate bolus40.
The here described approaches of the OGTT and ITT can often explain observed differences in glucose tolerance and may further serve to suggest which subsequent, more sophisticated experiments shall be conducted next (e.g., hyperglycemic clamps or studies on isolated islets). In summary, we present a simple protocol for the generation of an HFD-induced mouse model and further describe the OGTT and ITT, which are powerful tools to assess alterations of the metabolic phenotype in vivo and may be useful to study metabolism-associated disease mechanisms as well as novel therapeutic approaches.
The authors have nothing to disclose.
This research was supported by the Medical Scientific Fund of the Mayor of the City of Vienna and the Österreichische Gesellschaft für Laboratoriumsmedizin und Klinische Chemie.
Mouse strain: C57BL/6J | The Jackson Laboratory | 664 | LFD/HFD |
Accu Chek Performa – Glucometer | Roche | 6870228 | OGTT/ITT |
Accu Chek Performa – Strips | Roche | 6454038 | OGTT/ITT |
D-(+)-Glucose solution | Sigma-Aldrich | G8769 | OGTT |
Actrapid – Insulin | Novo Nordisk | 417642 | ITT |
Reusable Feeding Needles | Fine Science Tools | #18061-22 | OGTT; 22 gauge (-24 gauge for young mice) |
Omnifix-Fine dosing syringes | Braun | 9161406V | OGTT/ITT |
Sterican Insulin needle (30G x 1/3"; ø 0.30 x 13 mm) | Braun | 304000 | ITT; lean mice |
Sterican (G 27 x 3/4"; ø 0.40 x 20 mm) | Braun | 4657705 | ITT; mice on HFD |
96 Well PCR Plates, non-skirted, flexible | Braintree Scientific, Inc. | SP0016 | OGTT |
Ultrasensitive Mouse Insulin ELISA kit | Crystam Chem | 90080 | OGTT |
Rodent Diet with 60% kcal% fat | Research Diets Inc | D12492 | mice on HFD |
Rodent Diet with 10% kcal% fat. | Research Diets Inc | D12450B | mice on LFD |
BRAND micro haematocrit capillary | Sigma-Aldrich | BR749321 | OGTT/ITT |
Vaseline – creme | Riviera | P1768677 | OGTT/ITT |