An advanced microscope that permit fast and high-resolution imaging of both, the isolated plasma membrane and the surrounding intracellular volume, will be presented. The integration of spinning disk and total internal reflection fluorescence microscopy in one setup allows live imaging experiments at high acquisition rates up to 3.5 s per image stack.
In living cells, processes such as adhesion formation involve extensive structural changes in the plasma membrane and the cell interior. In order to visualize these highly dynamic events, two complementary light microscopy techniques that allow fast imaging of live samples were combined: spinning disk microscopy (SD) for fast and high-resolution volume recording and total internal reflection fluorescence (TIRF) microscopy for precise localization and visualization of the plasma membrane. A comprehensive and complete imaging protocol will be shown for guiding through sample preparation, microscope calibration, image formation and acquisition, resulting in multi-color SD-TIRF live imaging series with high spatio-temporal resolution. All necessary image post-processing steps to generate multi-dimensional live imaging datasets, i.e. registration and combination of the individual channels, are provided in a self-written macro for the open source software ImageJ. The imaging of fluorescent proteins during initiation and maturation of adhesion complexes, as well as the formation of the actin cytoskeletal network, was used as a proof of principle for this novel approach. The combination of high resolution 3D microscopy and TIRF provided a detailed description of these complex processes within the cellular environment and, at the same time, precise localization of the membrane-associated molecules detected with a high signal-to-background ratio.
Our days, light microscopy techniques providing high/super resolution imaging in fixed and living specimen are developing rapidly. Super-resolution techniques such as stimulated emission depletion (STED), structured illumination microscopy (SIM) and photo-activation localization microscopy (PALM) or direct stochastic optical reconstruction microscopy (STORM), respectively, are commercially available and enable imaging of subcellular structures showing details almost on the molecular scale1,2,3,4,5,6. However, these approaches still have limited applicability for live imaging experiments in which large volumes need to be visualized with multiple frames per second acquisition speed. Varieties of highly dynamic processes regulated via the plasma membrane, e.g. endo-/exocytosis, adhesion, migration or signaling, occur with high speed within large cellular volumes. Recently, in order to fill up this gap, an integrated microscopy technique was proposed called spinning disk-TIRF (SD-TIRF)7. In detail, TIRF microscopy permits to specifically isolate and localize the plasma membrane8,9, while SD microscopy is one of the most sensitive and fast live imaging techniques for the visualization and tracking of subcellular organelles in the cytoplasm10,11. The combination of both imaging techniques in a single setup has already been realized in the past12,13, however, the microscope presented here (Figure 1) finally meets the criteria to perform live imaging SD-TIRF experiments of the aforementioned processes at 3 frames per second speed. Since this microscope is commercially available, the goal of this manuscript is to describe in details and provide open source tools and protocols for image acquisition, registration, and visualization associated with SD-TIRF microscopy.
The setup is based on an inverted microscope connected to two scan units via independent ports – the left port is linked to the SD unit and the back port to scanner unit for TIRF and photo-activation/-bleaching experiments. Up to 6 lasers (405/445/488/515/561/640 nm) can be used for excitation. For excitation and detection of the fluorescence signal, either a 100x/NA1.45 oil or 60x/NA1.49 oil TIRF objective, respectively, have been employed. The emitted light is split by a dichroic mirror (561 nm long-pass or 514 nm long-pass) and filtered by various band-pass filters (55 nm wide centered at 525 nm, 54 nm wide centered at 609 nm for green and red fluorescence, respectively) placed in front of the two EM-CCD cameras. Please note that more technical details about the setup are listed in Zobiak et al.7. In TIRF configuration, the SD unit is moved out of the light path within circa 0.5 s so that the same two cameras can be used for detection, allowing faster switching between the two imaging modalities compared to circa 1 s that was reported in the past13. This feature enables dual-channel simultaneous acquisition, thus 4 channels SD-TIRF imaging at previously unmatched speed and accuracy can be performed. Moreover, alignment between SD and TIRF images is unnecessary. Image alignment between the two cameras, however, has to be checked before starting the experiment and corrected if necessary. In the following protocol, a registration correction routine was implemented in a self-written ImageJ macro. Moreover, the macro was mainly designed to allow a simultaneous visualization of SD- and TIRF datasets despite their different dimensionality. The acquisition software itself did not provide these features.
1. Preparation of cells
2. Live imaging
3. Image post-processing in ImageJ
In order to show the potential of SD-TIRF imaging, an assay was developed that should reveal the spatio-temporal organization of cell-matrix adhesion complexes and their interaction with the cytoskeleton during cellular adhesion. Therefore, adherent HeLa or, alternatively, NIH3T3 cells were transfected with YFP-Vinculin and RFP-Lifeact for 18-24 h, trypsinized and seeded onto fibronectin-coated glass bottom dishes. These cell lines were chosen for their pronounced cytoskeleton and higher robustness in live imaging experiments opposed to, for example, primary cells. Those might not withstand imaging in very sensitive condition as they are after trypsin treatment. At the microscope, YFP/RFP-expressing cells were selected and the adhesion process observed during a 60min time-lapse (Figure 2 and Movies 1 and 2). This specific assay has rarely and not clearly been described in the literature17,18. Moreover, adhesion formation has mostly been investigated in e.g. migrating cells19,20. Thus, we needed to adapt this methodology (cell line, coating, medium, composition) in order to carry out the experiments described in this paper.
As expected, cells were round-shaped at the beginning and only weakly adherent, whereas membrane protrusions were sensing the environment and making contact with the substrate. Cell-matrix contacts strengthened quickly upon formation of so-called nascent adhesions20,21 (Figure 2A, TIRF-488 channel, time points 0-4.5 min). The latter are spot-like, Vinculin-positive structures at the ventral side of the cell. The structures were clearly visible in the TIRF images. In the beginning of adhesion formation, actin was evenly distributed in the cell and did not localize to these early complexes (Figure 2A, SD-561 channel). Over the course of time, adhesion complexes enlarged and matured to focal adhesions (Figure 2C). These elongated structures were predominantly apparent at the periphery of the cell (Figures 2A+B) and resulted from forces that were exerted by acto-myosin fibers. These fibers started to connect to the adhesion complexes, thereby pulling them towards the cell center and inducing the strengthening of cell-matrix adhesions as well as the bundling of actin fibers21. Apparently, the cell also flattened as a result of actin network formation (Figure 2A, XZ view). SD-imaging proofed to be the method of choice here, as it allowed visualizing this process with high sensitivity, spatial resolution and from a complete perspective. In a previous report17, TIRF alone could only let speculate about the origin of peripheral adhesions, whereas SD-TIRF imaging clearly revealed its association with filopodia (Figure 2B, time point 17 min, white arrowhead). Indeed, actin fibers emerging centripetally from focal adhesions became visible after 27 min (Figure 2B, yellow arrowhead).
However, the acquisition settings of these experiments, i.e. acquisition speed, excitation intensity and detector gain, need to be carefully evaluated. The interval of 30 s/timepoint, enabling multi point acquisition, appears to be ideal, while the radiation intensity of the excitation laser (between 0.5-1 W/cm²) needs to be taken under critical consideration. Figure 2D displays a cell at a different position in the same experiment that failed to attach to the substrate. It might be possible that phototoxic effects affected the biology of the cell here, which finally resulted in membrane bubbling after circa 60 min, probably resembling apoptosis (Movie 2). This made again clear how sensitive cells can react to phototoxicity and that it is important to find a good balance between the amount of light put in and the information being taken out. Reducing the laser power, the number of images in a z-stack or increasing the gain might be the correct strategy for reducing phototoxicity. All these settings, however, should be adjusted at a level that still allows achieving enough resolution and signal to noise ratio, enabling to extract quantitative information from the recorded time lapse.
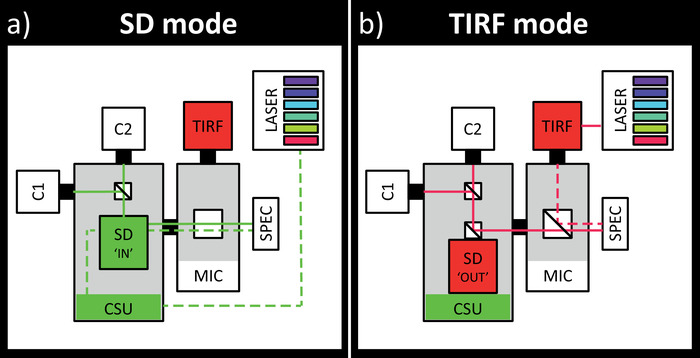
Figure 1: Schematic drawing of the SD-TIRF setup. A. SD imaging mode: the 6 different laser lines (405/445/488/515/561/640nm, green lines) are coupled into the confocal scanning unit (CSU), passing through the SD (position 'IN') and an empty filter cube in the microscope body (MIC). Fluorescence emission from the specimen (SPEC) is projected through the pinholes of the SD and split by different dichroic mirrors, e.g. for green/red or yellow/cyan simultaneous acquisition, onto two different EM-CCD cameras (C1 and C2). Fluorescence filters are placed in front of the cameras (not shown). B. TIRF imaging mode: the laser lines are coupled into the TIRF scanner (TIRF). A multi-line beam splitter in the MIC directs the beam to the specimen and the emission light bypasses the SD ('OUT') for maximized transmission. Fluorescence is detected by the same cameras and emission filters described in A. This figure has been modified from Zobiak et al.7 Please click here to view a larger version of this figure.
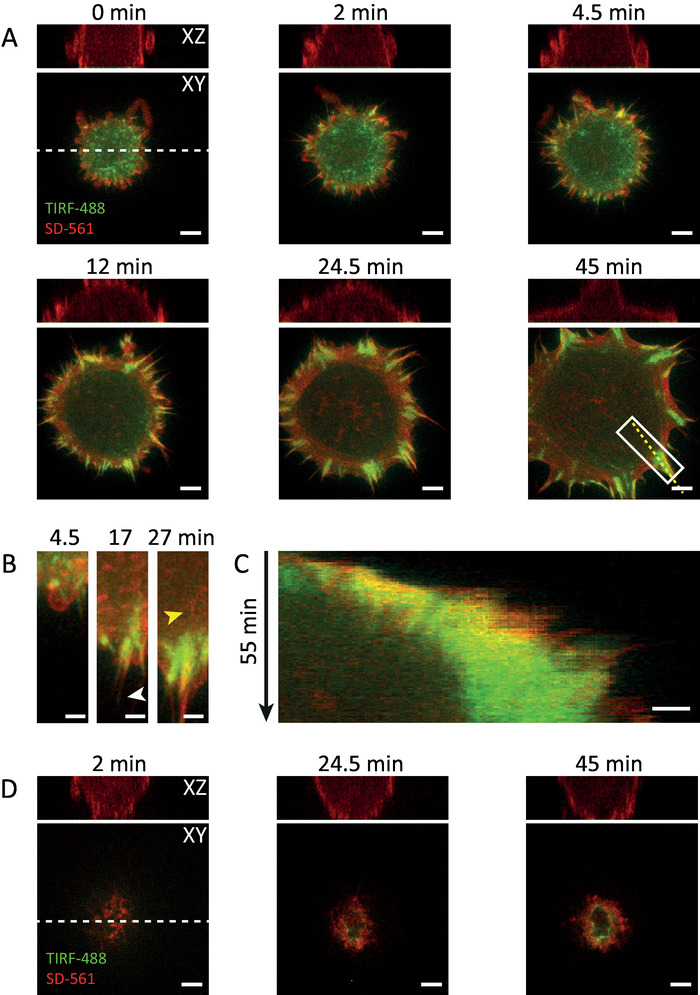
Figure 2: Representative results of cell spreading and adhesion formation using SD-TIRF microscopy. A. Double-transfected HeLa cell expressing RFP-Lifeact (red, SD-561 channel) and YFP-Vinculin (green, TIRF-488 channel) were trypsinized and re-seeded onto fibronectin-coated glass coverslips. Adhesion formation becomes readily visible, starting with small nascent adhesions (Vinculin-positive spots) at 0 minutes that develop into larger focal adhesions after circa 5 minutes. Cortical actin is apparent after circa 10 minutes and extends at the periphery of the cells (see frames at 12 and 24.5 minutes). B. The magnified view of the boxed region in A (frame at 45 minutes) depicts cell spreading and the transition from nascent to focal adhesions as well as filopodia-associated adhesions (white arrowhead) and stress fiber formation (see frame at 27 minutes, yellow arrowhead). C. Kymograph of the dashed yellow line drawn in A. D. (Photo-) Toxic effects on cells or otherwise unhealthy cells can let them fail to attach to the substrate. Imaging conditions have to be critically evaluated in order to exclude phototoxicity. Scale bar = 5 µm (in A and D) and 2 µm (in B and C). The XZ views in A and D are the orthogonal projections extracted from the dashed white lines drawn therein (bottom = substrate). Images were linearly contrast-enhanced and median-filtered with a 3×3 kernel. Please click here to view a larger version of this figure.
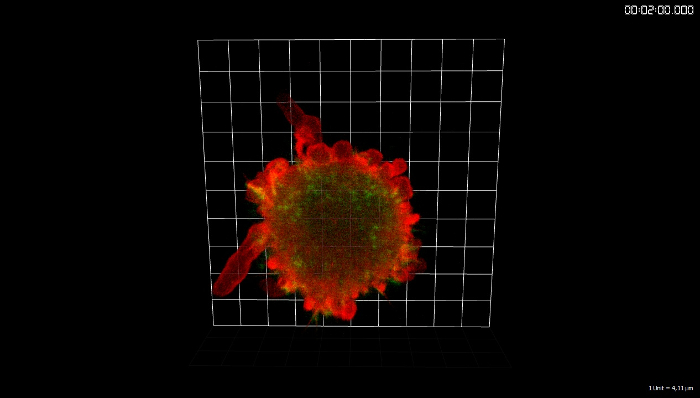
Movie 1: 3D-reconstruction of the timelapse sequence in Fig. 2A. The image sequence was rendered with 3D imaging software. Duration: 42.5 min. Acquisition rate: 2 dual-channel SD-TIRF stacks per minute (56 frames in total) were acquired. Please click here to view this video. (Right-click to download.)
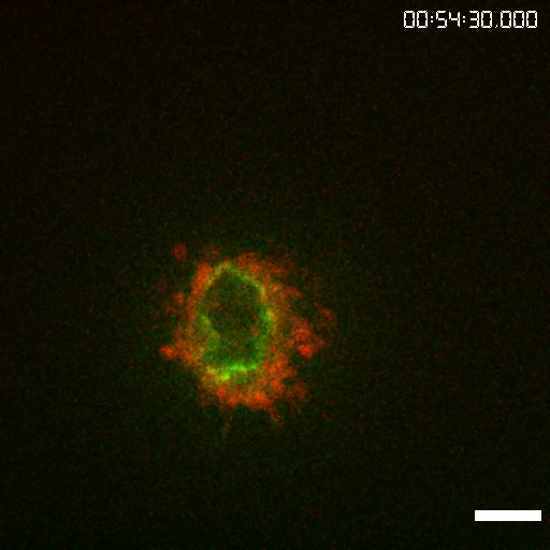
Movie 2: Movie of the timelapse sequence in Fig. 2C. Duration: 60 min. Acquisition rate: 2 dual-channel SD-TIRF stacks per minute (56 frames in total) were acquired. Please click here to view this video. (Right-click to download.)
In this paper was presented the first successful implementation of SD and TIRF microscopy in a configuration suitable for performing live cell imaging experiments, i.e. high acquisition rates such as 2 SD-TIRF image stacks per minute at 3 different stage positions, corresponding to a total of 168 frames (circa 3 frames per second), were acquired. The few SD-TIRF microscopes that were described previously12,13, mainly lack of sufficiently high imaging speed to follow cellular processes in 3D in which a temporal resolution of less than 2 s per image stack is often necessary. The presented setup can achieve imaging rates up to 0.78 image stacks per second, and rates of 3.5 s per large image stack in live experiments investigating 3D vesicle dynamics have been demonstrated7. Additionally, previous SD-TIRF microscopes had only one detector per imaging mode, reducing further the speed for multi-channel acquisitions. Technically, in those systems a split-view configuration could be implemented that also allows simultaneous dual-color acquisition with a single camera. This, however, would permit imaging of only half of the field of view. Other methods to produce multi-dimensional datasets with high spatio-temporal resolution such as widefield imaging combined with deconvolution or 3D super-resolution microscopy, i.e. 3D SIM or lattice light sheet microscopy22,23, might be valid alternatives. However, deconvolution-based imaging can easily introduce image artifacts in low signal-to-noise ratio acquisitions (as it is often the case during live imaging applications), and super-resolution 3D live imaging is still a technically elaborative and challenging task. In the presented realization of an advanced SD-TIRF setup7, advantage was taken of a SD unit that allows moving the dual-disk in and out of the detection path. This configuration provides two major benefits: first, the same two cameras can be used to detect the SD and TIRF signal, which results in a high-precision overlap of these two channels. Second, the pinholes of the spinning disk do not block any emission light when operating in TIRF acquisition mode (for more details, see Figure 1B), thus increasing the collection efficiency important for high-sensitive live imaging. Hence, this optical configuration is favorable for implementing any kind of TIRF microscopy (e.g. variable or fixed angle illumination) into existing SD-microscopes that allow bypassing the SD unit. Furthermore, the used TIRF scanner can be run in so-called time-sharing mode, where two TIRF channels can be recorded simultaneously (as shown in Zobiak et al.7), speeding further up the acquisition of multi-channel data.
One of the biggest advantages of employing TIRF is that, with this methodology, it is possible to localize with highest precision the signal coming from the cell membrane during a life cell imaging experiment. Indeed, while a methodology like SIM provides a better z-sectioning and thus better isolation of the cell membrane in fixed samples, in live cell imaging experiments the exponential increasing/decreasing of the fluorescence signal from organelles approaching/leaving the TIRF interface allowed more specific and precise localization of the cell membrane. The localization precision, although not still quantified, promises to be many folds smaller than 150-200 nm, i.e. the spatial range of the evanescence field.
Presently a limitation of the method is the time necessary to remove the spinning disk unit from the light path and start the TIRF acquisition, i.e. 0.5 s. This delay limits the minimum time interval between two consecutive acquisitions. Technically, it should be possible to reduce this delay through bypassing the disk with e.g. galvo-mirrors and thus decreasing the overall acquisition per SD-TIRF cycle. Also, newer generation cameras might allow reduced exposure times at high signal-to-noise ratio. Hence, the overall performance of this setup can be still relevantly improved by upgrading the hardware components. From the imaging point of view, however, there are several other ways to minimize the acquisition time (in descending order): avoid multiple positions, reduce the z-stack height, increase the z-spacing, minimize exposure time (increase gain and possibly use binning), shorten the distance between acquisition positions, activate the auto-focusing only every n-th time point (n>1). Despite actual limitations, if all those parameters are carefully evaluated, it is possible to use SD-TIRF imaging for tracking and localizing fast moving cellular vesicles, as presented in Zobiak et al.7.
Moreover, in this paper a protocol that describes the acquisition routine of a single-channel SD-TIRF dataset was presented. Using the provided macro, raw data can be exported in a single TIFF-file containing all SD- and TIRF channels. Image registration is per se not necessary; however, it is important that both cameras are precisely aligned with respect to each other. Remaining pixel shifts (translation and rotation) can be detected and corrected within the provided macro. The correction algorithm makes use of a multi-channel reference image of fluorescent beads that has to be recorded just before starting the experiment. In the resulting file, the TIRF plane is set at lowest level followed by a number of zero intensity planes that are matching the dimensionality of the SD-channel. Therefore, it is important to acquire the data, as outlined in the protocol, where the imaged TIRF plane resembles the lower end of the z-stack set for the SD channel.
Finally the system could be potentially extended by a SIM module or the recently introduced multi-angle TIRFM24,25 to further increase the spatial resolution. However, increasing of spatial resolution can be achieved, according to the current state of the art, only at the cost of a slower imaging speed. For all the live cell imaging experiments in which it is crucial to localize structures at the plasma membrane albeit maintaining high spatial resolution of the remaining cellular volume, the here described SD-TIRF setup is an easy to integrate, readily available solution.
The authors have nothing to disclose.
We greatly thank the scientific community of the University Medical Center Hamburg-Eppendorf for supporting us with samples for evaluation. Namely, we thank Sabine Windhorst for NIH3T3 cells, Andrea Mordhorst for YFP-Vinculin and Maren Rudolph for RFP-Lifeact.
Microscope and accessories | |||
SD-TIRF microscope | Visitron Systems | ||
Ti with perfect focus system | Nikon | Inverted microscope stand | |
CSU-W1 T2 | Yokogawa | Spinning disk unit in dual-camera configuration | |
iLAS2 | Roper Scientific | TIRF/FRAP scanner | |
Evolve | Photometrix | EM-CCD cameras | |
PiezoZ stage | Ludl Electronic Products | Motorized Z stage | |
Bioprecision2 XY stage | Ludl Electronic Products | Motorized XY stage | |
Stage top incubation chamber | Okolab | Bold Line | Temperature, CO2 and humidity supply |
Cell culture | |||
HeLa cervical cancer cells | DSMZ | ACC-57 | |
NIH3T3 fibroblasts | DSMZ | ACC-59 | |
Dulbecco's phosphate buffered saline (PBS) | Gibco | 14190144 | |
Trypsin-EDTA 0.05% | Gibco | 25300054 | |
Dulbecco's Modified Eagle Medium + GlutaMAX-I (DMEM) | Gibco | 31966-021 | |
OptiMEM | Gibco | 31985070 | Reduced serum medium |
Fetal calf serum (FCS) | Gibco | 10500064 | |
Penicillin/Streptomycin (PenStrep) | Gibco | 15140148 | |
Full growth medium (DMEM supplemented with 10% FCS and 1% PenStrep) | |||
TurboFect | ThermoFisher Scientific | R0531 | Transfection reagent |
Ascorbic acid (AA) | Sigma | A544-25G | |
6-well cell culture plate | Sarstedt | 83.392 | |
Glass bottom dishes | MatTek | P35G-1.5-10-C | 35mm, 0.17mm glass coverslip |
Fibronectin, bovine plasma | ThermoFisher Scientific | 33010018 | |
Neubauer improved chamber | VWR | 631-0696 | |
TetraSpeck beads | ThermoFisher Scientific | T7279 | |
Plasmids | |||
RFP-Lifeact | Maren Rudolph, Institute of Medical Microbiology, University Medical Center Hamburg Eppendorf, Germany | ||
YFP-Vinculin | Andrea Mordhorst, Institute of Medical Microbiology, University Medical Center Hamburg Eppendorf, Germany | ||
Software and plugins | |||
VisiView | Visitron Systems | Version 3 | |
ImageJ | Version 1.52c | ||
Turboreg plugin | http://bigwww.epfl.ch/thevenaz/turboreg/ | ||
Macro "SD-TIRF_helper_JoVE.ijm" | this publication | https://github.com/bzobiak/ImageJ | |
Volocity | PerkinElmer | Version 6.2.2 |