A Spheroid Killing Assay by CAR T Cells
Summary
This protocol is designed to assess immunotherapeutic redirected T-cell (CAR T-cell) cytotoxicity against 3D structured cancerous cells (spheroids) in real time.
Abstract
Immunotherapy has become a field of growing interest in the fight against cancer otherwise untreatable. Among all immunotherapeutic methods, chimeric antigen receptor (CAR) redirected T cells obtained the most spectacular results, in particular with pediatric B-acute lymphoblastic leukemia (B-ALL). Classical validation methods of CAR T cells rely on the use of specificity and functionality assays of the CAR T cells against target cells in suspension and in xenograft models. Unfortunately, observations made in vitro are often decoupled from results obtained in vivo and a lot of effort and animals could be spared by adding another step: the use of 3D culture. The production of spheroids out of potential target cells that mimic the 3D structure of the tumor cells when they are engrafted into the animal model represents an ideal alternative. Here, we report an affordable, reliable and easy method to produce spheroids from a transduced colorectal cell line as a validation tool for adoptive cell therapy (exemplified here by CD19 CAR T cells). This method is coupled with an advanced live imaging system that can follow spheroid growth, effector cells cytotoxicity and tumor cell apoptosis.
Introduction
Adoptive cell transfer (ACT) represents the next generation cancer treatment. It relies on the injection of effector cells (T- or NK-cells) into a patient. These cells can be genetically modified with a receptor that will guide them to their target, the tumor, and destroy it. Recently this approach was shown to be feasible when a Chimeric Antigen Receptor (CAR) directed against the B-cell marker CD19 was introduced into the patient T cells to kill his/her cancer1. In the case of CAR, which is an artificial receptor, the design consists of specific antibody fragments, the antigen binding domain reduced to an entity designated single chain variable fragment (scFv), linked to the T-cell signaling domains. Although there are several designs, the most commonly used versions referred to as second-generation CAR designs, consist of CD3z for TCR signaling and one co-stimulatory domain (CD28, 4-1BB, OX40, etc.)1,2. The immunotherapy field directed most of its attention to this new form of ACT when CD19 CAR-T cells efficaciously treated numerous patients with B cell malignancies3,4. Following this success, researchers tried to exploit the similar designs by targeting other epitopes for solid tumors with limited success. Unfortunately, the scarcity of tumor specific antigens and the harsher tumor microenvironments rendered CAR T cells less effective towards solid tumors5.
Currently, the most commonly used in vitro validation strategies rely on two-dimensional (2D) systems that only address a fragment of the already mentioned solid tumor challenges. Classically, 2D in vitro systems involve a mixture of CAR T cells and target cancer cell lines as monolayers to assess the functionality and specificity of these effector cells. Although these strategies are important and vital parts of the studies, they do not take into consideration the complex morphology and three-dimensional (3D) structure of the cancer cells6. Cancer cells cultured in 3D systems, referred to as spheroids, acquire new phenotypic traits through changes in gene expression profile7, which might influence the recognition by redirected effector cells. Birgersdotter and colleagues demonstrated that a Hodgkin lymphoma (HL) cell line when only grown in a 3D culture model acquires a gene expression profile that is similar to primary tumor samples8. Therefore, spheroids or similar 3D culture methodologies offer more relevant in vitro models as opposed to standard 2D systems. Such systems are also similar to in vivo studies which are seen as the final step in the validation process of a given CAR. Considering that 2D systems fail to mimic the morphology of cancer clusters, spheroids offer similar formations to assess the functionality of CAR T cells prior to in vivo models. In one study, Pickl et al. identified that a spheroid model of human epidermal growth factor receptor (HER2) overexpressing cancer cells demonstrated similar signaling profiles to in vivo models9. This further supports that spheroids offer more relevant and close-to-in vivo assessment of the CAR T cells. Additionally, CAR T-cell validation against spheroids might help assess their efficacy more critically and prevent some of the designs from moving to in vivo studies prematurely10; thus, contributing to ethically concerned research by sacrificing fewer animals. Moreover, protocols using spheroids are not more expensive than classical 2D systems and much faster as compared to classical in vivo studies. Taken together, one can predict that the inclusion of spheroid studies will soon become standard practice to link in vitro and in vivo studies.
Here, we present the preparation of spheroids from the colon cancer cell line HCT 116. This cell line was modified to express the human CD19 molecule to render it sensitive to CD19 CAR T cells and to provide a clear assessment of the killing using a clinically validated CAR construct.
Protocol
1. Generation of Spheroids from Colorectal Cancer Cell Line
- Wash HCT 116 (stably transduced to express Cluster of Differentiation 19 (CD19) and Green Fluorescence Protein (GFP)) cell monolayers with phosphate buffered saline (PBS; 5 mL for a 25 cm2 or 10 mL for a 75 cm2 flask). Add trypsin (0.5 mL for a 25 cm2 or 1 mL for a 75 cm2 flask) and incubate cells at 37 °C for 5 min.
- Check cell detachment under a microscope and neutralize cell dissociation enzyme with complete Roswell Park Memorial Institute 160 medium (RPMI 1640) (RPMI 1640 + 10% FCS + Gentamycin; 10 mL for a 25 cm2 or 20 mL for a 75 cm2 flask).
- Centrifuge cell suspension at 500 x g for 5 min. Remove supernatant using a pipette and resuspend by pipetting up and down several times with 5 mL of complete RPM1 1640 medium.
- Count cells using Trypan blue exclusion on a compatible cell counter.
- Centrifuge cell suspension at 500 x g for 5 min. Remove supernatant using a pipette and resuspend in RPMI medium to obtain 5 x 10³ cells/mL.
- Coat a 96-well round bottom plate with 100 µL/well of 100 µg/mL of poly-L-lysine (PLL) in PBS during 1 hour at room temperature. Wash twice with PBS and let the plate dry.
- Transfer the cell suspension to a sterile reservoir and dispense 200 µL/well into the PLL-coated 96-well round bottom plates using a multichannel pipette.
- Transfer the plate to the automated imaging apparatus inside an incubator (37 °C, 5% CO2, 95% humidity).
- Log into the acquisition software, select Schedule To Acquire | Launch Add Vessel | Scan On Schedule | Create Vessel: New.
- Select Scan Type: Spheroid. Select the channels of interest: Phase + Brightfield (to follow spheroids growth), Green (to follow tumor signal, acquisition time 300 ms) and Red (to follow apoptosis, acquisition time 400 ms).
- Select the desired magnification: 10x.
- Pick the plate model and its position in the drawer. Select the position of wells to image. Enter the description of the experiment: name, type of cells, number of cells.
- For the analysis setup, select Defer Analysis Until Later. Right click on the timeline and select Set Selected Scan Group Interval option and set Add scans every to 4 h and For a total of to 24 h. Set the desired starting time (at least 1 h after incubation in the automated imaging apparatus).
- Check every 2 days for the growth of spheroids by logging into the imaging software.
- Pick the View Recent Scans option and double-click on the desired experiment. Select Brightfield in the image channels panel and then use the Measure image features tool to measure the diameter of the spheroids. It takes 6 days for a spheroid to reach the desired size: 0.5 mm of diameter. Add 50 µL of complete RPMI medium per well at day 4 to limit medium evaporation effect.
2. Generation of CD19 CAR T cells
- Expansion of CD19 CAR T cells
NOTE: Stable expression of CD19 CAR T cells was acquired by bulk retroviral transduction of the healthy donor PBMCs as previously described16. The retroviral construct coding for CD19 CAR is a second-generation CAR and consists of fmc63 scFv chain, CD8 hinge and transmembrane domain, a 4-1BB co-stimulatory domain and finally a CD3ζ domain.- To expand, culture the transduced T cells in the presence of anti-CD3/28 magnetic beads with a cell to bead ratio of 1:1 for 10–11 days. During the expansion, cells are in complete medium (X-VIVO 15, 5% Serum Replacement, and 100 U/mL recombinant human IL-2).
NOTE: The ideal density for an efficient expansion is 1 to 2 x 10⁶ cells/mL. Depending on the initial number, cells can be expanded in flasks (25 cm2 flasks to 20 mL, 75 cm2 flasks to 40 mL of total volume) in a cell culture incubator (37 °C, 5% CO2, 95% humidity). - As a negative control group for the following assays, include non-transduced PBMCs (will be referred as Mock) to the expansion protocol parallel to the CD19 CAR T cells.
- On day 3 and onwards, add fresh medium every day and divide the cells into more culture flasks if necessary.
- On day 10–11, centrifuge cells at 500 x g for 5 min. Remove supernatant and combine all the cells into one 50 mL tube and resuspend the cells in ~30 mL of fresh complete media.
- Place the 50 mL tube containing the resuspended cells on a magnetic stand to separate the magnetic beads from the culture medium.
- Wait for 2–3 min for the beads to collect on the side of the tube.
- Remove the culture medium with a pipette and transfer to a new tube without touching the magnetic bead collection zones.
- Repeat steps regarding the bead removal (2.1.5–2.1.7) once more to limit the number of beads in the final culture medium.
- Resuspend and count the cells, adjust the density to 1 to 2 x 10⁶ cells/mL in complete medium.
- Rest the cells for at least 4 h up to overnight. Then directly freeze them down at -80 °C and transfer the vials to a liquid nitrogen tank on the following day for long-term storage. Alternatively, one can prolong the rest up to overnight for immediate use.
- To expand, culture the transduced T cells in the presence of anti-CD3/28 magnetic beads with a cell to bead ratio of 1:1 for 10–11 days. During the expansion, cells are in complete medium (X-VIVO 15, 5% Serum Replacement, and 100 U/mL recombinant human IL-2).
- CD19 CAR expression control on primary T cells
- Count the number of expanded T cells as the numbers might vary slightly after overnight culture or moderately after freeze/thaw.
- Transfer 5 x 10⁵ cells from both CD19 CAR and Mock primary T cells to separate flow cytometry tubes.
- Wash the cells with 200 μL of Flow Buffer (2% FBS in PBS) and centrifuge the tubes at 500 x g for 5 min. Repeat the washing steps to get rid of any artifacts caused by the culture medium.
- Prepare the primary antibody (Biotin Goat Anti-Mouse IgG, F(ab')₂ Fragment Specific) by performing 1:200 dilution in Flow Buffer.
- Resuspend the cells in 100 μL of antibody mix per tube and incubate on ice for 15 min. Repeat the previous washing step twice to remove excess antibody.
- Prepare the secondary antibody (Streptavidin-PE) as 1:400 dilution in Flow Buffer.
- Resuspend the cells in 100 μL of antibody mix per tube and incubate on ice for 15 min. Repeat the previous washing step twice to get rid of excess antibody.
- Resuspend the cells in 200 μL of Flow Buffer per tube and analyze it on a flow cytometer.
- Use Mock T cells to set up the negative and positive gate and analyze CD19 CAR transduced T cells accordingly.
3. 3D Tumor Spheroid Killing Assay
- After 6 days or once spheroids reach the desired size, remove the plate from the incubator. Using a multichannel pipette, gently remove 100 µL/well of complete RMPI 1640 medium from the spheroid plates.
- For this step, angle the tips towards the inside wall of the 96-wells plate, avoiding contact with the bottom of the well in order to minimize disturbance of the spheroids. Remaining volume should be around 100 µL.
- Prepare a 1:200 solution of Annexin V red by mixing 50 µL of Annexin V red with 9.95 mL of complete RPMI 1640 medium.
- Add 100 µL/well of the 1:200 Annexin V red solution.
- Transfer the plate to an incubator (37°C, 5% CO2, 95% humidity) for 15 min.
- Harvest the transduced CAR CD19 T cells in a 15 mL tube and centrifuge them at 500 x g for 5 min. Remove the supernatant using a pipette and resuspend by pipetting up and down several times with 2 mL of complete RPM1 1640 medium.
- Count cells using Trypan blue exclusion on a compatible cell counter.
- Centrifuge cell suspension at 500 x g for 5 min. Remove supernatant using a pipette and resuspend in RPMI medium to obtain 2 x 10⁵ cells/mL.
- Transfer the cell suspension to a sterile reservoir and dispense 100 µL/well into a 96-well round bottom spheroid plate using a multichannel pipette.
- Transfer the plate back to the automated imaging apparatus inside an incubator (37 °C, 5% CO2, 95% humidity).
- Log into the acquisition software, select Schedule To Acquire.
- Right-click on the Scan timeline and select Edit Timeline. Right-click on the scan group and delete it. Right-click on the timeline and select Set Selected Scan Group Interval option and set Add scans every to 1.5 h and For a total of to 24 h.
- Set the desired starting time (at least 1 h after incubation in the automated imaging apparatus). Select Save schedule scans.
4. Automated Image Analysis
- Log into acquisition, pick the View Recent Scans option and select Launch Analysis option. Select Create New Analysis Definition | Analysis Type: Spheroid. Tick the Image channels to analyze (Phase + Brightfield, Green and Red).
- Select at least 10 representative images: typically, 1 per condition and at least 3 time points (beginning, middle and end of the acquisition).
- Preview the default analyze procedure on the whole image stack.
- Modify the parameters for brightfield mask. Typical parameters are: Sensitivity 10, Hole fill 1,000 µm2, min area 1,000 µm2. Preview on the whole image stack and check that the selected parameters detect the spheroids accurately.
- Modify the parameters for green mask (GFP). Typical parameters are: Top hat segmentation with radius 200 µm and threshold 3 GCU, Edge split off, Hole fill 5,000 µm2, Adjust size -2 pixels, Area min 3,000 µm2. Preview on the whole image stack and check that the selected parameters detect the spheroids accurately.
- Modify the parameters for red mask (Annexin V). Typical parameters are: Top hat segmentation with radius 150 µm and threshold 2 GCU, Edge split off, Hole fill 5,000 µm2, Adjust size 0 pixels, Area min 1,000 µm2. Preview on the whole image stack and check that the selected parameters detect the spheroids accurately.
- Launch the analyzer.
- Once the analysis is done, extract the measurement of interest. Select the analyzed file and then the Graph Metrics option. Select the metrics of interest, the scan and the well. Typically, total red and green intensity within brightfield boundaries give the most accurate measurements by restricting the signal of fluorescence to the spheroids boundaries determined by the brightfield mask (Figure 3). Extract selected metrics in several file format by clicking on “Export Data”.
- Proceed to the extraction of the images and movies by selecting the analyzed file and then select the Export Images and Movies option. Two options are available, either “As Displayed” to retrieve images and movies as seen on the imaging software (usually composite images), either “As Stored” to retrieve raw data for external analysis through third-part software.
Representative Results
As can be seen in Figure 1, it is crucial to check by flow cytometry the level of expression of CD19 CAR on T cells (Figure 1A) and the level of CD19 on HCT116 tumor cell lines (Figure 1B). Figure 2 exemplifies the outcome of a typical spheroid experiment. The automated imaging apparatus takes pictures in four different channels: bright field, phase, green and red fluorescence. Phase channel is used to assert the formation of spheroids by displaying highly contrasted boundaries near the spheroids (which is a sign of spheroid formation). Bright field is used during the analysis process to detect the size of the spheroids and restrict the green signal (tumor) and red signal (apoptosis) to the aforementioned boundaries. It allows one to not consider events directly unrelated to spheroids (for example isolated tumor cells and their apoptosis). Green and red outlines represent respectively green and red signals considered in the metrics calculation. In Figure 2, bright field, phase, green and red channels were extracted through the "As stored" option whereas Composite images were extracted through the "As displayed" option and are representative of the metrics displayed in Figure 3. As can be seen in Figure 2, unlike Mock T cells, CD19 CAR T cells were able to specifically kill the spheroids and greatly diminish the number of live tumor cells.
Figure 3 displays the evolution of total green and red signal measured within the spheroid boundaries over time. As can be seen, shortly after CD19 CAR T cell injection, the spheroids' size shrinks quickly (as measured by green fluorescence signal) and the apoptosis signal increases quickly (as measured by red fluorescence signal).
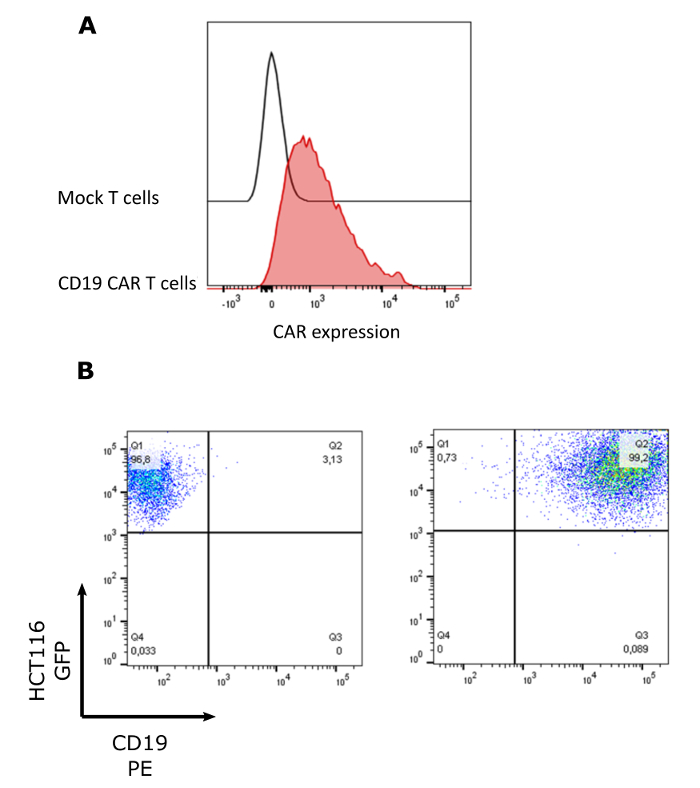
Figure 1: Surface expression of the CD19 CAR and CD19. (A) Surface expression of CD19 CAR on retrovirally transduced T-cells. Cells were analyzed by flow cytometry prior to the spheroid assay via anti-mouse-Fab biotinylated as primary and anti-Streptavidin-PE as secondary antibody. (B) Surface expression of CD19 on retrovirally transduced HCT116 cells. Please click here to view a larger version of this figure.
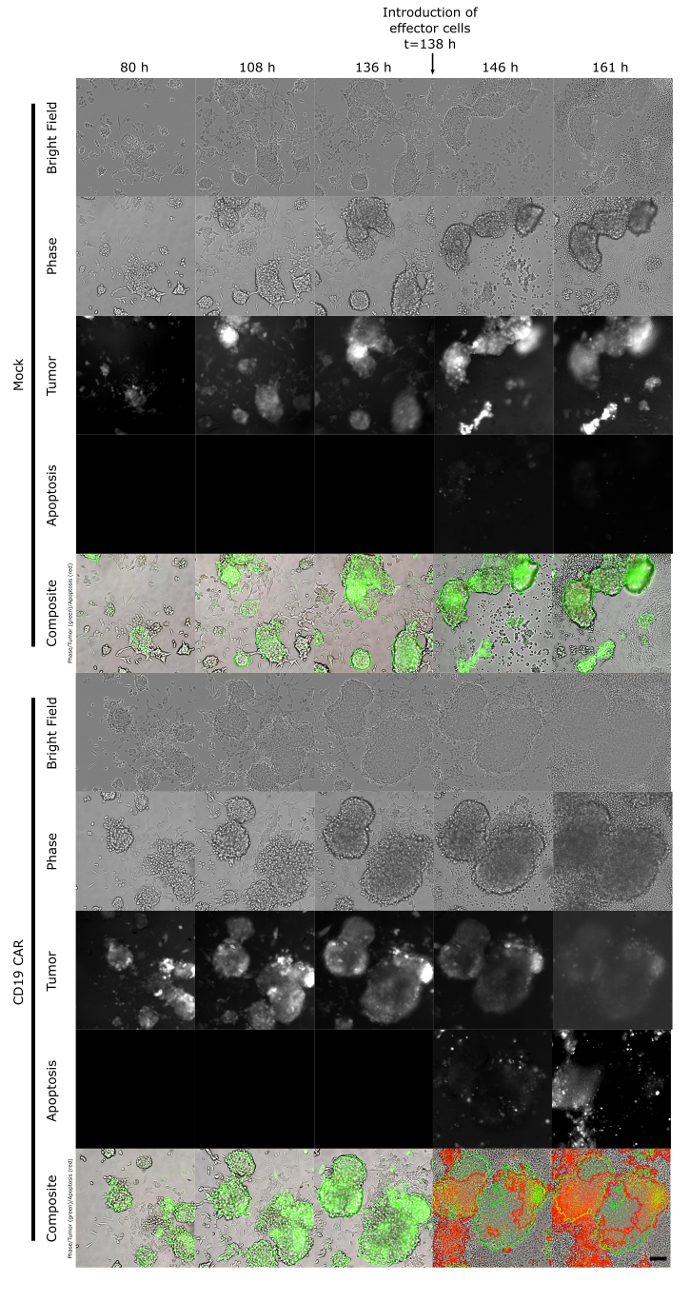
Figure 2: Assessment of CD19 CAR T-cell cytotoxicity against tumor spheroids. Time lapse of HCT116 spheroid growth; at t=138 h, Mock or CD19 CAR T cells were introduced at a density of 20000 cells/well. Green signal corresponds to HCT116 GFP+ cells and green outline corresponds to the detected spheroid. Red signal corresponds to apoptosis as monitored by Annexin V and red outline corresponds to the detected apoptosis events. Please click here to view a larger version of this figure.
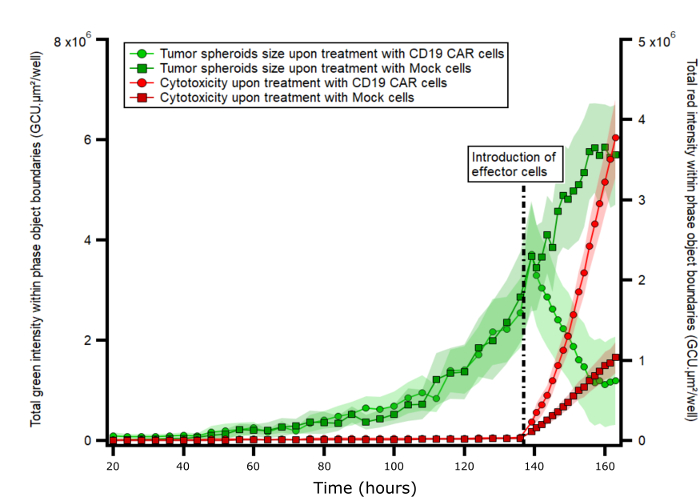
Figure 3: Measurements of total red and green signal within brightfield mask boundaries over time. Total red and green signals within brightfield mask metrics were obtained after analyzed and plotted as a function of time. Dashed line corresponds to the introduction of effector cells (CD19CAR or Mock T-cells). Measure corresponds to the mean ± SEM (n=12). Please click here to view a larger version of this figure.
Discussion
The use of spheroids as an innovative tool to validate future cancer treatment has become a field of growing interest in the past years. Spheroids represent an intermediate step between classical 2D in vitro analysis and in vivo assessment. The method further holds a lot of promise regarding their potency in terms of tumor micro-environment mimicking as well as gene profiling7. The protocol presented in this publication was adapted from Saheen et al.11 to the Incucyte S3 and represents an affordable and easy method to produce 3D tumor spheroids from colorectal cell lines. Coupling spheroid generation to a high-throughput imaging device permits reliable and fast screening of a wide range of anti-tumor agents and monitor the ability of the aforementioned agent to destabilize tumor structure.
There are several critical steps to take into consideration regarding this protocol. First, the starting number of tumor cells needs to be adjusted precisely. If the starting cell density is too high, the cells will degrade the PLL coating rapidly and will start to form an adherent monolayer. On the other hand, a low number of cells will introduce a high variability in terms of spheroid size and the number of spheroids per well. Second, the use of an automated imaging device is exposing cells to potential phototoxicity (especially if several fluorescence channels are used); it is recommended to adjust the image frequency to minimize the damage to the spheroids. It is a critical parameter to consider in order to capture the events of interest reliably (an image every 4 hours before effector cell introduction and one every 90 min after represents the best compromise to our knowledge). Third, we recommend being particularly careful to avoid medium evaporation that can occur a few days after effector cell introduction. Fourth, the number of effector cells needs also to be adjusted precisely: the desired number needs to be high enough to kill tumor spheroids efficiently but also as low as possible to allow the highest potential for optimal imaging process. Fifth, in a typical experiment, a well contains 2 to 4 spheroids that can coalesce into one; it is recommended to pay attention to potential spikes that may erupt in the metrics following this event and to disregard them. Sixth, on a 96-well plate, in average 20 to 50 wells contain spheroids in desired number and size; we recommend checking the wells to be considered for analysis before the introduction of the effector cells as it will save computation time. Finally, the analysis is partially automated but necessitates some inputs from the user regarding the different parameters. It is highly recommended to take particular care in this step and to focus on a balance between sensitivity and specificity. If the type of effector cells/drug treatment differs widely within one experiment, it might be necessary to run different types of analysis to select the one that suits the best.
This method is so far only limited to a certain type of adherent cell line (in this publication HCT 116); further development is required to generalize this protocol to every cancerous cell line. Although a wide range of methods is already available for a greater number of target cells12,13,14,15, most of them rely on the use of expensive and/or complex procedures. Our method, although limited to a few types of target cells so far, is interesting as it requires very limited inputs from the experimenter and permits a fast and easy screen of various drugs and/or immunotherapy treatments (here CAR CD19 cells). Its reliability and its ability to be adapted to different kinds of treatments make this method a powerful tool in the context of anti-cancer treatment validation process.
Divulgazioni
The authors have nothing to disclose.
Acknowledgements
This work was supported by the Norwegian Research Council under Grants #244388, #254817 and #284983; the Norwegian Cancer Society (#6829007); The Norwegian Health Region South East under Grant #17/00264-6 and #2016006.
Materials
| Dulbecco’s Phosphate Buffered Saline | SIGMA-ALDRICH | D8537-500ML | Lot Number: RNBG7037 |
| 75 cm² growth area flasks | VWR | 430639 | Lot Number: 2218002 |
| 75 cm² growth area flasks | VWR | 734-2705 | Lot Number: 3718006 |
| Trypsin-EDTA | SIGM-ALDRICH | T3924-100ml | Lot Number: SLBTO777 |
| RPMI 1640 med L-glutamin, 10 x 500 ml | Life Technology (Gibco) | 21875-091 | Lot Number: 1926384 |
| Fetal Bovine Serum | Gibco | 10500064 | Lot Number: 08Q3066K |
| Gentamicin | Thermo Fischer | 15750060 | Lot Number: 1904924A |
| Trypan Blue Solution, 0.4% | Thermo Fischer | 15250061 | Lot Number: 1886513 |
| 96 well plate, round bottom | VWR | 734-1797 | Lot Number: 33117036 |
| Dynabeads Human T-Activator CD3/CD28 | Thermo Fischer | 11132D | – |
| X-VIVO 15 with Gentamicin L-Gln, Phenol Red, 1 L | BioNordika | BE02-060Q | Lot Number: 8MB036 |
| CTS Immune Cell Serum Replacement | Thermo Fischer | A2596102 | Lot Number: 1939319 |
| IL-2 Proleukin | Novartis | Lot Number: 505938M | |
| IncuCyte Annexin V Red Reagent | Essen Bioscience | 4641 | Lot Number: 17A1025-122117 |
| Reagent Reservoir | VWR | 89094-672 | Lot Number: 89094-672 |
| 15 ml tubes | VWR | 734-1867 | Lot Number: 19317044 |
| anti-human CD19-PE | BD Biosciences | 555413 | Lot Number: 4016990 RRID: AB_395813 |
| Biotin-SP (long spacer) AffiniPure F(ab')2 Fragment Goat Anti-Mouse IgG | Jackson ImmunoResearch | 115-066-072 | Lot Number: 129474: RRID: AB_2338583 |
| Streptavidin-PE | BD Biosciences | 554061 | Lot Number: 5191579: RRID: AB_10053328 |
| HCT 116 Colorectal Carcinoma Line | ATCC | CCL-247 | – |
| Incucyte S3 | Essen Bioscience |
Riferimenti
- Porter, D. L., Levine, B. L., Kalos, M., Bagg, A., June, C. H. Chimeric antigen receptor-modified T cells in chronic lymphoid leukemia. New England Journal of Medicine. 365 (8), 725-733 (2011).
- Kochenderfer, J. N., et al. Eradication of B-lineage cells and regression of lymphoma in a patient treated with autologous T cells genetically engineered to recognize CD19. Blood. 116 (20), 4099-4102 (2010).
- Brentjens, R. J., et al. CD19-targeted T cells rapidly induce molecular remissions in adults with chemotherapy-refractory acute lymphoblastic leukemia. Science Translational Medicine. 5 (177), 177ra138 (2013).
- Grupp, S. A., et al. Chimeric antigen receptor-modified T cells for acute lymphoid leukemia. New England Journal of Medicine. 368 (16), 1509-1518 (2013).
- D’Aloia, M. M., Zizzari, I. G., Sacchetti, B., Pierelli, L., Alimandi, M. CAR-T cells: the long and winding road to solid tumors. Cell Death & Disease. 9 (3), 282 (2018).
- Amann, A., et al. Development of an innovative 3D cell culture system to study tumour–stroma interactions in non-small cell lung cancer cells. PLoS One. 9 (3), e92511 (2014).
- Enzerink, A., Salmenpera, P., Kankuri, E., Vaheri, A. Clustering of fibroblasts induces proinflammatory chemokine secretion promoting leukocyte migration. Molecular Immunology. 46 (8-9), 1787-1795 (2009).
- Birgersdotter, A., et al. Three-dimensional culturing of the Hodgkin lymphoma cell-line L1236 induces a HL tissue-like gene expression pattern. Leukemia & Lymphoma. 48 (10), 2042-2053 (2007).
- Pickl, M., Ries, C. H. Comparison of 3D and 2D tumor models reveals enhanced HER2 activation in 3D associated with an increased response to trastuzumab. Oncogene. 28 (3), 461-468 (2009).
- Galateanu, B., et al. Impact of multicellular tumor spheroids as an in vivo-like tumor model on anticancer drug response. International Journal of Oncology. 48 (6), 2295-2302 (2016).
- Shaheen, S., Ahmed, M., Lorenzi, F., Nateri, A. S. Spheroid-Formation (Colonosphere) Assay for in Vitro Assessment and Expansion of Stem Cells in Colon Cancer. Stem Cell Reviews and Reports. 12 (4), 492-499 (2016).
- Izraely, S., et al. The Metastatic Microenvironment: Melanoma-Microglia Cross-Talk Promotes the Malignant Phenotype of Melanoma Cells. International Journal of Cancer. , (2018).
- Khawar, I. A., et al. Three Dimensional Mixed-Cell Spheroids Mimic Stroma-Mediated Chemoresistance and Invasive Migration in hepatocellular carcinoma. Neoplasia. 20 (8), 800-812 (2018).
- Merker, M., et al. Generation and characterization of ErbB2-CAR-engineered cytokine-induced killer cells for the treatment of high-risk soft tissue sarcoma in children. Oncotarget. 8 (39), 66137-66153 (2017).
- Mittler, F., et al. High-Content Monitoring of Drug Effects in a 3D Spheroid Model. Frontiers in Oncolology. 7, 293 (2017).
- X Tadesse, F. G., Mensali, N., et al. Unpredicted phenotypes of two mutants of the TcR DMF5. Journal of Immunological Methods. 425, 37-44 (2015).
