Here, we describe the use of spectral-domain optical coherence tomography (SD-OCT) to visualize retinal and ocular structures in vivo in models of retinal degeneration, glaucoma, diabetic retinopathy, and myopia.
Spectral-domain optical coherence tomography (SD-OCT) is useful for visualizing retinal and ocular structures in vivo. In research, SD-OCT is a valuable tool to evaluate and characterize changes in a variety of retinal and ocular disease and injury models. In light induced retinal degeneration models, SD-OCT can be used to track thinning of the photoreceptor layer over time. In glaucoma models, SD-OCT can be used to monitor decreased retinal nerve fiber layer and total retinal thickness and to observe optic nerve cupping after inducing ocular hypertension. In diabetic rodents, SD-OCT has helped researchers observe decreased total retinal thickness as well as decreased thickness of specific retinal layers, particularly the retinal nerve fiber layer with disease progression. In mouse models of myopia, SD-OCT can be used to evaluate axial parameters, such as axial length changes. Advantages of SD-OCT include in vivo imaging of ocular structures, the ability to quantitatively track changes in ocular dimensions over time, and its rapid scanning speed and high resolution. Here, we detail the methods of SD-OCT and show examples of its use in our laboratory in models of retinal degeneration, glaucoma, diabetic retinopathy, and myopia. Methods include anesthesia, SD-OCT imaging, and processing of the images for thickness measurements.
Spectral-domain optical coherence tomography (SD-OCT) is a precise, high-resolution imaging modality that allows clinicians and researchers to examine ocular structures noninvasively. This imaging technique is based on interferometry to capture three-dimensional retinal images in vivo on a micrometer scale1,2. It has become one of the most frequently used imaging modalities in vision research and in the clinic due to the easy detection and accuracy of pathological features such as structural defects and/or thinning of retinal layers and subretinal fluid3. In research using animal models of vision-related disorders, SD-OCT has provided essential noninvasive analyses of relationships between structure and function and their histopathological origins4. Due to its resolution (up to 2-3 microns, depending on the depth into the eye5), SD-OCT has the capability to detect even small changes in retinal layer thickness. This type of analysis can provide essential information for disease progression and assess the efficacy of neuroprotective methods and treatments for vision-related disorders.
SD-OCT is a noninvasive alternative to examining structure histologically, and the two have been shown to be correlated6. While SD-OCT does not reach cellular resolution, it does allow for longitudinal studies in animals. This is advantageous because disease progression can be tracked in individual animals over time as opposed to having to euthanize animals at specific time points. As imaging techniques continue to improve, SD-OCT technology will also progress, providing enhanced image quality as well as the capability to assess biological processes such as retinal blood vessel function in fine detail. Even since its advent in 1991, SD-OCT technology has seen huge advances in resolution, speed, and sensitivity7.
The present study utilizes an SD-OCT system to quantify changes in retinal layers in rodent models of retinal degeneration, glaucoma, and diabetic retinopathy. The SD-OCT system used here is a Fourier-domain OCT-system that utilizes low-power, near-infrared light to acquire, process, and store depth-resolved images in real time. The SD-OCT system has extended depth-imaging capability in the 800 nm wavelength band, providing 8 mm depth and 4 µm resolution. In Fourier domain detection, the interference signal between scattered light from the tissue and a reference path is Fourier transformed to construct axial scans and/or axial depth profiles of scattered intensity8. For the studies here, the OCT beam is scanned over the desired retinal structure while serially acquiring axial scans. Typically, a scan pattern acquires the two-dimensional grid (B-Scans) as a collection of linear one-dimensional scan lines (A-Scans), which correspond to 2D cross-sectional images using a raster scan pattern. For studies focused on myopia in mice, this system is also used to measure dimensions of ocular structures (e.g., cornea thickness, lens thickness, vitreous chamber depth, and axial length).
The current system allows users to design their own protocols, creating scans that can be tailored and selected based on the ocular structures of interest. The principal scans featured in these user defined protocols makes this imaging technique user-friendly. For image analyses, we have developed customized programming in a mathematic modeling program. SD-OCT is a powerful tool to non-invasively identify and quantify pathomorphological changes in ocular structures and monitor vision-related disease progression.
All procedures described were approved by the Atlanta Veterans Affairs Institutional Animal Care and Use Committee and conformed to the National Institutes of Health guide for the care and use of laboratory animals (NIH Publications, 8th edition, updated 2011).
NOTE: The SD-OCT system used to develop the protocol below is described in the Table of Materials. While some of the procedures are specific to this particular system, the overall approach can be adapted for other OCT devices and animal models. Further, in our lab, these protocols are commonly used in mice and rats; however, the overall approach can be adopted to different animal models and SD-OCT devices provided an individual has the correct lens and capabilities on their device.
1. Set up the optical coherence tomography equipment
2. Anesthetize the animal
3. Rodent OCT imaging
4. Post-imaging steps
5. Post-processing of OCT images
SD-OCT is considered successful if high quality images are obtained such that ocular dimensions can be reliably measured. Here, a variety of uses of SD-OCT are illustrated using models of retinal degeneration, glaucoma, diabetic retinopathy, and myopia.
In a light-induced retinal degeneration (LIRD) model, exposure to bright light (10,000 lux) induces degeneration of photoreceptor cells in the retina9. Representative SD-OCT images reveal a thinner outer nuclear layer, which contains the photoreceptor cell bodies, in retinas from LIRD BALB/c mice compared with undamaged (control) mice (Figure 3A&3B). After quantifying the retinal layer thickness, a significant difference between undamaged and LIRD mice was observed for total retinal thickness (Figure 3C), outer nuclear layer thickness (Figure 3D), and IS/OS thickness (Figure 3E).
To experimentally model glaucomatous damage, we used a model of ocular hypertension (OHT)10. In brief, Brown Norway rats (n=35) received an injection of hypertonic saline into the limbus vein of one eye while the contralateral eye served as an internal control11. For glaucoma studies, we quantified retinal nerve fiber layer (RNFL) thickness. After 8 weeks of OHT, we observed distinct remodeling at the optic nerve head, including optic nerve cupping (Figure 4A&B). We then quantified RNFL thickness and found RNFL thinning after 8 weeks of OHT compared to baseline measurements (Figure 4C).
To model diabetic retinopathy, Goto-Kakizaki rats, a non-obese, polygenic model of diabetes that develops hyperglycemia as early as 2-3 weeks of age, were used12,13. Retinas from Goto-Kakizaki rats and Wistar rats (non-diabetic controls) were imaged using SD-OCT (Figure 5A&5B). At 6 weeks of age, RNFL and total retinal thickness were reduced in Goto-Kakizaki rats compared with Wistar rats in the central retina (data not shown) and the peripheral retina (Figure 5C&5D). The greatest differences were observed in the inferior and temporal quadrants of the retina (Figure 5C&5D).
To evaluate mouse models for myopia, axial length was measured in Bmal1-/- mice. Bmal1 is a clock gene of interest because circadian rhythms may play a role in myopia development14,15. The axial length of the Bmal1-/- mouse eye (Figure 6B) is visibly longer than the wild-type eye (Figure 6A) in the OCT images. Quantification of the axial length confirms that Bmal1-/- mice have significantly longer axial lengths at 84 days of age (Figure 6C), showing that the lack of the clock gene contributes to myopia development.
This protocol generated images of ocular structures in models of retinal degeneration, glaucoma, diabetic retinopathy, and myopia. Images were of sufficient quality such that ocular dimensions, including outer nuclear layer, retinal nerve fiber layer, total retinal thickness, and axial length, could be quantified. The results showed that significant differences in the dimensions of ocular structures could be observed in vivo using SD-OCT.
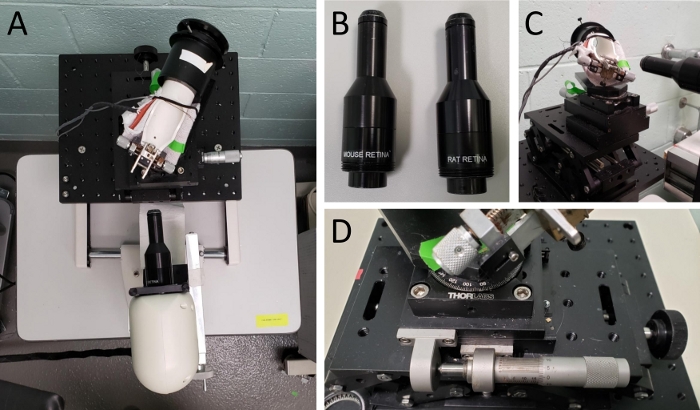
Figure 1: Setup of SD-OCT equipment.
(A) Picture of rodent alignment system and OCT scan head. (B) Picture of rat and mouse OCT lenses. (C) Picture of mouse rodent alignment system illustrating its ability to move in 3-dimensional space. (D) Close up of the rodent alignment system, specifically the knobs that control its movement. Please click here to view a larger version of this figure.
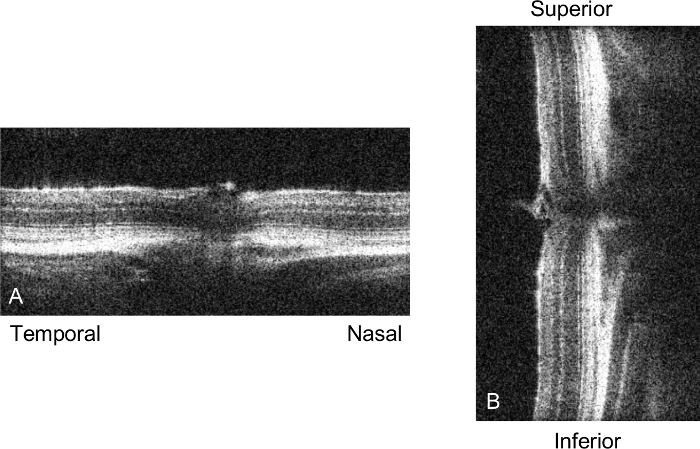
Figure 2: SD-OCT sample scan.
Picture of a live scan of the mouse retina just prior to taking a volume or radial scan. (A) depicts the nasal-temporal alignment, while (B) shows the superior-inferior alignment. Once the retinas in these two images are straight in their respective vertical or horizontal planes and the optic nerve is centered in both images, we proceed to acquire the SD-OCT image. Please click here to view a larger version of this figure.
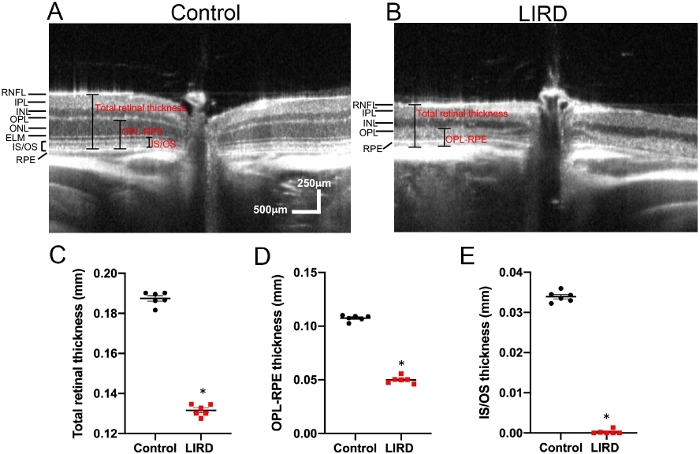
Figure 3: Using SD-OCT to track thinning of the photoreceptor layer over time in a mouse model of retinal degeneration.
(A) Representative SD-OCT scan of an undamaged (control) retina from a BALB/c mouse. (B) Representative SD-OCT scan of a retina from a light-induced retinal degeneration (LIRD) BALB/c mouse. (C-E) Quantification of total retinal thickness (C), outer nuclear layer (ONL) thickness (D), and inner segment/outer segment (IS/OS) thickness (E) in undamaged and LIRD Balb/c mice. Mean ± SEM. Please click here to view a larger version of this figure.
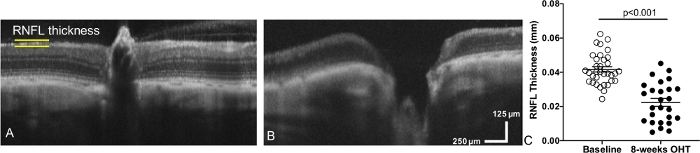
Figure 4: Using SD-OCT we measured a decrease in retinal nerve fiber layer thickness and observed optic nerve cupping after inducing ocular hypertension in a rat model of glaucoma.
(A) Representative SD-OCT scan of a retina and optic nerve head from a rat eye taken prior to inducing ocular hypertension (Baseline: OHT). (B) SD-OCT scan of the same rat retina after 8-weeks of OHT (experimental model of glaucoma). (C) Quantification of retinal nerve fiber layer (RNFL) thickness at baseline compared to OHT eyes. Mean ± SEM. This data has been modified from Feola et al.11 Please click here to view a larger version of this figure.
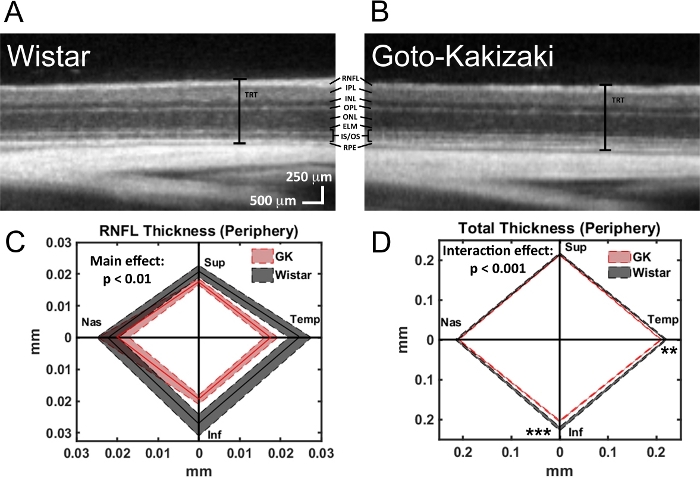
Figure 5: Using SD-OCT to observe decreased total retinal thickness as well as decreased thickness of specific retinal layers in a rat model of diabetes.
(A) Representative SD-OCT scan of a retina from a Wistar (Wild-type control) rat. (B) Representative SD-OCT scan of a retina from a Goto-Kakizaki (diabetic) rat. Retinal layers: retinal nerve fiber layer (RNFL), inner plexiform layer (IPL), inner nuclear layer (INL), outer plexiform layer (OPL), outer nuclear layer (ONL), external limiting membrane (ELM), inner segments/outer segments (IS/OS), retinal pigment epithelium (RPE), and total retinal thickness (TRT). (C-D) Quantification of RNFL (C) and total retinal thickness (D) in Wistar and Goto-Kakizaki retinas where the central line is the mean and the shaded area is the SEM for all four quadrants (Sup, Superior; Temp, Temporal; Inf, Inferior; Nas, Nasal) of the peripheral retina (1.2 mm from the optic nerve head). ** p < 0.01, *** p < 0.001. This figure has been modified from Allen et al.13 Please click here to view a larger version of this figure.
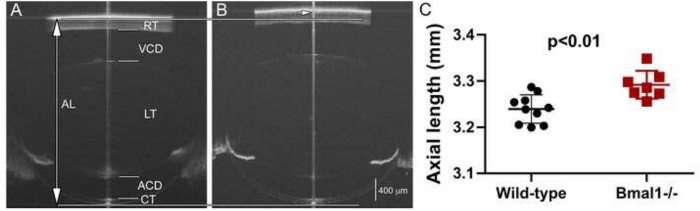
Figure 6: Using SD-OCT to evaluate axial length in a mouse model of myopia.
Whole eye SD-OCT images of wild-type (A) and Bmal1-/- (B) mouse eyes at 84 days of age. The eyes of Bmal1-/- mice have significantly longer axial length than the wild-type eyes (C). AL: axial length; RT: retinal thickness; VCD: vitreous chamber depth; LT: lens thickness; ACD: anterior chamber depth; CT: corneal thickness. The long vertical line indicates axial length boundaries (top and bottom indicated by horizontal line) for the wild-type eye. Short arrow indicates the posterior axial length marking for the Bmal1-/- eye. Mean ± SEM. The central line down the middle of each image (A&B) is a vertical saturation artifact. It is typically used as a guide to center the eye, but if the scan is well aligned, it can be made to disappear. Please click here to view a larger version of this figure.
High resolution imaging of ocular structures in vivo allows for the assessment of retinal and ocular changes over time. In this protocol, SD-OCT was demonstrated to capture differences in ocular structures in vivo in models of retinal degeneration, glaucoma, diabetic retinopathy, and myopia.
The most critical aspect when performing SD-OCT is obtaining a clear image of the retina or other ocular structure of interest. It is important to take time to make sure the retina is perfectly centered and has excellent clarity. Heavy breathing by the rodent can result in noisy images (the retina can actually be seen to wiggle on screen). This sometimes happens if an animal is not fully unconscious after anesthetic administration. To work around this issue, multiple B scans can be averaged to help visualize where the boundaries of the retinal layers are, and then the best single B scan image can be analyzed.
Another common mistake is that the eye is too dry or too wet. This can be checked easily by applying an additional drop of saline, wicking it away with a laboratory wipe, and assessing whether the image improved in clarity. A consideration to take into account when marking retinal layer thicknesses on SD-OCT images is how to mark the RNFL. While it is possible to differentiate between the RNFL and GCL on some rodent OCTs, often these two layers are indistinguishable. For consistency, we mark the entire RNFL region (RNFL + GCL, when visible) as the RNFL. Some studies report the RNFL and GCL as separate layers or combine the GCL and inner plexiform layer16,17,18, though this research was typically performed in humans, who have much larger eyes than rodents. Reporting of RNFL thickness is more typical in rodent studies11,13,19,20. Another important issue is that very slight changes in marking can cause a very large change, especially in myopia because of the small size of the structures being measured. For example, a 6 µm difference in measurement is equal to a diopter of change in refractive error21. Because slight changes make such a big difference in measurement, image clarity is critical.
A limitation of this protocol, and of SD-OCT in general, is that clear ocular media is required for a good image. For example, corneal lesions, lens abnormalities, and cataracts can prevent users from obtaining clear images. This is a problem in diabetic retinopathy imaging, in particular, as cataracts commonly develop in diabetic rodents22. If the cataract or other ocular issue is small, it is sometimes possible to maneuver the scan head around it. For larger ocular media disruptions, retinal OCT images are impossible to obtain. These retinas could still be investigated using histology as retinal histology is not contingent on clear ocular media.
A further limitation is the fact that hyperreflective lesions, such as exudates and hemorrhages, as well as major retinal vessels, result in shadowing of the underlying retinal structures, and thereby details of the underlying morphology are lost. In a case exhibiting choroidal neovascular membrane and diabetic retinopathy/macular edema where the retinal thickness was over 400 µm, it was hard to discern the underlying pathology and choroid23. Additionally, SD-OCT can only be used to assess thickness at specific locations. SD-OCT also has a limited penetration depth for imaging the choroid and for imaging of whole eyes (the whole eye can be imaged in a mouse, but not in larger animals). Another limitation is that fluorescent or other markers cannot be used with SD-OCT as with scanning laser ophthalmoscopy (SLO). However, typical SLO devices do not allow for the visualization of retinal layers in cross-section with the same ease that is observed with SD-OCT. Finally, the resolution with SD-OCT is not perfect. However, it is much improved over the resolution available at the inception of SD-OCT and continues to improve over time.
In conclusion, the advantages and significance of the SD-OCT technique are that it allows for in vivo imaging of ocular structures and quantitative tracking of changes in ocular dimensions over time, and that it performs this imaging with rapid scanning speed. Because of the high resolution of SD-OCT, it can be used to detect subtle differences that are not observable with the naked eye (Figure 4 & Figure 5). Further, SD-OCT is a useful tool to measure multiple parameters of the eye in a number of disease and injury models. In this protocol alone, SD-OCT was used to measure retinal thickness in models of retinal degeneration and diabetic retinopathy, retinal thickness and cupping in a glaucoma model, and axial length in a myopia model. SD-OCT can also be used to measure corneal curvature24, assess retinal changes after blast and traumatic brain injury19,25,26, identify pathology in age-related macular degeneration27, and monitor retinal health during and after ocular injections28 and retinal placement of prosthetic devices like subretinal implants29. It can be used in other animal models such as tree shrews30 and non-human primates31 as well. SD-OCT can also be used to localize retinal pathology based on quadrant (superior, inferior, nasal, temporal) and location (central vs. peripheral). The future SD-OCT devices will achieve even greater resolution. Additionally, OCT angiography is allowing for imaging of the retinal and choroidal microvasculature by utilizing the reflection of laser light off the surface of red blood cells as they move through the retinal vasculature32,33.
The authors have nothing to disclose.
This work was supported by the Department of Veterans Affairs Rehab R&D Service Career Development Awards (CDA-1, RX002111; CDA-2; RX002928) to RSA, Merit Award (RX002615) and Research Career Scientist Award (RX003134) to MTP, Career Development Award (CDA-2, RX002342) to AJF, EY028859 to MTP, NEI Core Grant P30EY006360, Research to Prevent Blindness, and Foundation Fighting Blindness.
1% tropicamide | Sandoz | Sandoz #6131403550; NDC- 24208-585-59 | |
0.5% tetracaine | Alcon | NDC 0065-0741-12 | |
AIM-RAS G3 120 V | Leica Bioptigen | 90-AIMRAS-G3-120 | Specialized platform to hold the OCT Scanner Head for mice |
Celluvisc gel | REFRESH CELLUVISC | #4554; NDC-0023-4554-30 | |
G3 18 mm Telecentric Lens | Leica Bioptigen | 90-BORE-G3-18 | |
G3 Mouse Lens | Leica Bioptigen | 90-BORE-G3-M | |
G3 Rat Lens | Leica Bioptigen | 90-BORE-G3-R | |
heating pad | Fabrication | 11-1130 | |
InVivoVue software | Leica Bioptigen | Specialized software that pairs with the Leica Bioptigen SD-OCT system | |
MATLAB | Mathworks | mathematical modeling program | |
Mouse/Rat Kit | Leica Bioptigen | 90-KIT-M/R | Mouse/rat rodent alignment system |
saline | ADDIPAK | 200-39 | |
System Envisu R4300 VHR 120 V | Leica Bioptigen | 90-R4300-V1-120 | SD-OCT system |