Light sheet-based fluorescence microscopy is the most valuable tool in developmental biology. A major issue in comparative studies is ambient variance. Our protocol describes an experimental framework for simultaneous live imaging of multiple specimens and, therefore, addresses this issue pro-actively.
Light sheet-based fluorescence microscopy offers efficient solutions to study complex processes on multiple biologically relevant scales. Sample chamber-based setups, which are specifically designed to preserve the three-dimensional integrity of the specimen and usually feature sample rotation, are the best choice in developmental biology. For instance, they have been used to document the entire embryonic morphogenesis of the fruit fly Drosophila melanogaster and the red flour beetle Tribolium castaneum. However, many available live imaging protocols provide only experimental frameworks for single embryos. Especially for comparative studies, such approaches are inconvenient, since sequentially imaged specimens are affected by ambient variance. Further, this limits the number of specimens that can be assayed within a given time. We provide an experimental framework for simultaneous live imaging that increases the throughput in sample chamber-based setups and thus ensures similar ambient conditions for all specimens. Firstly, we provide a calibration guideline for light sheet fluorescence microscopes. Secondly, we propose a mounting method for multiple embryos that is compatible with sample rotation. Thirdly, we provide exemplary three-dimensional live imaging datasets of Drosophila, for which we juxtapose three transgenic lines with fluorescently labeled nuclei, as well as of Tribolium, for which we compare the performance of three transgenic sublines that carry the same transgene, but at different genomic locations. Our protocol is specifically designed for comparative studies as it pro-actively addresses ambient variance, which is always present in sequential live imaging. This is especially important for quantitative analyses and characterization of aberrational phenotypes, which result e.g., from knockout experiments. Further, it increases the overall throughput, which is highly convenient when access to light sheet fluorescence microscopes is limited. Finally, the proposed mounting method can be adapted for other insect species and further model organisms, e.g., zebrafish, with basically no optimization effort.
Fluorescence microscopy is one of the most essential imaging techniques in the life sciences, especially in cell and developmental biology. In confocal fluorescence microscopes1, which are state-of-the-art for three-dimensional fluorescence imaging since the mid-1990s, the same lens is used for fluorophore excitation and emission light detection. The illumination laser beam excites all fluorophores along the illumination/detection axis and the respective out-of-focus signal is discriminated prior to detection by a pinhole. Hence, for each two-dimensional image, the entire specimen is illuminated. Consequently, for each three-dimensional image, i.e., a stack of spatially consecutive two-dimensional images, the entire specimen is illuminated several dozen to a few hundred times2, which promotes photobleaching and phototoxicity3.
Almost twenty years ago, light sheet-based technology4 emerged as a promising alternative for three-dimensional fluorescence imaging and thus became a valuable tool in developmental biology5. In this approach, illumination and detection are decoupled. The illumination lens is used to generate a light sheet with a depth of only a few micrometers within the focal plane of the perpendicularly arranged detection lens. Hence, for each two-dimensional image, only a thin planar volume around the focal plane is illuminated. Consequently, for each three-dimensional image, the entire specimen is illuminated only once, which strongly decreases photobleaching and phototoxicity6. For this reason, light sheet fluorescence microscopes (LSFMs) offer efficient solutions to study complex processes on multiple biologically relevant scales and are, therefore, of particular value in developmental biology, where specimens as large as several millimeters have to be analyzed at the subcellular level.
Historically, LSFMs have been sample chamber-based7,8. In these setups, the illumination (x) and detection (z) axes are usually arranged perpendicularly to the gravity axis (y). Sample chambers offer ample experimental freedom. Firstly, they provide large imaging buffer capacities, which in turn eases the use of a perfusion system to control the environment, e.g., to maintain a specific temperature9 or to apply biochemical stressors. Further, they support customized mounting methods10 that are tailored to the respective experimental needs while preserving the three-dimensional, in some instances dynamic11, integrity of the specimen. Additionally, sample chamber-based setups are usually equipped with a rotation function that is used to revolve the specimens around the y axis and thus image them along two, four or even more directions. Since embryos of commonly used model organisms are, in the context of microscopy, relatively large, successive imaging along the ventral-dorsal, lateral, and/or anterior-posterior body axes provides a more comprehensive representation. This allows e.g., long-term tracking of cells that move along complex three-dimensional migration paths12,13.
Light sheet-based fluorescence microscopy has been applied extensively to study the embryonic morphogenesis of Drosophila melanogaster, both systematically14,15 as well as with a specific focus on the biophysical aspects of development. For instance, it was used to gather high-resolution morphogenetic data in order to detect a biomechanical link between endoderm invagination and axis extension during germband elongation16 and further to relate the complex cellular flow with force generation patterns during gastrulation17. It has also been combined with other state-of-the-art techniques, e.g., optogenetics to investigate the regulation of Wnt signaling during anterior-posterior patterning in the epidermis18.
However, studying only one species does not provide insights into the evolution of development. To understand embryogenesis within the phylogenetic context, intensive research has been conducted with alternative insect model organisms. One of the most comprehensively investigated species is the red flour beetle Tribolium castaneum, an economically relevant stored grain pest19, whose embryonic morphogenesis has also already been systematically imaged with LSFM20. The embryonic morphogenesis of these two species differs remarkably in several aspects, e.g., the segmentation mode21, as well as the formation and degradation of extra-embryonic membranes22. The latter aspect has already been extensively analyzed using LSFMs. For instance, it has been shown that the serosa, an extra-embryonic tissue that envelops and protects the Tribolium embryo from various hazards for the better part of its embryogenesis23,24, also acts as the morphogenetic “driver” for its own withdrawal process during dorsal closure25. Further, it has been demonstrated that during gastrulation, a particular region of the blastoderm remains anchored to the vitelline membrane in order to create asymmetric tissue movements26 and, following this observation, that regionalized tissue fluidization allows cells to sequentially leave the serosa edge during serosa window closure27.
In all Drosophila– and Tribolium-associated studies cited above, sample chamber-based LSFMs have been used. In most, the embryos were recorded along multiple directions using the sample rotation function. Although not stated explicitly, it can be assumed that they have been recorded individually and thus independent of each other in sequential live imaging assays, similar to our previous work on Tribolium20,28. In certain scenarios, such an approach is acceptable, but especially in quantitative comparative approaches, ambient variance can distort the results. For instance, it has long been known that the developmental speed of insects is temperature-dependent29, but a more recent study further suggests that in Drosophila, temperature may also affect the concentration of morphogens30. Consequently, if certain characteristics of embryogenesis, e.g., the dynamic proportions, division rates and migration velocities of cells, should be precisely quantified, sufficient repetitions without ambient variance are required. This minimizes standard deviations and standard errors, which in turn facilitates juxtaposition with other, even just marginally divergent experimental conditions.
However, sample chamber-based LSFMs are primarily designed for high content rather than high throughput assays. Unlike confocal microscopes, which are typically equipped with standardized clamp mechanisms for microscopy slides, Petri dishes and well plates, nearly all sample chamber-based LSFMs use cylinder-based clamp mechanisms. These mechanisms are intended for custom-made sample holders that are rotation-compatible as well as non-invasive10, but usually not designed for more than one specimen20,31,32. A framework for simultaneous live imaging of two or more embryos, in which the advantages of sample chamber-based setups are not compromised, addresses the ambient variance issue thereby increasing the value of LSFMs for comparative studies.
In our protocol, we present an experimental framework for comparative live imaging in sample chamber-based LSFMs (Figure 1A) in which the y axis is used as an option to “stack” embryos. Firstly, we provide a fluorescent microsphere-based calibration guideline for sample chamber-based LSFMs, which is especially important for instruments that lack a calibration assistant. Secondly, we describe a mounting method for multiple embryos based on the cobweb holder28 (Figure 1B) that is compatible with sample rotation and thus allows simultaneous imaging of multiple specimens along multiple directions (Figure 1C). Several embryos are aligned on top of a thin agarose film and, after insertion into the sample chamber, moved successively through the light sheet to acquire three-dimensional images. Thirdly, we provide three exemplary live imaging datasets for Drosophila as well as for Tribolium. For the former, we juxtapose transgenic lines with fluorescently labeled nuclei. For the latter, we compare the performance of transgenic sublines that carry the same transgene, but at different genomic locations. Finally, we discuss the importance of parallelization with regard to comparative live imaging and ambient variance33, debate the throughput limit of our experimental framework and evaluate adaption of our approach to other model organisms.
1. Preparatory work
2. Calibration of sample chamber based LSFMs using fluorescent microspheres
NOTE: The purpose of calibration is to align the focal points of the illumination and detection lenses (Figure 2A), as this is the premise for clear images. LSFMs should be calibrated regularly, at least once every 3-4 weeks.
3. Collection of Drosophila embryos
4. Collection of Tribolium embryos
NOTE: For convenience, a scheme of the Tribolium egg collection procedure is provided (Figure 3A) to which also the numbers within the brackets in this step refer.
5. Sodium hypochlorite-based dechorionation
NOTE: Both Drosophila and Tribolium embryos are covered by a chorion, a protective and heavily light-scattering protein layer that is not essential for proper development as long as the embryos are kept moist after removal. The dechorionation protocol for the embryos of both species is identical.
6. Mounting of multiple embryos using the cobweb holder
7. Comparative live imaging in sample chamber-based LSFMs
8. Retrieval and further cultivation of imaged embryos
9. Image data processing and metadata documentation
NOTE: For image data processing, the ImageJ derivate FIJI35 is recommended (imagej.net/Fiji/Downloads). FIJI does not require installation and 32- as well as 64-bit versions are available. One of the most frequently used formats for LSFM data is the tagged image file format (TIFF), which allows the storage of image stacks in form of a TIFF container.
10. Data visualization
NOTE: This data visualization guideline focuses primarily on the creation of z maximum projection image matrices that show several recorded embryos along multiple directions and/or over time. The following steps describe the data visualization procedure that was applied to the example datasets for the creation of the figures shown and videos linked in the Representative Results section.
Our protocol describes an experimental framework for comparative fluorescence live imaging in sample chamber based LSFMs. For instance, the framework can be used to juxtapose (i) embryos of two or more species, (ii) embryos of lines in which one or more genes are knocked out plus wild-type controls, (iii) multiple embryos of the same transgenic line, (iv) embryos from different transgenic lines, or (v) embryos from sublines that carry the same transgene, but at different genomic locations. In this section, we provide examples for the last two scenarios.
In our first exemplary application, we show the fluorescence signal dynamics of three embryos that derive from different transgenic Drosophila lines (Table 2) over a period of about 1 day (Figure 4, Supplementary Movie 1). For these lines, we expected rather similar fluorescence patterns since all of them express nuclear-localized EGFP/GFP under control of different presumably ubiquitous and constitutively active promoters. However, our comparative live imaging results show that there are strong spatiotemporal differences in the expression patterns that are certainly not secondary effects due to ambient variance.
In our second application example, we compare the performance of three embryos that derive from the AGOC{Zen1’#O(LA)-mEmerald} #1, #2 and #3 (Zen1’LA-mE #1, #2 and #3, respectively) transgenic Tribolium sublines36. All of these carry the same piggyBac-based transgene that leads to expression of mEmerald-linked37 Lifeact38 under control of the zerknüllt 139 promoter, a transcription factor involved in serosa specification. Our comparative live imaging results, which illustrate the serosa window closure process during gastrulation, suggest that subline #2 provides a remarkably stronger overall signal than the other two sublines (Figure 5, Supplementary Movie 2). This indicates that also in Tribolium, the genomic context may have a strong influence on the expression level of transgenes that carry an expression cassette.
Successful retrieval of all six embryos that are shown in this section was possible as described in Step 8 of our protocol. All of them developed into fully functional and fertile adults (Supplementary Table 1, “Retrieval” row), indicating that the overall procedure, from dechorionation over mounting to recording, was non-invasive. This level of quality control is essential whenever wild-type development is expected, e.g., regarding control embryos that are imaged simultaneously with embryos in which one or more genes are knocked down or knocked out.
All datasets that were used to create the representative results are provided as resources that will help especially LSFM novices to evaluate the quality of their own work. The digital object identifier-based download links can be found in the metadata table (Supplementary Table 1, “Data Access” row).
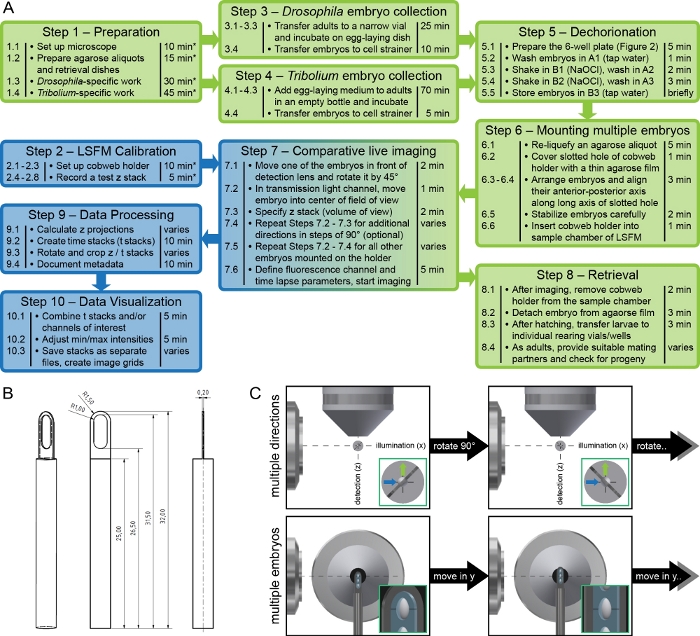
Figure 1: Experimental framework and mounting method overview. (A) Flowchart of the ten protocol steps with short reminders and an estimation of the required time. Tasks marked with asterisks do not have to be performed during every assay but depending on the circumstances. Green boxes indicate steps associated with Drosophila and/or Tribolium, blue boxes indicate steps associated with microscopy. (B) Detail drawing of the cobweb holder. The presented design is suitable for cylinder-based clamp mechanisms, which are commonly used in sample chamber-based LSFMs. Specifications are in millimeters. The holder can be scaled as long as the working distance of the detection lens is respected. (C) Recording sequence for live imaging of multiple embryos along multiple directions. At first, z stacks of the uppermost embryo are recorded along up to four orientations, i.e. 0°, 90°, 180° and 270°. Subsequently, the embryo below is moved in front of the detection lens and the recording/rotation sequence begins anew. Please click here to view a larger version of this figure.
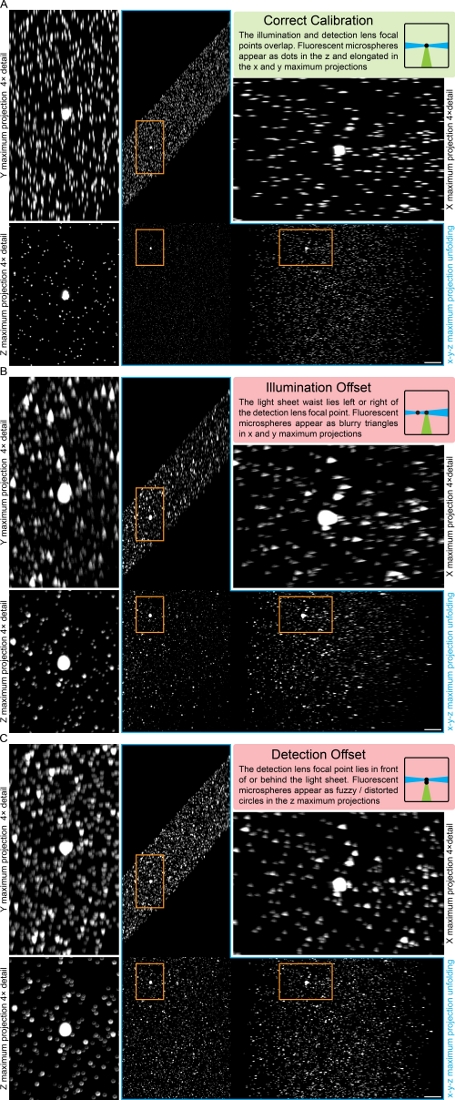
Figure 2: Fluorescent microsphere-based calibration chart for LSFMs. The chart illustrates how fluorescent microspheres appear in the x, y and z maximum projections if the LSFM is correctly calibrated (A), or if there is an illumination (B) or detection offset (C). Please click here to view a larger version of this figure.
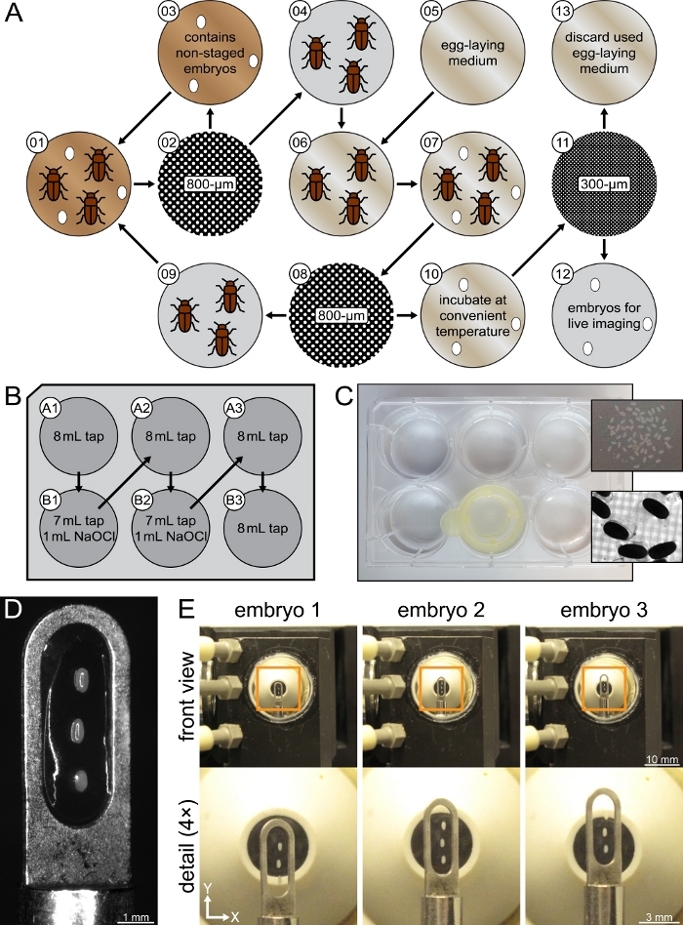
Figure 3: Collection, dechorionation, mounting and imaging of multiple embryos. (A) Tribolium embryo collection overview. The illustrations are cited throughout Step 4 according to the numbers in the upper left. (B) Preparation and transfer scheme for the 6-well plate used during Step 5. The B1 and B2 wells contained diluted sodium hypochlorite (NaOCl), which induces dechorionation. (C) The 100 µm cell strainer, which was used to transfer the embryos from one well to another, within the B2 well. The upper detail image shows a close-up of several Tribolium embryos on top of the cell strainer mesh, the lower detail image shows a transmission light stereo microscope image of several Tribolium embryos with partially detached chorion. (D) Cobweb holder with three mounted Tribolium embryos. The embryos, as well as their anterior-posterior axes, were aligned along the long axis of the slotted hole. (E) Movement of the cobweb holder within the sample chamber of the LSFM during the recording of three embryos. Please click here to view a larger version of this figure.
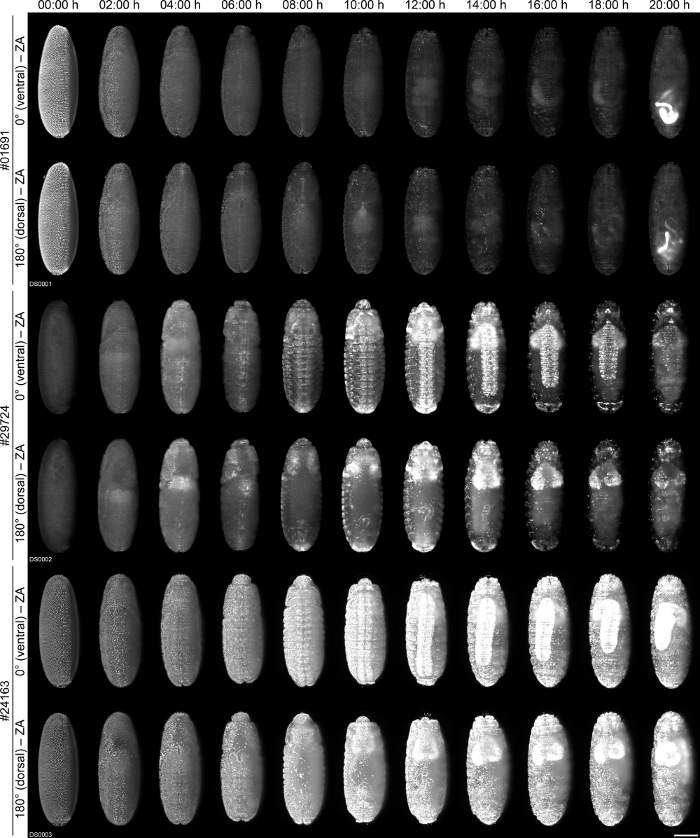
Figure 4: Comparative fluorescence live imaging of one embryo each from the #01691, #29724 and #24163 transgenic Drosophila lines. Embryos are shown along two (of four recorded) directions over a period of 20:00 h (from a total imaging period of 23:40 h). No dynamic intensity correction over time was performed. Metadata for the Drosophila datasets can be found in Supplementary Table 1. ZA, Z maximum projection with image adjustment. Scale bar, 100 µm. Please click here to view a larger version of this figure.
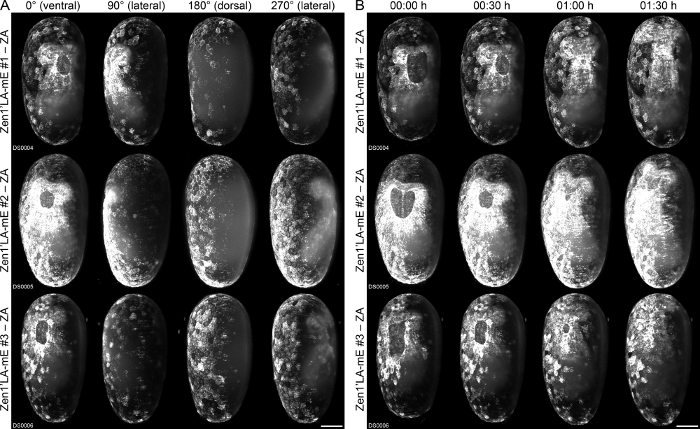
Figure 5: Comparative fluorescence live imaging of one embryo each from the Zen1’LA-mE #1, #2 and #3 transgenic Tribolium sublines. (A) Embryos are shown along four directions during gastrulation, just prior to serosa window closure. (B) Embryos are shown ventrally over a period of 01:30 h (from a total imaging period of 118:00 h). Image adjustment was performed with identical minimum and maximum displayed values, no dynamic intensity correction over time was performed. Metadata for the Tribolium datasets can be found in Supplementary Table 1. Datasets were synchronized to the stage shown in (A). ZA, Z maximum projection with image adjustment. Scale bar, 100 µm. Please click here to view a larger version of this figure.
Combination | Rationale | Illumination lens | Detection lens | Camera | Reference |
#1 | entire embryo on the cellular level, large pixel spacing (small data volume) | 2.5× magnification numerical aperture 0.06 (air) | 10× magnification numerical aperture 0.3 (water-dipping) | CCD with 1.4 megapixel (1392×1040, 6.45 µm pitch) | this study, Drosophila41, Tribolium20,41 |
#2 | entire embryo on the cellular/subcellular level, small pixel spacing (large data volume) | 2.5× magnification numerical aperture 0.06 (air) | 20× magnification numerical aperture 0.5 (water-dipping) | sCMOS with 5.5 megapixel (2560×2160, 6.5 µm pitch) | Tribolium9 |
#3 | specific regions of the embryo on the subcellular level or specialized applications e.g. live imaging of dissected germbands42,43 | 5.0× magnification numerical aperture 0.16 (air) | 40× magnification numerical aperture 0.75 (water-dipping) | CCD with 1.4 megapixel (1392×1040, 6.45 µm pitch) | Tribolium44 |
Table 1: Recommended illumination lens/detection lens/camera combinations for live imaging of Drosophila and Tribolium embryos using LSFM. All combinations have been successfully employed in previous studies (see Reference row). Please note that most sample chamber-based LSFMs use water-dipping lenses for detection, which are primarily designed for imaging buffers with a refractive index of 1.33 (such as autoclaved tap water or other aqueous media). Imaging buffers with other refractive indices can be used40, but this changes certain properties of the optical system, e.g. the working distance.
Line | Genotype | Fluorophore expression |
#01691 | y[1] w[67c23]; P{w[+mC]=Ubi-GFP.nls}ID-2; P{Ubi-GFP.nls}ID-3 | NLS-GFP under control of the polyubiquitin promoter |
#29724 | w[*]; P{w[+mC]=Tub84B-EGFP.NLS}3 | NLS-GFP under control of the alpha-tubulin 84B promoter |
#24163 | w[*]; P{w[+mC]=His2Av-EGFP.C}2/SM6a | EGFP-labeled histone 2A variant in all cells |
Table 2: The three transgenic Drosophila lines used in the first application example. The “line” column refers to the Bloomington Drosophila Stock Center (bdsc.indiana.edu) stock number.
Supplementary Video 1: Comparative fluorescence live imaging of one embryo each from the #01691, #29724 and #24163 transgenic Drosophila lines. Each transgenic line expresses nuclear-localized EGFP/GFP under control of a presumably ubiquitous and constitutively active promoter. ZA, Z maximum projection with image adjustment. No dynamic intensity correction over time was performed. ZA, Z maximum projection with image adjustment. Please click here to download this video.
Supplementary Video 2: Comparative fluorescence live imaging of one embryo each from the Zen1’LA-mE #1, #2 and #3 transgenic Tribolium sublines. Each transgenic subline expresses mEmerald-labeled Lifeact under control of the zerknüllt 1 promoter, a transcription factor involved in serosa specification. Please note that the Zen1’LA-mE #1 embryo turns approximately 90° within the serosa right after serosa window closure. Datasets were synchronized to the stage shown in Figure 4A. Image adjustment was performed with identical minimum and maximum displayed values, no dynamic intensity correction over time was performed. Embryos are shown ventrally and laterally over a period of 48:00 h. ZA, Z maximum projection with image adjustment. Please click here to download this video.
Supplementary File 1: FIJI batch processing script for the automated calculation of z maximum projections from all z stacks within one folder. The script can be opened in FIJI via drag-and-drop. At the start (“Run”) only the input folder must be specified. The output subfolder ("Z Maximum Projections") is created automatically. Please click here to download this file.
Supplementary Table 1: Metadata and parameter for the long-term live imaging datasets DS0001-6. Please click here to download this table.
One of the exclusive application areas of LSFMs is developmental biology. In this discipline, it is of importance to look at living specimens, otherwise morphogenetic processes cannot be described in a dynamic manner. An experimental framework for the simultaneous live imaging in sample chamber-based LSFMs, as described here, is convenient for two major reasons.
Ambient variance, which is unavoidable in sequential live imaging, can be addressed pro-actively. In insect embryo-associated live imaging, we see e.g., the following susceptibilities. The egg collection cultures may have different ages at the time of embryo collection. In Drosophila, it has been shown that this affects the qualities of the progeny45. Although working with appropriately desynchronized cultures is an option, simultaneous imaging with synchronized cultures is considerably more convenient. Both the Drosophila– and Tribolium-based representative results derive from synchronized egg collection cultures, and we can confidently exclude that the different fluorescence characteristics are an unintended effect of parental senescence.
Dechorionation is a crucial step as prolonged exposure to sodium hypochlorite decreases embryo viability. Inconveniently, the ionic strength of sodium hypochlorite decreases over time. Measurements of the ionic strength are possible46, but laborious and cumbersome. In simultaneous live imaging, a master mix can be used for all lines and/or conditions during the preparation of the dechorionation-associated 6-well plates.
Even in laboratories with efficient air condition, small but irregular temperature fluctuations are inevitable and also affect temperature-controlled9 sample chamber-based LSFMs. Theoretically, the temperature in the sample chamber can be logged, but an exact repetition is not possible. In simultaneous live imaging, these fluctuations also occur, but they affect all embryos likewise.
From the practical point of view, a protocol for simultaneous imaging of multiple embryos increases the throughput. In live imaging, the duration of the developmental process of interest determines how many assays can be conducted within a given period, which is an important consideration when access to LSFMs is limited. Prime examples for long-term recording are live imaging assays in which cells are tracked. Such experiments usually range over long development periods. While the embryonic development of Drosophila takes only about one day at room temperature47, Tribolium takes about seven days48. Hence, for this species, parallelization is essential to remain within a reasonable time frame, especially regarding assays where many conditions are compared.
The throughput, i.e., the number of embryos that are imaged simultaneously, is primarily limited by two factors: First is the space available along the y axis within the sample chamber. When the lowermost embryo is about to be imaged, the uppermost embryo should not have left the imaging buffer. Further, the cobweb holder and the associated support system should not be so lengthy that it wobbles and/or jitters noticeably during the z stack recording process. Second is the intended temporal resolution. The recording time per embryo can be approximated by multiplying the exposure time per two-dimensional image (usually 10-200 ms) with the number of planes per z stack (usually several hundred), the number of channels (usual between one and three), the number of directions (usually between one and eight) and a setup-dependent factor for the translation and rotation movements (estimated between 1.2 and 1.5). The ratio of the intended temporal resolution and the recording time per embryo indicates the maximum number of embryos that can be imaged simultaneously. In summary, our protocol is appropriate to advance from sequential live imaging to medium throughput, but not suitable for what is generally regarded as high throughput. For the latter, LSFMs suitable for microscope slides49,50,51 or well plates52 can be considered, but these implementations usually have other limitations.
Depending on the experimental question and hence the illumination lens/detection lens/camera combination in conjunction with the imaging parameters, simultaneously imaged LSFM datasets may require vast storage space in their raw state. This issue can best be illustrated by considering the provided Drosophila example datasets (Supplementary Table 1), i.e., DS0001-3. Each two-dimensional raw image had a data volume of about 2.8 Megabytes, each raw z stack consisted of 120 planes, and all three embryos were recorded along four directions a total of 143 times. In consequence, the raw datasets occupied about half a Terabyte. Through image data processing, i.e., cropping along all spatial dimensions (Step 9) in conjunction with ZIP-based compression, the data volume was reduced to 53.3 Gigabyte, which is about 10% of the initial amount. To process datasets in the Terabyte regime, the BigDataViewer53 plugin, which is pre-installed in FIJI (Plugins | BigDataViewer), is recommended.
In addition to the five scenarios outlined in the Representative Results section, our protocol can also be used to characterize the effect of RNAi knockdown effects, which is a popular approach in Tribolium54. However, it is only of limited use for the analysis of compounds (e.g., insecticides or other biochemical stressors) if these should be applied through the imaging buffer – which is the most straightforward approach – as simultaneous imaging of a control embryo is not possible.
We demonstrated our protocol using one of our custom-built microscopes8,55, but it is applicable to any sample chamber-based setup, e.g., OpenSPIM56 or most commercial LSFMs. This protocol complements the LSFM-associated resource establishment initiative that aims at encouraging novices to actively integrate light sheet-based technology into their research plans. Most universities and institutes nowadays operate well-equipped fluorescence microscopy facilities57. These usually provide access to one or more chamber-based LSFMs, but the staff cannot be expected to have the proper experimental solutions for every scientific question at hand.
Our results show that our experimental framework is suitable for Drosophila and Tribolium. We are confident that our comparison-focused protocol can be used to study the embryogenesis of other insect species. For instance, a LSFM-based approach has been applied to compare wild-type and knockdown development in the scuttle fly Megaselia abdita58, and follow-up studies would also benefit from our mounting method. In addition, transgenic lines of the two-spotted cricket Gryllus bimaculatus specifically designed for fluorescence live imaging59 are available, but the only currently available comparison-focused protocol60 is intended for conventional inverted microscopes and therefore does not address three-dimensional image acquisition or sample rotation. Additionally, it has already been shown that the cobweb holder is a convenient choice for zebrafish, whose embryos change their shape considerably during embryogenesis61. An adaptation of our protocol, which requires basically no optimization effort, would provide the above-described advantages also for this model organism.
The authors have nothing to disclose.
We thank Ernst H. K. Stelzer for the opportunity to use his resources as well as his valuable comments regarding the manuscript, Anita Anderl for support with the Tribolium live imaging, Sven Plath for technical support as well as Ilan Davis, Nicole Grieder and Gerold Schubiger for sharing their transgenic Drosophila lines via the Bloomington Stock Center.
6-well plate | Orange Scientific | 4430500 | |
24-well plate | Orange Scientific | 4430300 | Only for live imaging involving Tribolium |
35-mm Ø Petri dish | Fisher Scientific | 153066 | Only for live imaging involving Drosophila. |
90-mm Ø Petri dish | Fisher Scientific | L9004575 | |
100-µm mesh size cell strainer | BD Biosciences | 352360 | |
250-µm mesh size sieve | VWR International | 200.025.222-038 | Only for live imaging involving Tribolium |
300-µm mesh size sieve | VWR International | 200.025.222-040 | Only for live imaging involving Tribolium |
710-µm mesh size sieve | VWR International | 200.025.222-050 | Only for live imaging involving Tribolium |
800-µm mesh size sieve | VWR International | 200.025.222-051 | Only for live imaging involving Tribolium |
405 fine wheat flour | Demeter e.V. | SP061006 | Only for live imaging involving Tribolium |
commercially available Drosophila medium | Genesee Scientific | 66-115 | Only for live imaging involving Drosophila / Custom-made Drosophila medium may also be used |
fluorescent microspheres, 1.0 µm Ø | Thermo Fisher Scientific | T7282 | |
inactive dry yeast | Genesee Scientific | 62-108 | Only for live imaging involving Tribolium |
low-melt agarose | Carl Roth | 6351.2 | |
narrow vials | Genesee Scientific | 32-109 | Only for live imaging involving Drosophila |
small paint brush | VWR International | 149-2121 | |
sodium hypochlorite (NaOCl), ~12% active Cl | Carl Roth | 9062.3 | Caution: sodium hypochlorite is corrosive |
whole wheat flour | Demeter e.V. | SP061036 | Only for live imaging involving Tribolium / United Kingdom: wholemeal flour |
wide vials | Genesee Scientific | 32-110 | Only for live imaging involving Drosophila |