Regulators of melanocyte functions govern visible differences in the pigmentation outcome. Deciphering the molecular function of the candidate pigmentation gene poses a challenge. Herein, we demonstrate the use of a zebrafish model system to identify candidates and classify them into regulators of melanin content and melanocyte number.
Melanocytes are specialized neural crest-derived cells present in the epidermal skin. These cells synthesize melanin pigment that protects the genome from harmful ultraviolet radiations. Perturbations in melanocyte functioning lead to pigmentary disorders such as piebaldism, albinism, vitiligo, melasma, and melanoma. Zebrafish is an excellent model system to understand melanocyte functions. The presence of conspicuous pigmented melanocytes, ease of genetic manipulation, and availability of transgenic fluorescent lines facilitate the study of pigmentation. This study employs the use of wild-type and transgenic zebrafish lines that drive green fluorescent protein (GFP) expression under mitfa and tyrp1 promoters that mark various stages of melanocytes.
Morpholino-based silencing of candidate genes is achieved to evaluate the phenotypic outcome on larval pigmentation and is applicable to screen for regulators of pigmentation. This protocol demonstrates the method from microinjection to imaging and fluorescence-activated cell sorting (FACS)-based dissection of phenotypes using two candidate genes, carbonic anhydrase 14 (Ca14) and a histone variant (H2afv), to comprehensively assess the pigmentation outcome. Further, this protocol demonstrates segregating candidate genes into melanocyte specifiers and differentiators that selectively alter melanocyte numbers and melanin content per cell, respectively.
While the use of melanin for photoprotection has evolved several times across the animal kingdom, vertebrates have seemingly perfected the process. Dedicated pigment-producing cells with an elaborate machinery to synthesize and contain melanin are conserved from fish to humans1. However, the outcome of pigmentation is dramatically varied, ranging in the color to recipience and presents as vivid patterns on integuments, the skin, and hair2. Despite the diversity, the repertoire of genes involved in pigmentation response is strikingly conserved. The core components of the melanin-synthesizing machinery, such as the key melanin-synthesizing enzymes, the components of the melanosomes, and the upstream connectivity to the signaling pathway, remain essentially identical across organisms. Subtle genetic differences bring about dramatic changes in the patterns of pigmentation observed across species3. Hence, a reverse genetic approach in a lower vertebrate organism, the zebrafish (Danio rerio), offers an excellent opportunity to decipher the involvement of genes in rendering the pigmented state4.
Zebrafish embryos develop from a single-celled fertilized zygote to a larva within a span of ~24 h post fertilization (hpf)5. Strikingly, the melanocyte-equivalent cells-the melanophores-are large cells that are present in the dermis and are conspicuous due to the dark melanin content6. These neural crest-derived cells emanate ~11 hpf and begin to pigment ~24 hpf6,7. Conserved gene expression modules have enabled the identification of key factors that orchestrate melanocyte functions and led to the development of transgenic fluorescent reporter lines Tg(sox10:GFP), Tg(mitfa:GFP), and Tg(ftyrp1:GFP)8,9,10 that label selective stages of melanocyte development. Using these transgenic fish lines enables the interrogation of cell biology of melanocytes at the organismal level in the tissue context with appropriate cues according to the developmental timelines. These reporters complement pigment-based quantitation of melanocytes and enable a distinct assessment of melanocyte numbers irrespective of melanin content.
This article provides a detailed protocol for deciphering the biology of melanocytes by assessing two critical parameters, namely melanin content and melanocyte numbers. While the former is a common functional readout emanating from a hypopigmentation response, the latter is associated with a reduction in the specification or survival of melanocytes and is often associated with genetic or acquired depigmentation conditions. The overall strategy of this reverse genetic screen is to silence select genes using a morpholino and investigate the melanocyte-specific outcomes. Melanin content is analyzed using image-based quantitation of mean grey values followed by confirmation using a melanin content assay. The number of melanocytes at various stages of maturation is analyzed using image-based quantitation and further confirmed using FACS analysis. Here, the screening protocol is demonstrated using two candidate genes, namely carbonic anhydrase 14, involved in melanogenesis, and a histone variant H2AFZ.2 involved in the specification of melanocytes from the neural crest precursor population. While the former alters melanin content and not the melanocyte numbers, the latter alters the number of specified melanocytes and, consequently, the melanin content in the embryo. In all, this method provides a detailed protocol to identify the role of a candidate gene in pigmentation and distinguish its role in controlling melanocyte numbers versus melanin content.
Zebrafish experiments were performed in strict accordance with the institutional animal ethics approval (IAEC) of the CSIR-Institute of Genomics and Integrative Biology (IGIB), India (Proposal No 45a). All efforts were made to minimize animal suffering.
1. Injecting morpholino into zebrafish embryos
2. Pigmentation analysis
3. Melanophore count
NOTE: Fluorescence analysis in transgenic Zebrafish embryos can be done by two methods: 1) counting GFP-positive cells; 2) measuring fluorescence intensity.
The workflow described in Figure 1 was used to perform morpholino-based genetic perturbation at the zebrafish one-cell stage. Pigmentation analysis was performed using various methods, as mentioned below. To illustrate the representative results, standardized volumes of antisense morpholino targeting h2afv and ca14 genes were injected in the yolk or one-cell stage of the zebrafish embryo. The initial phenotyping based on brightfield imaging was performed at 48 hours post fertilization (hpf), when all the five pigmented melanophore stripes (dorsal, ventral, yolk, two lateral) were evident.
Figure 2A,B represent an approach to analyze pigmentation by calculating the number of lateral melanophores per embryo. Lateral melanophores were manually counted at the 48 hpf stage by zooming in on the lateral region of the tilted zebrafish. An alternative method to quantify the pigmented melanophores (Supplemental Figure S1) involves the manual counting of the head melanophores by imaging the dorsal view of the zebrafish.
The melanin content per embryo is calculated by measuring the mean gray value, keeping the region of interest constant with the help of ImageJ software. Figure 2C-F show that the mean gray value of ca14 and h2afv morphants was higher than in control morphants. As the mean gray value is inversely proportional to melanin content, knockdown of ca14 and h2afv genes led to a decrease in melanin content per embryo. Another robust method to quantify the melanin content is a NaOH-based spectrophotometric absorption method. As shown in Figure 2G, the total melanin content in ca14 morphants was less than in control morphants.
Fluorescent imaging revealed two different stages of zebrafish melanophore development: early specified melanophores (mitfa:gfp) and differentiating melanophores (ftyrp:gfp). The morpholino-based alteration was evaluated by fluorescent imaging (Figure 3A and Figure 3C). To further validate these observations, the frequency of GFP-positive cells was calculated using FACS. The knockdown of h2afv but not ca14 significantly reduced the number of melanophores with respect to control(Figure 3A-D). Moreover, a reduction in the mean fluorescence intensity/area can be calculated using ImageJ software, keeping the region of interest constant. H2afv morphants show a significant decrease in the mean fluorescent intensity/area relative to control morphants (Figure 3E,F).
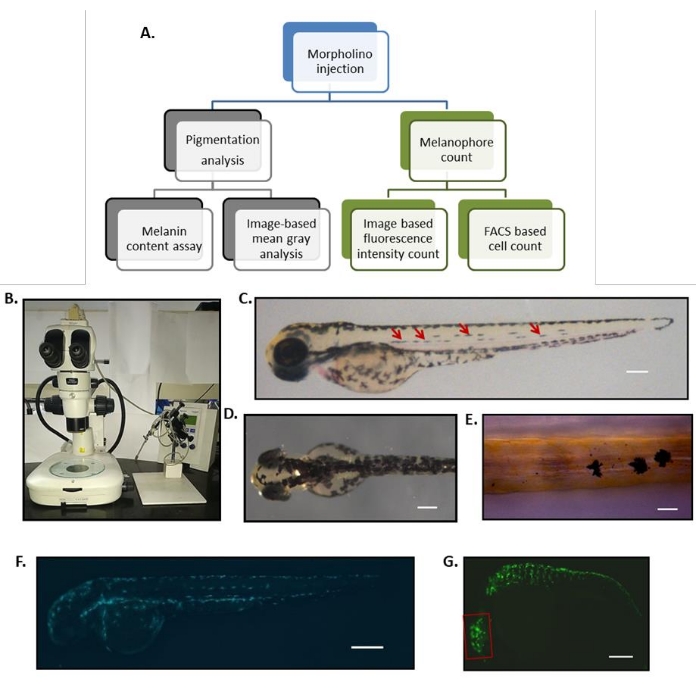
Figure 1: Workflow for a reverse genetic approach to identify regulators of melanocyte biology using zebrafish. (A) Flowchart depicting the experimental workflow starting from microinjection to evaluating pigmentation by various methods. (B) Microinjection needle holder and micromanipulator, along with a dissecting microscope, is a typical setup for microinjection of one-cell stage zebrafish embryos. (C) Embryonic melanocyte patterning in zebrafish at 3 dpf showing all five stripes: dorsolateral, two lateral midlines (pointed by four red arrows), ventral stripe, and yolk stripe. (D) To study the pigmentation outcome upon morpholino injection, lateral midline melanophores can be counted under a stereomicroscope. Brightfield image of a dorsal region at 2 dpf; melanin content can be quantified by measuring mean grey value. (E) The mean gray values are inversely proportional to the melanin content of the embryo. Melanin-filled melanophores at 2 dpf in wild-type embryos. (F) Melanin content assay can be performed to estimate the melanin production within these melanophores. Transgenic zebrafish labeling the cells expressing TYRP1 protein at 2 dpf. (G) Fluorescently labeled cells can be quantified using FACS; scale bar = 100 µm. Transgenic zebrafish labeling the cells expressing Mitfa protein at 1 dpf. Meanfluorescence intensity per animal can be measured using ImageJ software. Scale bars = 100 µm. Abbreviations: dpf = days post fertilization; FACS = fluorescence-activated cell sorting. Please click here to view a larger version of this figure.
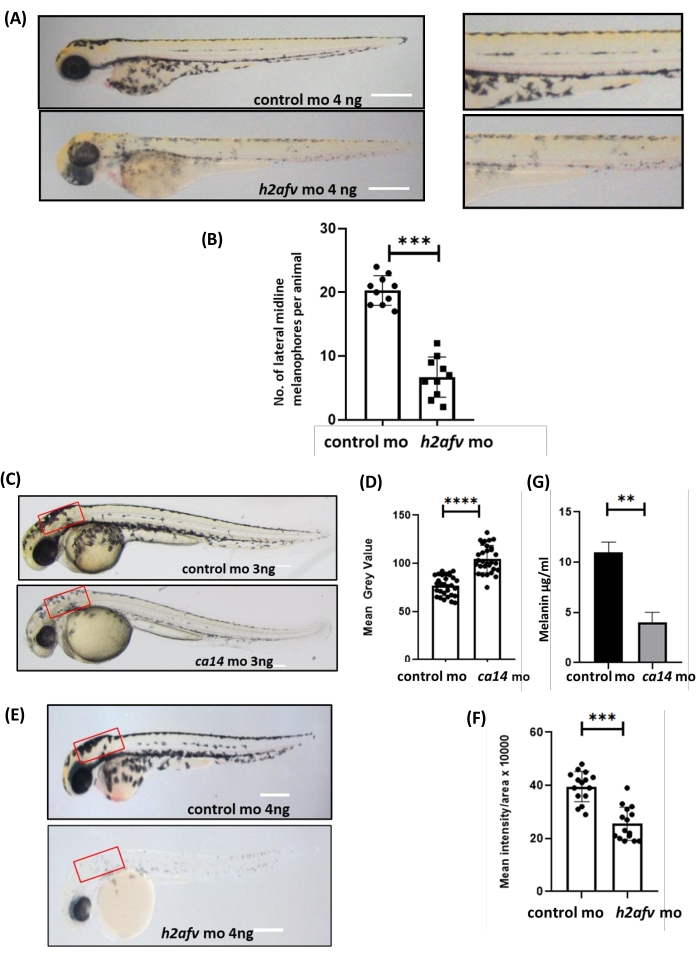
Figure 2: Counting lateral midline melanophores, measuring mean gray value, and melanin content assay. Brightfield microscopic images of the lateral view of morphants were used to quantify melanin content using ImageJ software. (A) Control and Histone variant h2afv (h2afv) morphants at 3 dpf; on the right are zoomed-in trunk regions of these embryos depicting melanocyte numbers. (B) The number of melanophores in h2afv morphants is drastically reduced relative to control, n > 10 each in 3 biological replicates. (C) Representative image of control vs carbonic anhydrase 14 morphants at 2 dpf. (D) Melanin quantification of ca14 vs control morphants, n > 10 across 3 biological replicates. (E) Lateral view of h2afv vs control morphants at 2 dpf. (F) Melanin content quantification of h2afv vs control morphants. Red rectangles represent ROI chosen for ImageJ-based analysis. (G) Melanin content assay performed on morpholino-injected embryos for quantifying the total melanin content. Mean of three independent experiments ± SEM.; **P < 0.01, **** P < 0.0001. Student's t-test; error bars are mean ± standard error of the mean (SEM). Scale bars = 100 µm. Abbreviations: MO = morpholino; dpf = days post fertilization; ROI = region of interest. Please click here to view a larger version of this figure.
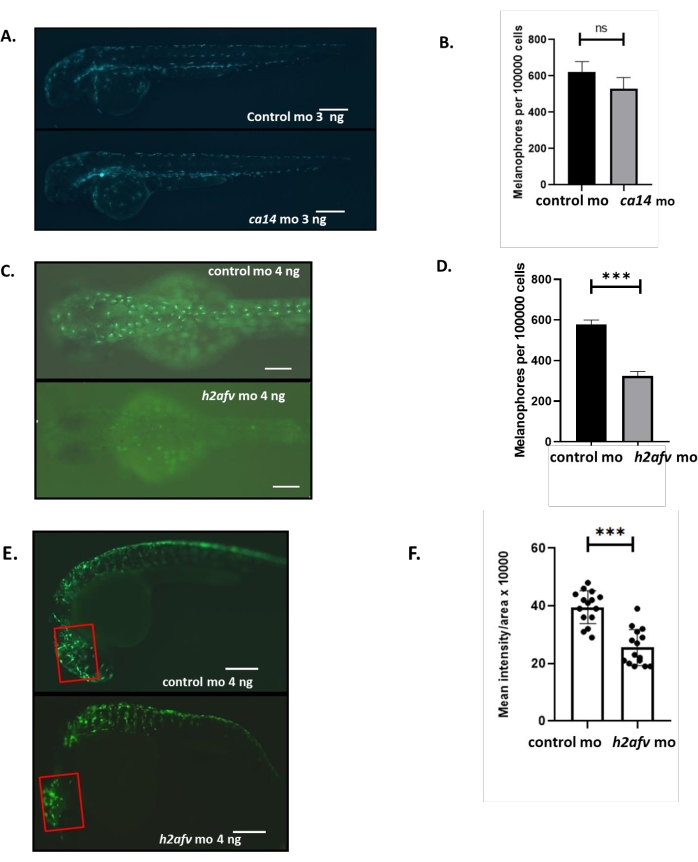
Figure 3: Quantifying fluorescently labeled cells using FACS and measuring mean fluorescence intensity. (A) Fluorescence images of ca14 and control morphant embryos at 2 dpf from Tg (ftyrp1: GFP) line, where the differentiating melanocytes are marked by GFP expression. (B) Number of melanophores in ca14 and control morphant embryos at 2 dpf remain unchanged, n = 3 biological replicates. (C) Fluorescence images at 2 dpf of h2afv and control morphants from Tg(ftyrp1:GFP) line. (D) The number of melanophores in h2afv morphants is significantly reduced compared to the control morphant embryos at 2 dpf, n = 3 biological replicates. (E) Fluorescence images of control and h2afv morphant embryos at 36 hpf from Tg(mitfa:GFP) with labeled melanocytes. (F) MFI per animal is calculated using ImageJ software and represented as a bar graph depicting individual data sets. MFI is significantly reduced in h2afv morphants compared to control. Red rectangle represents ROI chosen for ImageJ software-based analysis. n = 3 biological replicates; ***P < 0.001, ****P < 0.0001. Student's t-test; error bars are mean ± standard error of the mean (SEM); scale bars = 100 µm. Abbreviations: MO = morpholino; FACS = fluorescence-activated cell sorting; GFP = green fluorescent protein; dpf = days post fertilization; ROI = region of interest; MFI = mean fluorescence intensity. Please click here to view a larger version of this figure.
Supplemental Figure S1: Quantitation of head melanophores. (A) Dorsal view of h2afv and control morphants at 48 hpf showing head melanophores. Red box represents the ROI. Keeping the area of interest constant, the number of head melanophores can be quantified manually. (B) Number of head melanophores significantly reduced upon h2afv knockdown. Bars represent geometric mean with 95% CI of the number of head melanophores per embryo with >30 embryos each. Scale bars = 100 µm. Abbreviations: MO = morpholino; CI = confidence interval; hpf = hours post fertilization; ROI = region of interest. Please click here to download this File.
Supplemental Figure S2: Microarray of human primary melanocytes treated with PTU. Heat map shows the expression of pigmentation genes (mitf, tyrosinase, dct, mc1r) upon treatment in human primary melanocytes. Abbreviations: PTU = 1-phenyl-2-thiourea; tyr = tyrosinase. Please click here to download this File.
Pigmentation phenotype is often manifested as alterations in the content of melanin or the number of pigment-bearing melanocytes. The method described herein allows the dissection of this dichotomy and permits qualitative as well as quantitative assessment of melanin content and the number of melanophores per embryo, irrespective of the melanin content. The high fecundity of zebrafish, visible nature of pigmented melanocytes, and lack of melanosome transfer enable the dissection of melanocyte biology using this reverse genetic approach that is amenable to medium-throughput screening.
The choice of morpholino-based silencing emanates from the ease of silencing and the ability to test multiple candidates parallelly. There are certain limitations of using a morpholino-based silencing approach, and guidelines for using and interpreting these valuable tools have been described previously13. Essentially, the validation of phenotype upon knockdown using multiple MOs provides a tangible solution to this problem. An alternate strategy is the use of CRISPR-based genetic perturbation. The penetrance of the phenotype is limited due to the inherently lower frequency of genetic events and could be compounded by heterogeneous mutations. That limits its use for reverse genetic screening14.
Phenotype assessment of melanocyte-selective perturbations often results in decreased pigment content due to altered melanogenic response. However, there are several genes that perturb the specification of melanocytes and hence cause a reduction in pigmentation due to a decrease in overall melanocyte numbers. A systematic dissection of the two scenarios is essential to ascribe the molecular function of the gene in pigmentation. The measurement of melanin content is compounded by the complex nature of melanin polymer. Of the two available methods, namely melanin solubilization by NaOH and HPLC-based detection of stable melanin oxidation products 1H-pyrrole-2,3,5-tricarboxylic acid and pyrrole-2,3- dicarboxylic acid, the former method can be routinely performed in a laboratory setting while the latter requires specific standards and sophisticated instrumentation15.
Additionally, the number of embryos required by the NaOH method is also higher due to several steps involved in the detection. NaOH-based hydrolysis solubilizes melanin and enables spectrophotometric quantitation. While this method is robust and can be adopted for a medium-throughput screen (10-15 candidates at a time), xanthine present in xanthophores is a potential interfering substance due to its inherent absorption in the 400-450 nm range16. Hence, a concordance between image analysis-based mean grey value determination and melanin content assay must be carried out to confirm the reduction in the melanin content.
PTU offers an easy tool to reduce the pigmentation and visualize the otherwise transparent embryo. The use could possibly result in feedback changes and invoke alterations in melanocytes. However, we have observed minimal changes in the expression of pigmentation genes (Supplemental Figure S2).
The counting of melanocytes is easiest in the lateral mid line and the head region, as the melanocytes are relatively distinctly observable in these regions (Supplemental Figure S1). Lateral line melanophores arise from the melanocyte stem cell population that resides close to the dorsal root ganglia18. Imaging this population has several advantages such as fixed number per embryo and clear distinction. However, the two contralateral lines need to be imaged by tilting the embryo slightly; else the two merge due to the transparent nature of the embryo, making it difficult to count (Figure 1C versus Figure 2C).
Zebrafish melanophores are distinct from the pigmented cells of the eye that are derived from neuro-ectoderm. These are distinguishable by their positioning within the embryo and are evident in the eye versus the body pattern. In the FACS-based experiment, the eye-derived cells can be distinguished by their size as they are significantly smaller than the melanophores and can be gated using size or scatter criteria.
Estimates of melanocytes at different maturation stages using transgenic lines are easily carried out using image-based quantitation. Quantitation of the number of lateral-line melanophores is robust as their number varies in a window between 2 dpf and 5 dpf on each side of the embryo17. However, the number of lateral-line melanophores is determined by the migration and establishment of a dorsal root ganglion-associated stem cell pool18. Hence, any alterations in these processes can lead to a similar observation. To circumvent this confounding factor, FACS-based estimation of all melanophores is a tangible solution.
Alternately, quantitation of head melanophores can be performed as delineated in Supplemental Figure S1 as a surrogate for melanophore numbers. It is interesting to note that the alterations in steady-state levels of melanocyte numbers could signify two opposite functions for the candidate gene in question. It could either result in decreased specification of melanocytes from neural-crest precursors or cause melanocyte-specific death and need to be addressed using methods such as the tunnel assay. Variations such as microinjections followed by live-cell imaging would enable monitoring other melanocyte-specific phenotypes such as migration and patterning. Of interest to pigment-cell researchers would be the process of melanosome transfer, which is not operative in the fish system. However, concerted melanosome movement in melanophores can be studied with alterations in live-cell imaging described herein with modifications. In all, the detailed protocol presented in this video article would enable pigment cell biology researchers to query candidate genes and assess their role in melanocyte biology.
The authors have nothing to disclose.
We acknowledge the funding support from the Council for Scientific and Industrial Research vide project MLP2008 and the Department of Science and Technology for the project GAP165 for supporting the work presented in this manuscript. We thank Jeyashri Rengaraju and Chetan Mishra for their help with experiments.
1.5 mL Microtubes | Axygen | MCT-150-A | For preparing MO solution |
2 mL Microtubes | Axygen | MCT-200-C | For washing steps in FACS protocol |
Agarose | Sigma-Aldrich | A-9539-500G | For microinjection |
BD FACSAria II | BD Biosciences | NA | For cell sorting |
Capillary tube | Drummond | 1-000-0010 | |
Corning cell strainer | Corning | CLS431751 | For making single cell suspension |
DMEM High Glucose Media | Sigma-Aldrich | D5648 | FACS protocol |
Ethyl 3-aminobenzoate methanesulfonate (Tricaine) | Sigma-Aldrich | E10521-50G | to immobilize ZF for imaging |
Ethylenediaminetetraacetic acid disodium salt dihydrate (EDTA) | Sigma-Aldrich | E5134 | For cold lysis buffer |
FACS tubes | BD-Biosciences | 342065 | FACS protocol |
Fetal bovine serum (FBS) | Invitrogen | 10270 | FACS protocol |
Graphpad prism Software | Graphstats Technologies | NA | For data representation |
ImageJ Software | National Institute of health | NA | For image analysis |
Insulin Syringes (1 mL) | DispoVan | NA | For manual dechorionation |
Melanin, Synthetic | Sigma-Aldrich | M8631 | For melanin content assay |
Methylcellulose | Sigma-Aldrich | M7027-250G | to immobilize ZF for imaging |
Microloader tips | Eppendorf | 5242956003 | For microinjection |
Morpholino | Gene-tools | NA | For knock-down experiments |
N-Phenylthiourea (PTU) | Sigma-Aldrich | P7629 | to inhibit melanin formation |
Needle puller | Sutter Instrument | P-97 | For microinjection |
Nunc 15 mL Conical Sterile Polypropylene Centrifuge Tubes | Thermo Fisher Scientific | 339650 | FACS protocol |
Petridish (60 mm) | Tarsons | 460090 | For embryo plates |
Phenylmethylsulphonyl fluoride | Sigma-Aldrich | 10837091001 | For cold lysis buffer |
Phosphate buffer saline (PBS) | HiMedia | TL1099-500mL | For washing cells |
Pronase | Sigma-Aldrich | 53702 | For dechorionation |
Protease inhibitor cocktail | Sigma-Aldrich | P8340 | For cold lysis buffer |
Sheath fluid | BD FACSFlowTM | 342003 | FACS protocol |
Sodium phosphate | Merck | 7558-79-4 | Cold lysis buffer |
Triton X-100 | Sigma-Aldrich | T9284-500ML | For cold lysis buffer |
TrypLE | Gibco | 1677119 | For trypsinization |