Summary

自发荧光成像评估细胞代谢

Published: November 15, 2021
doi:

Summary

该协议描述了内源性代谢辅酶,还原烟酰胺腺嘌呤(磷酸盐)二核苷酸(NAD(P)H)和氧化黄素腺嘌呤二核苷酸(FAD)的荧光成像和分析。NAD(P)H 和 FAD 的自发荧光成像提供了一种无标记、无损的方法来评估细胞代谢。

Abstract

细胞代谢是细胞产生能量的过程,许多疾病,包括癌症,都以异常代谢为特征。还原的烟酰胺腺嘌呤(磷酸盐)二核苷酸(NAD(P)H)和氧化的黄素腺嘌呤二核苷酸(FAD)是代谢反应的辅酶。NAD(P)H和FAD表现出自发荧光,可以通过激发和发射波长进行光谱隔离。辅酶NAD(P)H和FAD都可以以游离或蛋白质结合的构型存在,每种构型都具有不同的荧光寿命 – 荧光团保持在激发态的时间。荧光寿命成像(FLIM)可以量化NAD(P)H和FAD的荧光强度和寿命,以便对细胞代谢进行无标记分析。通过选择适当的激发和发射波长,可以针对 NAD(P)H 和 FAD 成像优化荧光强度和寿命显微镜。氰化物的代谢扰动验证了自发荧光成像方案,以检测细胞内的代谢变化。本文将展示NAD(P)H和FAD的自发荧光成像技术,用于测量细胞代谢。

Introduction

新陈代谢是产生能量的细胞过程。细胞代谢包括多种途径,包括糖酵解、氧化磷酸化和谷氨酰胺溶解。健康细胞利用这些代谢途径产生增殖和功能的能量,例如免疫细胞产生细胞因子。许多疾病,包括代谢紊乱、癌症和神经变性,其特征是细胞代谢改变1。例如,即使在氧气存在下,某些癌细胞类型的糖酵解速率也较高,以产生用于合成核酸,蛋白质和脂质的分子23。这种现象被称为Warburg效应,是许多癌症类型的标志,包括乳腺癌,肺癌和胶质母细胞瘤4。由于与癌症进展相关的细胞代谢的改变,细胞代谢可以成为药物反应的替代生物标志物56。此外,在细胞水平上了解药物疗效至关重要,因为细胞异质性可导致个体中不同的药物反应78

识别和量化细胞代谢变化的技术对于癌症和药物反应的研究至关重要。化学和蛋白质分析用于评估细胞或组织的代谢,但缺乏单细胞分辨率和空间信息。基于代谢读板仪的测定可以测量样品中随时间推移的pH值和氧气消耗量以及随后化学物质的代谢扰动。pH值可用于计算细胞外酸化速率(ECAR),从而深入了解细胞的糖酵解活性9。全身成像方法,包括2-[氟-18]氟-D-葡萄糖正电子发射断层扫描(FDG PET)和磁共振波谱(MRS),是临床上用于通过代谢测量识别肿瘤复发和药物疗效的非侵入性成像方式1011121314

FDG-PET成像了FDG的组织摄取,FDG是一种放射性标记的葡萄糖类似物。肿瘤相对于周围组织对FDG-PET的摄取增加是由于Warburg效应1213。MRS图像用于代谢的分子的常见核,如 13C31P,并且可以获得有关代谢如何响应刺激而变化的动态信息,如运动或饮食14。虽然FDG-PET和MRS可用于临床,但这些技术缺乏解决肿瘤内异质性的空间分辨率。同样,对大量细胞群进行耗氧量测量。自发荧光成像克服了这些技术的空间分辨率障碍,并提供了一种量化细胞代谢的非侵入性方法。

Figure 1
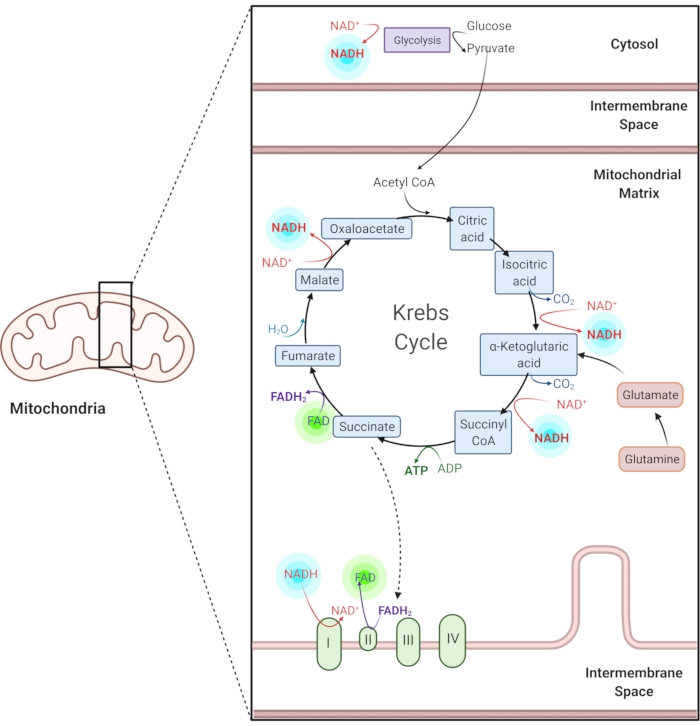
图1:常见代谢途径中的NADH和FAD。 NADH和FAD是用于糖酵解,克雷布斯循环和电子传递链的辅酶。这些分子的自发荧光成像提供有关细胞代谢的信息。 请点击此处查看此图的放大版本。

还原的烟酰胺腺嘌呤(磷酸盐)二核苷酸(NAD(P)H)和氧化的黄素腺嘌呤二核苷酸(FAD)是代谢反应的辅酶,包括糖酵解,氧化磷酸化和谷氨酰胺溶解(图1)。NAD(P)H 和 FAD 都是自发荧光的,为荧光成像提供内源性对比115。NADPH具有与NADH相似的荧光特性。因此,NAD(P)H通常用于表示NADH和NADPH216的组合信号。

荧光寿命成像(FLIM)量化荧光寿命或荧光团处于激发态的时间。荧光寿命对荧光团的微环境有反应,并提供有关细胞代谢的信息17。NAD(P)H和FAD可以存在于蛋白质结合或游离构象的细胞内,每种构象都有不同的寿命。游离NAD(P)H的寿命比蛋白质结合的NAD(P)H短;相反,自由 FAD 的寿命比绑定的 FAD1819 长。寿命和寿命组分重量可以通过方程(120从荧光寿命衰减数据进行量化:

It) = α 1e-t/τ1 + α 2e-t/τ2 + C1

等式(1)表示归一化的荧光强度作为时间的函数。该等式中的α 1 和α 2 分别表示短寿命和长寿命的比例分量(α 12=1),τ1τ2 分别代表短寿命和长寿命,C占背景光720。振幅加权寿命(此处表示为τm)是使用等式(2)计算的。

τm= α 1τ1+ α 2τ22

平均寿命可以通过在荧光团的强度衰变上平均“t”来计算,对于双指数衰减,方程(31721显示了该衰变。

τ*m= (α 1τ12+ α 2τ22)/ (α 1τ1+ α 2τ2) (3

通过积分荧光寿命衰减,可以从寿命图像中计算出荧光强度图像。自发荧光成像是一种无损且无标记的方法,可用于以亚细胞分辨率表征活细胞的代谢。光学氧化还原比提供电池化学氧化还原状态的光学模拟度量,并计算为NAD(P)H和FAD强度的比值。虽然计算光学氧化还原比的公式不是标准化的22232425,但这里将其定义为FAD在NAD(P)H和FAD的组合强度上的强度。使用这个定义是因为分母中的总强度使度量归一化为0和1之间的度量,氰化物抑制的预期结果是氧化还原比的降低。游离 NAD(P)H 和 FAD 的荧光寿命可深入了解代谢溶剂微环境的变化,包括 pH、温度、与氧气的接近度和渗透压17

NAD(P)H和FAD结合组分的荧光寿命变化可指示代谢途径利用和底物特异性代谢26。组分权重可以解释为辅酶的自由到结合部分的变化1819。总而言之,这些定量的自发荧光寿命指标允许分析细胞代谢,并且自发荧光成像已用于识别正常组织中的肿瘤2728,表征干细胞2930,评估免疫细胞功能3132333435,测量神经活性363738,并了解药物在乳腺癌和头颈部癌症等癌症类型中的疗效2139404142。高分辨率自发荧光成像可与图像分割相结合,用于单细胞分析和种群内异质性量化4344454647

NAD(P)H和FAD可以在配置为强度或寿命成像的单光子或多光子荧光显微镜上成像。对于单光子显微镜,NAD(P)H 和 FAD 通常分别在 375-405 nm 和 488 nm 波长处激发,因为这些波长处有常见的激光源48。在双光子荧光激发中,NAD(P)H和FAD将分别在大约700至750nm和700至900nm的波长下激发1549。一旦荧光团被激发,NAD(P)H和FAD分别发射波长在~410 nm至~490nm和~510nm至~640nm之间的光子15。NAD(P)H 和 FAD 最大发射波长分别约为 450 nm 和 535 nm48

由于它们的激发和发射波长不同,两种代谢辅酶的荧光可以被光谱分离。了解NAD(P)H和FAD的光谱特性对于设计和优化自发荧光成像方案是必要的。氰化物是一种电子传递链(ETC)复合IV抑制剂。氰化物对细胞代谢的影响以及细胞内NAD(P)H和FAD的自发荧光强度和寿命得到了很好的表征2740。因此,氰化物扰动实验是验证NAD(P)H和FAD成像方案的有效手段。成功的氰化物实验提供了NAD(P)H和FAD成像方案可用于评估未知组或扰动代谢的信心。

Protocol

1. 用于成像的细胞电镀 从80-90%汇合的MCF-7细胞的T-75烧瓶中吸出培养基,用10mL无菌磷酸盐缓冲盐水(PBS)冲洗细胞,并加入2mL0.25%胰蛋白酶(1x)以将细胞从烧瓶底部分离。 将烧瓶在37°C孵育约4分钟。在显微镜下检查细胞以确认脱离。 立即加入8mL培养基以停用胰蛋白酶。 将细胞收集在锥形管(15 mL或50 mL)中。使用血细胞计数器计数细胞。 将细胞?…

Representative Results

上皮乳腺癌细胞系MCF-7在补充有10%胎牛血清(FBS)和1%青霉素 – 链霉素的DMEM中培养。对于荧光成像,在成像前48小时,将细胞以每35mm玻璃底成像培养皿4×10⁵个细胞的密度接种。使用上述方案对细胞进行氰化物处理之前和之后进行成像。氰化物实验的目的是确认NAD(P)H和FAD荧光的光谱分离,并验证用于检测细胞代谢变化的成像系统和分析方案。配对的NAD(P)H和FAD荧光寿命图像在氰化物之?…

Discussion

自发荧光强度和终生成像已被广泛用于评估细胞的新陈代谢2155。FLIM具有高分辨率,因此可以解决单个细胞,这对于癌症研究很重要,因为细胞异质性有助于肿瘤侵袭性和耐药性73941444546?…

Divulgazioni

The authors have nothing to disclose.

Acknowledgements

资金来源包括德克萨斯州癌症预防和研究所(CPRIT RP200668)和德克萨斯A&M大学。 图 1 是使用 BioRender.com 创建的。

Materials

2-deoxy-d-glucose (2-DG) Sigma AC111980000; AC111980010; AC111980050; AC111980250
Antibiotic Antimicrobial (pen-strep) Gibco 15240096
Cell Samples American Type Culture Collection N/A MCF-7 cancer line
CellProfiler Broad Institute N/A Image analysis software
Conical Tube VWR 89039-664 15 mL conical tube
DMEM ThermoFisher 11965092 Culture media
FAD dichroic mirror Semrock FF495-Di03-25×36 495 nm
FAD emission filter Semrock FF01-550/88-25 550/88 nm
FAD excitation filter Semrock FF01-458/64-25 458/64 nm
FBS ThermoFisher 16000036
Fluorescence Lifetime Microscope 3i N/A
Glass bottom dish MatTek Corp P35G-1.0-14-C
Multiphoton Laser Coherent N/A 2P Coherent Laser, Tunable 680 nm-1080 nm
NAD(P)H dichroic mirror Semrock FF409-Di03-25×36 409 nm
NAD(P)H emission filter Semrock FF02-447/60-25 447/60 nm
NAD(P)H excitation filter Semrock FF01-357/44-25 357/44 nm
PBS ThermoFisher 70011044
Potassium Cyanide Sigma-Aldrich 380970
SlideBooks 6 3i N/A Image acquisition software
SPCImage Becker & Hickl GmbH N/A Fluorescence lifetime analysis software
Stage Top Incubator okoLab N/A
Trypsin Biosciences 786-262
Urea Sigma-Aldrich U5128
YG beads Polysciences 19096-2 Yg microspheres (20.0 µm)

Riferimenti

  1. Heikal, A. A. Intracellular coenzymes as natural biomarkers for metabolic activities and mitochondrial anomalies. Biomarkers in Medicine. 4 (2), 241-263 (2010).
  2. Georgakoudi, I., Quinn, K. P. Optical imaging using endogenous contrast to assess metabolic state. Annual Review of Biomedical Engineering. 14, 351-367 (2012).
  3. Zheng, J. Energy metabolism of cancer: Glycolysis versus oxidative phosphorylation (Review). Oncology Letters. 4 (6), 1151-1157 (2012).
  4. Potter, M., Newport, E., Morten, K. J. The Warburg effect: 80 years on. Biochemical Society Transactions. 44 (5), 1499-1505 (2016).
  5. Zhao, Y., Butler, E. B., Tan, M. Targeting cellular metabolism to improve cancer therapeutics. Cell Death and Disease. 4 (3), 532 (2013).
  6. Patel, S., Ahmed, S. Emerging field of metabolomics: Big promise for cancer biomarker identification and drug discovery. Journal of Pharmaceutical and Biomedical Analysis. 107, 63-74 (2015).
  7. Walsh, A. J., Cook, R. S., Skala, M. C. Functional optical imaging of primary human tumor organoids: Development of a personalized drug screen. Journal of Nuclear Medicine. 58 (9), 1367-1372 (2017).
  8. Zaal, E. A., Berkers, C. R. The influence of metabolism on drug response in cancer. Frontiers in Oncology. 8, 500 (2018).
  9. Little, A. C., et al. High-content fluorescence imaging with the metabolic flux assay reveals insights into mitochondrial properties and functions. Communications Biology. 3 (1), 271 (2020).
  10. Wang, X., et al. Comparison of magnetic resonance spectroscopy and positron emission tomography in detection of tumor recurrence in posttreatment of glioma: A diagnostic meta-analysis. Asia-Pacific Journal of Clinical Oncology. 11 (2), 97-105 (2015).
  11. Nabi, H. A., Zubeldia, J. M. Clinical applications of 18F-FDG in oncology. Journal of Nuclear Medicine Technology. 30 (1), 3-9 (2002).
  12. Kostakoglu, L., Agress, H., Goldsmith, S. J. Clinical role of FDG PET in evaluation of cancer patients. Radiographics. 23 (2), 315-340 (2003).
  13. Hoh, C. K. Clinical use of FDG PET. Nuclear Medicine and Biology. 34 (7), 737-742 (2007).
  14. van de Weijer, T., Schrauwen-Hinderling, V. B. Application of magnetic resonance spectroscopy in metabolic research. Biochimica et Biophysica Acta. Molecular Basis of Disease. 1865 (4), 741-748 (2019).
  15. Huang, S., Heikal, A. A., Webb, W. W. Two-photon fluorescence spectroscopy and microscopy of NAD(P)H and Flavoprotein. Biophysical Journal. 82, 2811-2825 (2002).
  16. Lagarto, J. L., et al. Characterization of NAD(P)H and FAD autofluorescence signatures in a Langendorff isolated-perfused rat heart model. Biomedical Optics Express. 9 (10), 4961-4978 (2018).
  17. Lakowicz, J. R. . Principles of fluorescence spectroscopy. , (2013).
  18. Lakowicz, J. R., Szmacinski, H., Nowaczyk, K., Johnson, M. L. Fluorescence lifetime imaging of free and protein-bound NADH. Proceedings of the National Academy of the Sciences of the United States of America. 89 (4), 1271-1275 (1992).
  19. Nakashima, N., Yoshihara, K., Tanaka, F., Yagi, K. Picosecond fluorescence lifetime of the coenzyme of D-amino acid oxidase. Journal of Biological Chemistry. 255 (11), 5261-5263 (1980).
  20. Hu, L., Wang, N., Cardona, E., Walsh, A. J. Fluorescence intensity and lifetime redox ratios detect metabolic perturbations in T cells. Biomedical Optics Express. 11 (10), 5674-5688 (2020).
  21. Datta, R., Heaster, T. M., Sharick, J. T., Gillette, A. A., Skala, M. C. Fluorescence lifetime imaging microscopy: fundamentals and advances in instrumentation, analysis, and applications. Journal of Biomedical Optics. 25 (7), 1-43 (2020).
  22. Liu, Z., et al. Mapping metabolic changes by noninvasive, multiparametric, high-resolution imaging using endogenous contrast. Science Advances. 4 (3), (2018).
  23. Georgakoudi, I., Quinn, K. P. Optical imaging using endogenous contrast to assess metabolic state. Annual Review of Biomedical Engineering. 14, 351-367 (2012).
  24. Varone, A., et al. Endogenous two-photon fluorescence imaging elucidates metabolic changes related to enhanced glycolysis and glutamine consumption in precancerous epithelial tissues. Ricerca sul cancro. 74 (11), 3067-3075 (2014).
  25. Chance, B., Schoener, B., Oshino, R., Itshak, F., Nakase, Y. Oxidation-reduction ratio studies of mitochondria in freeze-trapped samples. NADH and flavoprotein fluorescence signals. Journal of Biological Chemistry. 254 (11), 4764-4771 (1979).
  26. Sharick, J. T., et al. Protein-bound NAD(P)H lifetime is sensitive to multiple fates of glucose carbon. Scientific Reports. 8 (1), 5456 (2018).
  27. Skala, M. C., et al. In vivo multiphoton microscopy of NADH and FAD redox states, fluorescence lifetimes, and cellular morphology in precancerous epithelia. Proceedings of the National Academy of Sciences of the United States of America. 104 (49), 19494-19499 (2007).
  28. Skala, M. C., et al. In vivo multiphoton fluorescence lifetime imaging of protein-bound and free nicotinamide adenine dinucleotide in normal and precancerous epithelia. Journal of Biomedical Optics. 12 (2), 024014 (2007).
  29. Uchugonova, A. A., König, K. Two-photon autofluorescence and second-harmonic imaging of adult stem cells. Journal of Biomedical Optics. 13 (5), 054068 (2008).
  30. Miranda-Lorenzo, I., et al. Intracellular autofluorescence: a biomarker for epithelial cancer stem cells. Nature Methods. 11 (11), 1161-1169 (2014).
  31. Walsh, A. J., et al. Classification of T-cell activation via autofluorescence lifetime imaging. Nature Biomedical Engineering. 5 (1), 77-88 (2021).
  32. Heaster, T. M., Humayun, M., Yu, J., Beebe, D. J., Skala, M. C. Autofluorescence imaging of 3D tumor-macrophage microscale cultures resolves spatial and temporal dynamics of macrophage metabolism. Ricerca sul cancro. 80 (23), 5408-5423 (2020).
  33. Pavillon, N., Hobro, A. J., Akira, S., Smith, N. I. Noninvasive detection of macrophage activation with single-cell resolution through machine learning. Proceedings of the National Academy of Sciences of the United States of America. 115 (12), 2676-2685 (2018).
  34. Chang, C. H., et al. Posttranscriptional control of T cell effector function by aerobic glycolysis. Cell. 153 (6), 1239-1251 (2013).
  35. Kaech, S. M., Cui, W. Transcriptional control of effector and memory CD8+ T cell differentiation. Nature Reviews. Immunology. 12 (11), 749-761 (2012).
  36. Gómez, C. A., Fu, B., Sakadžić, S., Yaseena, M. A. Cerebral metabolism in a mouse model of Alzheimer’s disease characterized by two-photon fluorescence lifetime microscopy of intrinsic NADH. Neurophotonics. 5 (4), 045008 (2018).
  37. Yaseen, M. A., et al. In vivo imaging of cerebral energy metabolism with two-photon fluorescence lifetime microscopy of NADH. Biomedical Optics Express. 4 (2), 307-321 (2013).
  38. Bower, A. J., et al. High-speed label-free two-photon fluorescence microscopy of metabolic transients during neuronal activity. Applied Physics Letters. 118 (8), 081104 (2021).
  39. Walsh, A. J., et al. Quantitative optical imaging of primary tumor organoid metabolism predicts drug response in breast cancer. Ricerca sul cancro. 74 (18), 5184-5194 (2014).
  40. Walsh, A. J., et al. Optical metabolic imaging identifies glycolytic levels, subtypes, and early-treatment response in breast cancer. Ricerca sul cancro. 73 (20), 6164-6174 (2013).
  41. Chowdary, M. V. P., et al. Autofluorescence of breast tissues: Evaluation of discriminating algorithms for diagnosis of normal, benign, and malignant conditions. Photomedicine and Laser Surgery. 27 (2), 241-252 (2009).
  42. Demos, S. G., Bold, R., White, R. D., Ramsamooj, R. Investigation of near-infrared autofluorescence imaging for the detection of breast cancer. IEEE Journal of Selected Topics in Quantum Electronics. 11 (4), 791-798 (2005).
  43. Heaster, T. M., Humayun, M., Yu, J., Beebe, D. J., Skala, M. C. Autofluorescence imaging of 3D tumor-macrophage microscale cultures resolves spatial and temporal dynamics of macrophage metabolism. Ricerca sul cancro. 80 (23), 5408-5423 (2020).
  44. Sharick, J. T., et al. Cellular metabolic heterogeneity in vivo is recapitulated in tumor organoids. Neoplasia. 21 (6), 615-626 (2019).
  45. Shah, A. T., Diggins, K. E., Walsh, A. J., Irish, J. M., Skala, M. C. In vivo autofluorescence imaging of tumor heterogeneity in response to treatment. Neoplasia. 17 (12), 862-870 (2015).
  46. Walsh, A. J., Skala, M. C. Optical metabolic imaging quantifies heterogeneous cell populations. Biomedical Optics Express. 6 (2), 559-573 (2015).
  47. Walsh, A. J., Skala, M. C. An automated image processing routine for segmentation of cell cytoplasms in high-resolution autofluorescence images. Multiphoton Microscopy in the Biomedical Sciences XIV. , (2014).
  48. Skala, M., Ramanujam, N. . Methods in Molecular Biology. 594, 155-162 (2010).
  49. Stringari, C., et al. Multicolor two-photon imaging of endogenous fluorophores in living tissues by wavelength mixing. Scientific Reports. 7, 3792 (2017).
  50. SPCImage 2.9: Data analysis software for fluorescence lifetime imaging microscopy. SPCImage Available from: https://biology.uiowa.edu/sites/biology.uiowa.edu/files/SPCIMAGE29.pdf (2007)
  51. . CellProfiler Available from: https://cellprofiler.org/releases (2007)
  52. Autofluorescence Imaging. GitHub Available from: https://github.com/walshlab/Autofluorescence-Imaging (2021)
  53. Ramey, N. A., Park, C. Y., Gehlbach, P. L., Chuck, R. S. Imaging mitochondria in living corneal endothelial cells using autofluorescence microscopy. Photochemistry and Photobiology. 83 (6), 1325-1329 (2007).
  54. Walsh, A., Cook, R. S., Rexer, B., Arteaga, C. L., Skala, M. C. Optical imaging of metabolism in HER2 overexpressing breast cancer cells. Biomedical Optics Express. 3 (1), 75-85 (2012).
  55. Kolenc, O. I., Quinn, K. P. Evaluating cell metabolism through autofluorescence imaging of NAD(P)H and FAD. Antioxidants & Redox Signaling. 30, 875-889 (2019).
  56. Bird, D. K., et al. Metabolic mapping of MCF10A human breast cells via multiphoton fluorescence lifetime imaging of the coenzyme NADH. Ricerca sul cancro. 65, 8766-8773 (2005).
  57. Walsh, A. J., et al. Optical metabolic imaging identifies glycolytic levels, subtypes, and early-treatment response in breast cancer. Ricerca sul cancro. 73 (20), 6164-6174 (2013).
  58. Walsh, A. J., Castellanos, J. A., Nagathihalli, N. S., Merchant, N. B., Skala, M. C. Optical imaging of drug-induced metabolism changes in murine and human pancreatic cancer organoids reveals heterogeneous drug response. Pancreas. 45 (6), 863-869 (2016).
  59. Gubser, P. M., et al. Rapid effector function of memory CD8+ T cells requires an immediate-early glycolytic switch. Nature Immunology. 14 (10), 1064-1072 (2013).
  60. Papalexi, E., Satija, R. Single-cell RNA sequencing to explore immune cell heterogeneity. Nature Review. Immunology. 18 (1), 35-45 (2018).
  61. Horan, M. P., Pichaud, N., Ballard, J. W. O. Review: Quantifying mitochondrial dysfunction in complex diseases of aging. The Journals of Gerontology: Series A. 67 (10), 1022-1035 (2012).
  62. Plitzko, B., Loesgen, S. Measurement of oxygen consumption rate (OCR) and extracellular acidification rate (ECAR) in culture cells for assessment of the energy metabolism. Bio-protocol. 8 (10), 2850 (2018).
  63. . The bh TCSPC Handbook Available from: https://www.becker-hickl.com/wp-content/uploads/2021/10/SPC-handbook-9ed-05a.pdf (2021)
  64. Gadella, T. W. J., Mason, W. T. . Fluorescent and Luminescent Probes for Biological Activity. 34, 467-479 (1999).
  65. Miller, D. R., Jarrett, J. W., Hassan, A. M., Dunna, A. K. Deep tissue iImaging with multiphoton fluorescence microscopy. Current Opinion in Biomedical Engineering. 4, 32-39 (2017).
  66. Berezin, M. Y., Achilefu, S. Fluorescence lifetime measurements and biological imaging. Chemical Reviews. 110 (5), 2641-2684 (2010).
check_url/it/63282?article_type=t

Play Video

Citazione di questo articolo
Theodossiou, A., Hu, L., Wang, N., Nguyen, U., Walsh, A. J. Autofluorescence Imaging to Evaluate Cellular Metabolism. J. Vis. Exp. (177), e63282, doi:10.3791/63282 (2021).

View Video