This protocol outlines how a three-dimensional cell culture system can be used to model, treat, and analyze chromatin modifications in a near-physiological state.
Flat cultures of mammalian cells are a widely used in vitro approach for understanding cell physiology, but this system is limited in modeling solid tissues due to unnaturally rapid cell replication. This is particularly challenging when modeling mature chromatin, as fast replicating cells are frequently involved in DNA replication and have a heterogeneous polyploid population. Presented below is a workflow for modeling, treating, and analyzing quiescent chromatin modifications using a three-dimensional (3D) cell culture system. Using this protocol, hepatocellular carcinoma cell lines are grown as reproducible 3D spheroids in an incubator providing active nutrient diffusion and low shearing forces. Treatment with sodium butyrate and sodium succinate induced an increase in histone acetylation and succinylation, respectively. Increases in levels of histone acetylation and succinylation are associated with a more open chromatin state. Spheroids are then collected for isolation of cell nuclei, from which histone proteins are extracted for the analysis of their post-translational modifications. Histone analysis is performed via liquid chromatography coupled online with tandem mass spectrometry, followed by an in-house computational pipeline. Finally, examples of data representation to investigate the frequency and occurrence of combinatorial histone marks are shown.
Since the late 19th century, cell culture systems have been used as a model to study the growth and development of cells outside of the human body1,2. Their use has also been extended to study how tissues and organs function in both healthy and diseased contexts1,3. Suspension cells (e.g., blood cells) grow in Petri dishes or flasks seamlessly and interchangeably as they do not assemble in three-dimensional (3D) structures in vivo. Cells derived from solid organs can grow in either two-dimensional (2D) or 3D culture systems. In 2D culture, cells are grown in a monolayer that adheres to a flat surface2,4. 2D cell culture systems are characterized by exponential growth and a fast doubling time, typically 24 h to a few days5. Cells in 3D systems grow to form intricate cell-cell interactions modeling tissue-like conglomerates more closely, and they are characterized by their ability to reach a dynamic equilibrium where their doubling time can reach 1 month or longer5.
Presented in this paper is an innovative methodology to grow 3D spheroids in rotating cell culture systems that simulate reduced gravity6. This is a simplified derivative of a cell culture system introduced by NASA in the 1990s7. This approach minimizes shearing forces, which occur in existing methods like spinning flasks, and increases spheroid reproducibility6. In addition, the rotating bioreactor increases active nutrient diffusion, minimizing necrotic formation that occurs in systems like hanging drop cell culture where media exchange is impractical6. This way, cells grow mostly undisturbed, allowing for the formation of structural and physiological characteristics associated with cells growing in tissue. C3A hepatocytes (HepG2/C3A) cultured in this manner not only had ultrastructural organelles, but also produced amounts of ATP, adenylate kinase, urea, and cholesterol comparable to levels observed in vivo1,2. In addition, cells grown in 2D vs. 3D cell culture systems exhibit different gene expression patterns8. Gene expression analysis of C3A hepatocytes grown as 3D spheroids showed that these cells expressed a wide range of liver-specific proteins, as well as genes involved in key pathways that regulate liver function8. Prior publications demonstrated the differences between proteomes of exponentially growing cells in 2D culture vs. cells at dynamic equilibrium in 3D spheroid cultures5. These differences include cellular metabolism, which in turn affects the structure, function, and physiology of the cell5. The proteome of cells grown in 2D culture was more enriched in proteins involved in cell replication, while the proteome of 3D spheroids was more enriched in liver functionality5.
The slower replication rate of cells grown as 3D spheroids more accurately models specific phenomena associated with chromatin state and modifications (e.g. histone clipping9). Histone clipping is an irreversible histone post-translational modification (PTM) that causes proteolytic cleavage of part of the histone N-terminal tail. While its biological function is still under discussion10,11,12,13, it is clear that its presence in primary cells and liver tissue is modeled by HepG2/C3A cells grown as spheroids, but not as flat cells9. This is critical, as chromatin state and modifications regulate DNA readout mostly by modulating accessibility to genes and thus their expression14. Histone PTMs either influence chromatin state directly by affecting the net charge of the nucleosomes where histones are assembled, or indirectly by recruiting chromatin writers, readers, and erasers14. Hundreds of histone PTMs have been identified to date15, reinforcing the hypothesis that chromatin hosts a "histone code" used by the cell to interpret DNA16. However, the identification of a myriad of PTM combinations15, and the discovery that combinations of histone PTMs frequently have different biological functions from PTMs present in isolation (e.g. Fischle, et al.17), highlights that more work is required to decrypt the "histone code".
Currently, histone PTM analysis is either based on techniques utilizing antibodies (e.g., western blots, immunofluorescence, or chromatin immunoprecipitation followed by sequencing [ChIP-seq]) or mass spectrometry (MS). Antibody-based techniques have high sensitivity and can provide detailed information about the genome-wide localization of histone marks but are frequently limited in studying rare PTMs or PTMs present in combinations18,19,20. MS is more suitable for high-throughput and unbiased identification and quantification of single and co-existing protein modifications, in particular histone proteins18,19,20. For these reasons, this and several other laboratories have optimized the MS pipeline for the analysis of histone peptides (bottom-up MS), intact histone tails (middle-down MS), and full-length histone proteins (top-down MS)21,22,23.
Detailed below is a workflow for growing HepG2/C3A spheroids and preparing them for histone peptide analysis (bottom-up MS) via nano-liquid chromatography, coupled online with tandem mass spectrometry (nLC-MS/MS). A 2D cell culture was grown and the cells were harvested and transferred to a bioreactor where they would start to form spheroids (Figure 1). After 18 days in culture, spheroids were treated with sodium butyrate or sodium succinate to increase the relative abundances of histone acetylation and succinylation. Notably, 3D cultures can be treated with genotoxic compounds just as well as their flat culture equivalents; in fact, recent publications highlight that the toxicology response of cells in 3D culture is more similar to primary tissues than those in 2D flat culture24,25. Cells were then collected at specified time points and nuclear isolation was performed. Then, histones were extracted and derivatized with propionic anhydride before and after trypsin digestion according to a protocol first developed by Garcia et al.26. This procedure generates peptides of an appropriate size for online separation with reversed-phase chromatography (C18) and detection with MS. Finally, histone peptides were identified and quantified, and the generated data was represented in multiple ways for a more complete biological interpretation.
1. Preparation of buffers and reagents
2. Preparation of the 3D culture system
NOTE: Different cells, primary or immortalized, have different culture properties, so the formation of spheroids may differ among cell types. This protocol has been established for HepG2/C3A spheroid formation using bioreactors and an innovative 3D cell culture system.
3. Growth of spheroids in bioreactors
NOTE: To preserve the structure of spheroids, wide bore tips are used for handling the 3D structures.
4. Spheroid treatment and collection
NOTE: In this protocol, HepG2/C3A spheroids are treated with sodium butyrate (NaBut) and sodium succinate (NaSuc) to evaluate the levels of histone marks containing acetylation and succinylation, respectively.
5. Histone extraction
NOTE: The many basic amino acid residues present in histones allow them to closely interact with DNA, which has a phosphoric acid backbone. Because histones are some of the most basic proteins in the nucleus, when they are extracted with ice-cold sulfuric acid (0.2 M H2SO4) there is minimal contamination. The non-histone proteins will precipitate in strong acid. Highly concentrated trichloroacetic acid (TCA) diluted to a final concentration of 33% is used afterward to precipitate the histones from the sulfuric acid. Keep all samples, tubes, and reagents on ice for the entire histone extraction.
6. First round of derivatization
NOTE: The use of trypsin to digest histone proteins leads to excessively small peptides that are difficult to identify using traditional proteomics setups. For this reason, propionic anhydride is used to chemically derivatize the ɛ-amino groups of unmodified and monomethyl lysine residues. This restricts trypsin proteolysis to C-terminal arginine residues. For samples in 96-well plates, the use of multi-channel pipettes and reservoirs for reagent pick up is recommended (Figure 2A). Derivatization is also performed after digestion to label the free N-termini of the peptides increasing peptide hydrophobicity and thus reversed-phase chromatographic retention.
7. Histone digestion
NOTE: Histones are digested into peptides using trypsin, which cuts at the carboxyl side of arginine and lysine residues. However, since propionylation modifies lysine residues, only arginine residues are cleaved (Figure 2B).
8. Derivatization of peptide N-termini
NOTE: The propionylation of histone peptides at their N-terminus improves retention of the shortest peptides by reversed-phase liquid chromatography (e.g., amino acids 3-8 of histone H3), as the propionyl group increases peptide hydrophobicity.
9. Desalting and sample cleanup
NOTE: Salts that are present in the sample interfere with mass spectrometry analysis. Salts are also ionized during electrospray and can suppress signals from peptides. Salts can form ionic adducts on peptides, which cause the adducted peptide to have a different mass. This reduces the peptide's signal intensity and prevents proper identification and quantification. The setup for desalting is illustrated in Figure 2C.
10. Histone peptide analysis via liquid chromatography coupled with mass spectrometry
11. Data analysis
In this protocol, HepG2/C3A spheroids were treated with 20 mM NaBut and 10 mM NaSuc, both of which affected global levels of histone PTMs (Figure 3A). Histone PTMs were then identified and quantified at the single residue level via MS/MS acquisition (Figure 3B).
When samples are run in replicates, statistical analysis can be performed to assess the fold change enrichment of a PTM between samples, as well as the reproducibility of the observation. The data shown demonstrate that peptides modified with acetylations are enriched in spheroids treated with NaBut vs. control (Figure 3C), while samples treated with NaSuc have a higher relative abundance of histone peptides modified with lysine succinylation (Figure 3D). These calculations were done in a spreadsheet program as detailed in a separate publication34. An overall increase of a given histone modification can be better represented in radar plots, where observing a higher global abundance of a certain modification becomes more intuitive, even while maintaining detailed information about the modification sites analyzed (Figure 3E,F).
This protocol generates a peptide from histone H3 amino acid residues 9-17, which include the frequently modified residues K9, S10, and K14. The data shown indicate that treatment with NaBut increases the levels of H3K14ac, but only on histones co-modified with H3K9me2 and not H3K9me3 (Figure 4A). The co-existence frequency between two modifications can be represented more intuitively as a ring graph, where the nodes represent individual modifications while the thickness of connector lines represents the co-existence frequency between the two PTMs (Figure 4B). Sometimes, the co-existence frequency is unaffected, but data represented as bar plots might be misleading. For instance, the data represented in Figure 4A indicate that the combination H3K9me2K14ac is more abundant in NaBut treatment than in control. This is correct, but this given combination is the most frequent regardless of the treatment. Figure 4B clearly shows that H3K9me2K14ac and H3K9me3K14ac are the most frequent combinatorial patterns regardless of the treatment (line thickness), but that global levels of H3K14ac (node) are what is truly changing in the experiment.
This protocol generates a peptide from histone H4 residues 4-17, which includes modifiable residues at positions K5, K8, K12, and K16 (mostly by acetylations). When comparing control and NaBut treatment, it is possible to observe an increase in combinations of acetylations by representing data as, for example, word clouds (Figure 4C). This representation clearly highlights that the unmodified version of histone H4 is most abundant in the control sample, while spheroids treated with NaBut are enriched in doubly, triply, and quadruply acetylated histone H4 proteoforms. However, word clouds are limited in displaying exact values; the relative abundance of a histone code should be de-convoluted by the size of the text, which may be inaccurately estimated. Therefore, Venn diagrams or more modern equivalents such as UpSetR representation35 can be used to show the exact quantification of co-existing histone PTMs (Figure 4D,E). The data shown highlight once again that selected combinations of acetylations on histone H4 are relatively more abundant in NaBut treatment compared to control.
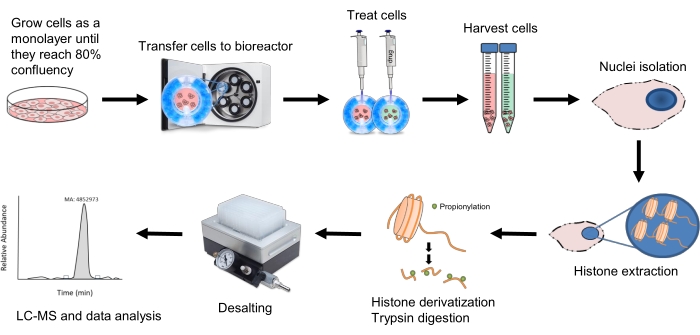
Figure 1: Workflow for histone peptide analysis of 3D spheroids. HepG2/C3A cells are first grown in 2D culture until they reach 80% confluency. The cells are then transferred to an equilibrated bioreactor and placed within the clinostat incubator where they will rotate at 10-11 rpm to form spheroids. After 18 days, the spheroids are treated with either 20 mM NaBut or 10 mM NaSuc and are harvested after their corresponding time points. Nuclei are isolated from the cells and histone extraction is performed with 0.2 M H2SO4. Histone derivatization is then performed with propionic anhydride before and after trypsin digestion to ensure retention of the resulting short peptides by liquid chromatography. Samples are desalted and then run using the LC-MS/MS method mentioned in step 10, and the resulting data is analyzed as described in step 11. Please click here to view a larger version of this figure.
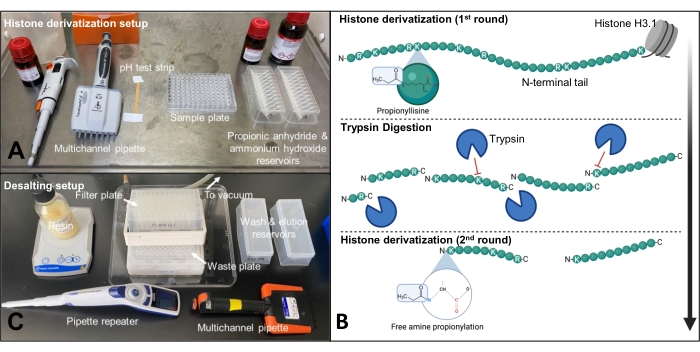
Figure 2: Setup for propionylation and desalting steps. (A) Propionylation is performed in a fume hood and all components are laid out so that the steps can be performed in quick succession. (B) Schematic of first round of propionylation, trypsin digestion, and second round of propionylation on histone H3.1 tail. (C) Desalting is performed on the bench using a 96-well vacuum manifold and a 96-well polypropylene filter plate. Please click here to view a larger version of this figure.
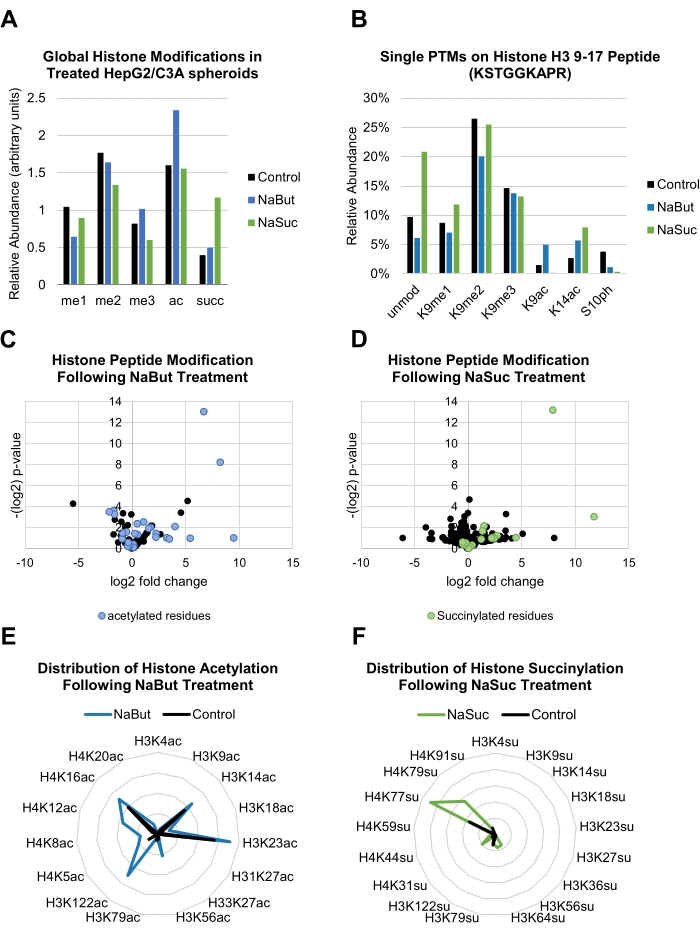
Figure 3: Representation of individual histone modifications. (A) Bar graph showing the relative abundance of common global histone modifications in control and treated (20 mM NaBut or 10 mM NaSuc) HepG2/C3A spheroids. (B) Bar graph showing the abundance of single histone PTMs occurring on residues 9-17 of histone H3 peptide (KSTGGKAPR) in control and treated (20 mM NaBut or 10 mM NaSuc) HepG2/C3A spheroids. (C,D) Volcano plots showing the fold change and significance of differential expression of histone peptide PTMs following treatment with 20 mM NaBut (C) or 10 mM NaSuc (D). Highlighted blue and green points represent acetylated and succinylated residues, respectively. (E,F) Radar plots showing the abundance of single histone peptide acetylation (E) or succinylation (F) following treatment with 20 mM NaBut or 10 mM NaSuc respectively as compared to control. Please click here to view a larger version of this figure.
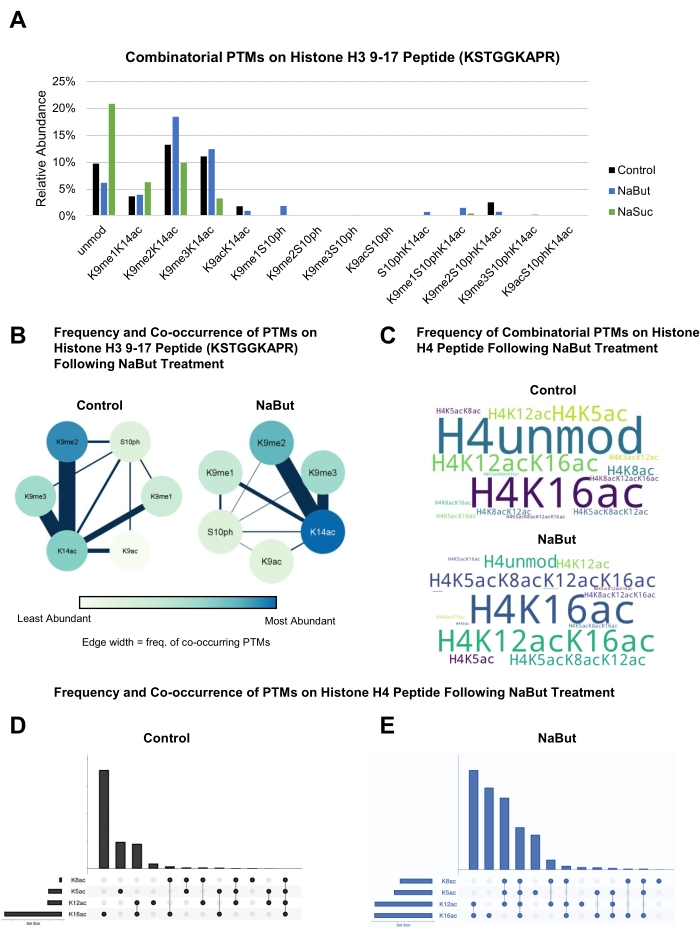
Figure 4: Representation of co-existing histone modifications. (A) Bar graph showing the abundance of combinatorial histone PTMs occurring on residues 9-17 of histone H3 (KSTGGKAPR) in control and treated (20 mM NaBut or 10 mM NaSuc) HepG2/C3A spheroids. (B) Ring graphs showing the relationship between combinatorial histone PTMs on residues 9-17 of histone H3 (KSTGGKAPR) in control and treated (20 mM NaBut) HepG2/C3A spheroids. The intensity of the node color corresponds to the abundance of a single PTM within its treatment group, while the line thickness corresponds to the frequency of PTM co-occurrence. (C) Word clouds showing the frequency of combinatorial histone PTMs on histone H4 residues in control and treated (20 mM NaBut) HepG2/C3A spheroids. The size of the text corresponds with the abundance of the specified combinatorial PTM. (D,E) Venn diagram representing the frequency of co-existing modifications on histone H4 peptide residues 4-17 in control and 20 mM NaBut treated samples. Data are displayed using the ShinyApp UpSetR35. Please click here to view a larger version of this figure.
Supplementary Table 1: List of peptides detected using this protocol. Please click here to download this Table.
The analysis of histone PTMs is fundamentally different from the typical proteomics analysis pipeline. Most histone PTMs still have enigmatic biological functions; as a result, annotations such as Gene Ontology or pathway databases are not available. Several resources exist that associate histone modifications with the enzyme responsible for their catalysis or proteins containing domains that bind these PTMs (e.g., HISTome36). As well, it is possible to speculate on the overall state of the chromatin when global levels of histone PTMs are regulated. For instance, an overall increase of histone acetylation or other acylations like succinylation is normally associated with chromatin de-condensation37,38.
MS analysis provides more detailed information about these modifications, such as their exact localization on the amino acid sequence. In this protocol, MS/MS acquisition is used to identify and quantify histone PTMs, which can be critical for biological interpretation. For example, trimethylation on lysine 4 of histone H3 (H3K4me3) is enriched on promoters of actively transcribed genes39, while the same modification on lysine 9 (H3K9me3) benchmarks constitutive heterochromatin40. Histone modifications are currently being used as biomarkers in specific diseases; as such, histone analysis can be used to study disease pathology in addition to the response to treatment (e.g., with epigenetic drugs)41,42.
It is more challenging to visually represent interactions between multiple PTMs as opposed to single PTMs. While existing charts such as ring graphs can show the co-existence frequency of two PTMs, they cannot represent the co-existence frequency between more than two PTMs at a time, since this would require a three-dimensional representation of the network. For this reason, other representations could be more appropriate to highlight changes in histone codes when three or more PTMs are considered. In general, diversifying data representation offers higher chances to observe significant changes between samples. This protocol presents examples of different illustrations for displaying regulations of histone PTMs and co-existing PTMs.
Though this protocol generates relatively small histone peptides due to trypsin digestion (approximately 4-20 amino acids), selected peptides contain multiple modifiable residues. The analysis of these peptides allows for the quantification of co-existence frequencies of PTMs, which could reveal important information about which combinatorial histone marks are regulated in a given dataset. Notably, there are no steps during sample preparation where quantification of histones is performed. There are four reasons for this: (1) trypsin has a wide range of activities and can be used at a broad range of enzyme to sample ratios (1:10-1:200). Even when the experimental yield of extracted histones differs from the expected one, issues with digestion have not been encountered using this protocol. (2) This protocol is intended for minute amounts of material, where histone quantification might be difficult to perform due to lack of sensitivity. (3) By using a constant trypsin concentration regardless of the amount of histone material, we can use tryptic peptides (as trypsin autolyzes) to benchmark chromatography performance. Slight variations in sample yield will be normalized by data analysis software (step 11), which uses all (un)modified signals for a given peptide as the denominator during the normalization process. (4) Finally, dramatic underestimation of the amount of starting material might create problems of overloading the nanoLC chromatographic column. However, performing the desalting step as indicated in this protocol prevents this issue from taking place. In case of excessive amounts of starting material (e.g. >100 µg), the limit of the capacity of the desalting resin will be exceeded, and any excess sample will be washed away during the loading step.
It is important to note that not all the peptides detected by this analysis have been highlighted in Figure 3 and Figure 4. As well, not all histone modifications are detectable using these specific sample preparation and acquisition methods. Supplementary Table 1 is provided to list all the peptide signals that are extracted using the described pipeline. A few well-known modifications are not listed in the table, as the described sample preparation is not suitable for their detection. Notable examples are ubiquitinylated peptides from histone H2A and H2B, and phosphorylation of histone H2A.X (a general marker of DNA damage). This is because the propionylation of the peptides associated with these PTMs leads to excessively long peptides, which are not suitable for C18 chromatography and the described MS detection method. Other modifications that are present in the literature but not present in Supplementary Table 1 are very low abundance modifications (currently only detectable using MS after enrichment strategies such as immunoprecipitation or specific cell treatment), such as lactylation43 or serotonylation44. Histone modifications with unpredictable mass shifts caused by polymerization or heterogeneous covalent binding to the histone sequence are also not considered (e.g., poly-ADP-ribosylation45 and glycation46). Additionally, this protocol uses NaSuc and NaBut to treat HepG2/C3A spheroids, but it can be modified for use with other drugs/epigenetic modifiers and 2D/3D cell culture types.
The authors have nothing to disclose.
The Sidoli lab gratefully acknowledges the Leukemia Research Foundation (Hollis Brownstein New Investigator Research Grant), AFAR (Sagol Network GerOmics award), Deerfield (Xseed award), Relay Therapeutics, Merck, and the NIH Office of the Director (1S10OD030286-01).
0.05% trypsin-EDTA solution | Gibco | 25300054 | |
0.5-20 µL pipet tips | BRAND | 13-889-172 (Fisher Scientific) | |
1.5 mL microcentrifuge tubes | Bio-Rad | 2239480 | |
10 µL multi-channel pipette | BRAND | BR7059000 (Millipore Sigma) | |
10 mL syringe | Henke Sass Wolf | 14-817-31 (Fisher Scientific) | Luer lock tip, graduated to 12 mL |
10, 20, 200, and 1000 µL single-channel pipettes | Eppendorf | 14-285-904 (Fisher Scientific) | |
1000 µL pipet tips | Rainin | 30389164 | |
18 G syringe needle | Air-Tite | 14-817-100 (Fisher Scientific) | 3" length, 0.05" diameter |
200 µL multi-channel pipette | Corning | 4082 | |
2-200 µL pipet tips | BRAND | Z740118 (Millipore Sigma) | |
24-well ultra-low attachment microplate | Corning | 07-200-602 | |
75 cm2 U-shaped cell culture flask | Corning | 461464U | Untreated, with vent cap |
96-well skirted plate | Axygen | PCR-96-FS-C (Corning) | |
Acetone | Fisher Scientific | A949-1 | Acetone should be used cold |
Ammonium bicarbonate (NH4HCO3) | Sigma-Aldrich | A6141-25G | |
Ammonium hydroxide solution | Fisher Scientific | AC423300250 | |
Cell culture grade water | Corning | 25-055-CV | |
ClinoReactor | CelVivo | 10004-12 | Bioreactor for 3D cell culture |
ClinoStar | CelVivo | N/A | Clinostat CO2 incubator for 3D cell culture |
Control unit | CelVivo | N/A | Tablet for ClinoStar settings |
Dulbecco's Modified Eagle's Medium (DMEM) | Corning | 17-205-CV | 1X solution with 4.5 g/L glucose and sodium pyruvate, without L-glutamine and phenol red |
Fetal bovine serum (FBS) | Corning | 35-010-CV | |
Formic acid | Thermo Scientific | 28905 | |
Fume hood | Mott | N/A | Model 7121000 |
Glass Pasteur pipette | Fisher Scientific | 13-678-8B | 9", cotton-plugged, borosilicate glass, non-sterile |
Glutagro supplement | Corning | 25-015-CI | 200 mM L-ananyl-L-glutamine |
Hank’s Balanced Salt Solution (HBSS) | Corning | 21-022-CV | 1X solution without calcium, magnesium, and phenol red |
HPLC grade acetonitrile | Fisher Scientific | A955-4 | |
HPLC grade water | Fisher Scientific | W6-1 | |
Hydrochloric acid (HCl) | Fisher Scientific | A481-212 | |
Ice | N/A | N/A | |
MEM non-essential amino acids | Corning | 25-025-CI | 100X solution |
Oasis HLB resin | Waters | 186007549 | Hydrophilic-Lipophilic-Balanced (HLB) Resin with 30µm particle size |
Orbitrap Fusion Lumos Tribrid mass spectrometer | Thermo Fisher Scientific | IQLAAEGAAPFADBMBHQ | High resolution mass spectrometer |
Oro-Flex I polypropylene filter plate | Orochem | OF1100 | 96-well polypropylene filter plate w/ 10 µM PE frit |
Penicillin-Streptomycin | Corning | 30-002-CI | 100X solution |
pH paper | Hydrion | Z111848 (Sigma-Aldrich) | 0-13 pH test paper |
Pipette gun | Eppendorf | Z666467 (Millipore Sigma) | |
Polymicro capillary | Molex | 50-110-7740 (Fisher Scientific) | Flexible fused silica capillary tubing with polymide coating, 75 µM ID x 363 µM OD |
Polystyrene 10 mL serological pipets, sterile | Fisher Scientific | 1367549 | |
Propionic anhydride | Sigma-Aldrich | 240311-50G | |
Refrigerated centrifuge | Thermo Scientific | 75-217-420 | |
Reprosil-Pur resin | MSWIL | R13.AQ.0003 | 120 Å pore size, C18-AQ phase, 3 µM bead size |
Rotator | Clay Adams | 25477 (American Laboratory Trading) | Nutator Mixer 1105 |
Sequencing grade modified trypsin | Promega | V5111 | |
Sodium butyrate | Thermo Scientific | A11079 | |
Sodium succinate dibasic | Sigma-Aldrich | 14160-100G | |
SpeedVac vacuum concentrator (1.5 mL microcentrifuge tubes) | Savant | 20249 (American Laboratory Trading) | |
SpeedVac vacuum concentrator (96-well) | Thermo Scientific | 15308325 | Savant SPD1010 |
Sterile hood | Thermo Scientific | 1375 | Class II, Type A2 |
Sulfuric acid (H2SO4) | Fisher Scientific | 02-004-375 | Baker Analyzed ACS reagent |
Tissue-culture treated 100 mm x 20 mm dish | Fisher Scientific | 08-772-23 | |
Trichloroacetic acid (TCA) | Thermo Scientific | AC421451000 | Resuspend 100% w/v in HPLC grade water |
Trifluoroacetic acid (TFA) | Fisher Scientific | PI28904 | Sequencing grade |
Vacuum manifold 96-well | Millipore | MAVM0960R | |
Vortex | Sigma-Aldrich | Z258415 | |
Water bath | Fisher Scientific | FSGPD10 | |
Wide bore pipet tips 1000 µL | Axygen | 14-222-703 (Fisher Scientific) | |
Wide bore pipet tips 200 µL | Axygen | 14-222-730 (Fisher Scientific) |