All animal experiments in this study were reviewed and approved by the ethics committee of the Second Xiangya Hospital of Central South University. See the Table of Materials for details regarding all the materials and equipment used in this protocol. The timelines for cell injection, imaging and euthansia are as follows: t0- induce infarction, t1 week- image and implant cells, t2 weeks- image and implant cells, t4 weeks- final imaging, euthanasia and tissue collection.
1. hiPSC culture, cardiomyocyte differentiation, and cell purification
- Mix DMEM/F12 and basement membrane matrix stock solution with ice at 4 °C in a ratio of 1.5:1, aliquot, and store the resulting mixture (matrix diluent) at -20 °C. Mix 25 mL of DMEM/F12 culture medium at 4 °C and 1 mL of matrix diluent thoroughly with ice, and spread 1 mL/well in a 6-well plate. Keep the plate upright for 1 h in an incubator at 37 °C, and aspirate the DMEM/F12 supernatant from the wells. Do not touch the bottom of the 6-well plate when performing the procedure.
- Remove the cryopreservation tube containing the hiPSCs from liquid nitrogen and quickly thaw them in a 37 °C water bath. Sterilize the external surface of the cryopreservation tube with 75% alcohol, wipe off the alcohol, and transfer the tube to a sterile ultra-clean table.
- Use a pipette to gently transfer the cryopreservation solution containing hiPSCs into a 15 mL centrifuge tube, add 5 mL of feeder-free ES medium, and centrifuge the suspension at 300 × g for 3 min at room temperature. Discard the supernatant and gently resuspend the cells in 6 mL of the feeder-free ES medium. Count the cells and adjust the cell concentration to 5 × 10⁵ cells/mL with the culture medium.
- Add ROCK inhibitor (Y27632) to the hiPSCs to a final concentration of 5 µM. Transfer the hiPSCs with Y27632 to the 6-well plate pretreated with basement membrane matrix, and gently swirl the 6-well plate, tracing the shape of the number "8" to evenly distribute the hiPSCs. Place the hiPSCs in a 37 °C, humid incubator with 5% CO2 in an upright position for 24 h. Replace the supernatant with the feeder-free ES medium without the Y27632.
- When hiPSCs reach 80% degree of confluence, aspirate the culture supernatant, wash the cells twice with phosphate-buffered saline (PBS), add insulin-free RPMI1640 + B27 containing 10 µM CHIR99021 (GSK3-β inhibitor), and place the hiPSCs in a humid CO2 incubator at 37 °C for 24 h.
- Replace half of the supernatant with RPMI1640 + B27 medium without insulin and incubate the cells for another 24 h.
- Completely replace the culture medium with RPMI1640 + B27 (without insulin). Place the plates in a humid incubator at 37 °C with 5% CO2 in an upright position for 24 h.
- Completely replace the culture medium after 3 days with insulin-free RPMI1640 + B27 + 5 µM IWR1 (Wnt signaling pathway inhibitor) and place the plates in a humid incubator at 37 °C with 5% CO2 for 48 h.
- Replace the culture medium after 5 days with RPMI1640 + B27 without insulin and continue to incubate for 48 h in a humid CO2 incubator at 37 °C.
- Replace the culture medium with the RPMI + B27 (including insulin) medium after 7 days and place the plates in a humidified CO2 incubator for 3 days at 37 °C. Replace the medium with the RPMI + B27 medium every 3 days. Look for the spontaneous beating of cells at 9-12 days of differentiation.
- After observing the pulsating cells, replace the RPMI + B27 medium with glucose-free RPMI 1640 medium containing lactic acid (1 mL of lactic acid added to 500 mL of glucose-free RPMI 1640 medium). Incubate the cells for 72 h in a humid incubator at 37 °C with 5% CO2.
- After 72 h, replace the supernatant with RPMI + B27 medium and incubate for 48 h in a humid incubator at 37 °C with 5% CO2.
- Aspirate the culture supernatant under negative pressure and wash the cells 3x with PBS to remove traces of the culture medium. Use the cell detachment enzyme mixture to dissociate the hiPSC-CMs into individual cells at 37 °C. Collect the obtained cells into a 15 mL centrifuge tube containing 3 mL of cardiomyocyte support solution, centrifuge at 300 × g for 2 min at room temperature, and discard the supernatant.
- Resuspend the cells with RPMI + B27 medium, seed them on basement membrane matrix-coated 6-well plates, and incubate them for 48 h in a humid incubator at 37 °C with 5% CO2.
- Replace the culture supernatant for purification with glucose-free RPMI 1640 medium containing lactic acid and incubate for 72 h in a humid incubator at 37 °C with 5% CO2.
- Replace the culture supernatant with RPMI + B27 medium and change the medium every 3 days.
- Continue the above process for 30 days, replacing the culture supernatant with glucose-free medium containing lactic acid for further purification. Incubate the cells for 3 days with this medium and replace the supernatant with RPMI + B27. Culture the cells continuously for 30 days until the hiPSC-CMs beat stably, and use these cells for intramyocardial injection in mice.
2. Preparation of hiPSC-CMs and the establishment of mouse acute myocardial infarction model
- Vacuum-aspirate the culture supernatant from hiPSC-CMs cultured for 60 days, wash the cells 3x with PBS, and dissociate the hiPSC-CMs into individual cells at 37 °C with the cell detachment enzyme mixture (~3-5 min). Collect the cells in a 15 mL centrifuge tube containing 5 mL of RPMI + B27 medium and mix well before counting the cells to calculate the total number of cells. Centrifuge the cell suspension at 300 × g for 2 min at room temperature. Discard the supernatant and add cardiomyocyte support medium to resuspend to a concentration of 0.6 × 10⁵ cells/µL.
- Keep the centrifuge tube containing the resuspended hiPSC-CMs ready at 37 °C for injection14,17,18,19,20.
- Place the mice in an anesthesia box connected with isoflurane to induce anesthetic inhalation followed by the use of vet ointment on the eyes to prevent dryness while under anesthesia.
NOTE: The isoflurane concentration was 5%. Pay attention to laboratory ventilation during the experiment. - Look for loss of reflexes in the feet and tail region after pinching when the mouse is laid flat on the operating table, indicating sufficient anesthesia. Administer buprenorphine (0.1 mg/kg) intraperitoneally.
- Smear the hair on the middle of the neck and the left chest of the mice with a depilatory cream, and wipe off the applied cream and hair with gauze after 5 min.
- Fix the limbs and the mouse tail with tape. Fix the mouse incisors with a 2-0 silk thread and tape. Sterilize the surgical area (median neck and left chest) with three alternating rounds of betadine followed by alcohol.
- Place a surgical drape around the sterilized surgical area. Then, make a median neck incision using fine anatomical scissors and fine dissecting forceps to expose the trachea fully. If necessary, cut off a few anterior cervical muscles for stabilization.
NOTE: The operators were blinded to the animal groups. - Insert a tracheal tube (20 G catheter puncture needle) through the mouth.
- Connect the tracheal tube to the ventilator and check for thoracic movement to ensure both lungs are well ventilated.
- Adjust the breathing parameters (breathing rate: 100-150 bpm, tidal volume 250-300 µL). After that, refix the left hind limb to the lower right side, loosen the tape around the left upper limb, and perform a thoracotomy at the left thorax's 3-4 intercostal space using fine dissecting scissors and forceps for maximal heart exposure.
- Using forceps, peel off the pericardium under a microscope to visualize the left anterior descending coronary artery (LAD) at the lower edge of the left atrial appendage.
- Use a 6-0 silk thread to ligate the proximal end of the LAD. After ensuring that the acute MI model is adequately established (when the distal LAD at the ligation site changes from red to white), close the chest layer by layer and suture the skin with 4-0 threaded intermittent stitches. Perform all the above-mentioned surgical procedures for MI induction for the sham group of animals except for ligation.
- Turn off the inhalation anesthesia, remove the cannula after the mouse resumes spontaneous breathing, and return it to its cage. Monitor the animal until it has regained sufficient consciousness to maintain sternal recumbency. Do not return it to the company of other animals until it has fully recovered. Administer intraperitoneal injections of buprenorphine (0.1 mg/kg x 3 days) and carprofen (5 mg/kg x 1 day) every 12 h postoperatively.
- Inject cyclosporin A (10 mg·kg-1·day-1) into the intraperitoneal cavity of mice 3 days before administering hiPSC-CMs to prevent the rejection of the transplanted cells. Inject cyclosporin A continuously for 1 month after transplantation.
3. hiPSC-CM injection under ultrasound guidance
- After setting up the MI model, assign the MI model mice (12-week-old C57BL/6 mice; 22g to 24g in weight, 50% male and 50% female) to single-dose (SD, n = 8 in this study) and multiple-dose (MD, n = 8 in this study) groups on the first post-MI day and place them in the first and second weeks following MI in an anesthesia box connected with 5% isoflurane for the induction of inhalation anesthesia followed by tracheal intubation.
- Smear the hair on the chest and upper abdomen of the mice with depilatory cream and wipe the cream off with gauze 5 min later. Monitor the heart rate of the mouse on the operation board and administer inhalation isoflurane until the heart rate is maintained at 400-500 bpm.
- Fix the mouse limbs and tail with tape on the detection console and set the platform temperature at 37 °C.
- Apply a special ultrasound jelly on the upper abdomen and use a smaller high-resolution veterinary ultrasound probe to obtain mouse liver images.
- Decrease the ventilator rate to 50 bpm. Use a 5 µL microsyringe to draw ~3 × 10⁵ cells (from step 2.1). Holding the syringe with a micromanipulator, insert a 3 mm needle at the left para-xiphoid process (Figure 1A). Follow the upper edge of the diaphragm under ultrasound guidance (Figure 1B), observe the respiratory rhythm and range (Figure 1C,D), and enter the pericardium at the end of the expiratory cycle avoiding damage to the liver and lung (Figure 1D).
- After the microinjector needle enters the pericardial cavity, adjust the breathing rate to the original parameter (150 bpm). Acquire the parasternal long-axis image of the mouse heart by M-mold echocardiography according to the manufacturer's instructions17 (Figure 1E). Under ultrasonic guidance, inject 3 × 10⁵ cells (Figure 1F) into three marginal areas (1 × 10⁵ cells per injected site) of the infarct site.
- Remove the special ultrasound probe and rinse off the jelly. Wean the mouse off the inhalation anesthesia, and return it to its cage following full consciousness.
- Repeat the above ultrasound-guided cell injection procedures 1 and 2 weeks after establishing MI for the MD group mice.
4. Evaluation of heart function, fluorescence labeling, transplanted cell count, myocardial infarcted area, and organ human mitochondria detection in mice 30 days after left anterior descending branch ligation
- Heart function assessment
- Place the mouse in an isoflurane-connected anesthesia box for induction-inhalation anesthesia followed by the use of vet ointment on the eyes to prevent dryness while under anesthesia. Remove the hair on the left chest of the mouse with depilatory cream. Lay the mouse on the operating panel to monitor the heart rate and adjust the isoflurane inhalation. Maintain the mouse heart rate at 400-500 bpm. The experimental endpoint is day 30 (after the MI induction).
- Fix the mouse limbs and tail with tape on the detection console and set the platform temperature at 37 °C.
- After applying a special ultrasound gel to the anterior heart area, use a (veterinary) high-resolution cardiac ultrasound probe to acquire parasternal long-axis and two-dimensional short-axis images under echocardiography of M-mold and B-mold according to the manufacturer's instructions17.
- After the ultrasonic detection is completed, rinse off the special ultrasonic gel, turn off the inhalation anesthesia, and return the mouse to its cage separately following full consciousness.
- Analyze the obtained data and calculate the left ventricular ejection fraction (EF) and fractional shortening (FS) using the analysis software. Ensure that the operator is blinded to the experimental groups17.
- Fluorescence labeling of sections
- Wash the isolated heart with PBS, immerse it in 4% paraformaldehyde at 4 °C for 12 h. Take the heart out and immerse it in 30% sucrose for 24 h to dehydrate.
- Embed the dehydrated heart with the optimal cutting temperature (OCT) compound on dry ice. Slice the heart from the bottom to the apex with a cryostat thickness of 10 µm and place the sections on slides and store the slides at -20 °C.
- Wash the slides with the heart tissue with PBS for 3 min.
- Permeabilize the tissue on slides with 0.5% Triton X-100 at room temperature for 8 min and wash them 3x with PBS for 5 min per wash.
- After covering the tissue with 10% donkey serum and 90% PBS (blocking solution), block the sections for 1 h at room temperature.
- After removing the blocking solution, incubate the sections with the primary antibody (diluted to 1:100 with the blocking solution) overnight at 4 °C. Wash them 3x with PBS for 5 min per wash.
- Incubate the tissue on slides with fluorophore-conjugated secondary antibody (diluted to 1:100 with the blocking solution) for 1 h at room temperature.
NOTE: Avoid exposing the tissues with the fluorophore-conjugated secondary antibody to light from this point onward. - Wash the slides 3x with PBS for 5 min per wash.
- Mount the slides using 4',6-diamidino-2-phenylindole (DAPI)-containing mounting medium and photograph under a fluorescence microscope17.
- Transplanted hiPSC-CMs count17
- Perform tissue immunofluorescence staining on frozen sections of the heart for pedestrian-specific troponin T (hcTnT), human nuclear antigen (HNA), and nonspecific Sarcomeric Alpha Actinin.
- After the whole heart was serially sectioned, take one section for every 50 sections for fluorescence labeling.
- Randomly capture five high-magnification images per slice. Count the grafted number of fields-of-view, calculate the average grafted cell numbers per unit area, and set them as A1/µm2. Calculate the total grafted area of the slice using ImageJ (https://imagej.nih.gov/ij/) and set it as B1μm2 so that the grafted number in this slice = A1 × B121,22.
- Calculate the total number of grafted cells per mouse heart using Eq (1) and the percent engraftment rate using Eq (2), given that one section was chosen from every 50 sections21,22.
- Total number of grafted cells per mouse heart = (A1 × B1 + A2 × B2 +…+ An × Bn) × 50 (1)
engraftment rate =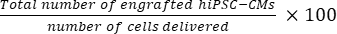 (2)
(2)
NOTE: The number of deliveries were 3 × 10⁵ for the SD group and 3 × 3 × 105 for the MD group.
- Assessing the myocardial infarcted area
- Cut a cross-sectional frozen section (short axis) of the isolated heart, from the apex to the base of the heart with a thickness of 10 µm.
- After the whole heart has been serially sectioned, take one section slide for every 30 sections and fix it in prewarmed Bouin solution at 58 °C. Stain the section with 0.04% Direct Red and 0.1% Fast Green collagen stains (diluted in PBS) according to the manufacturer's instructions17.
- Use software (e.g., ImageJ) to analyze the images after cross-sectional whole-body photography of the heart under a microscope using Eq (3):14,17
Infarct area % = × 100% (3)
- Detection of human mitochondrial DNA in various organs
- Anesthetize the mice with 5% isoflurane and sacrifice them by posterior cervical dislocation. Dissect the mice 4 weeks after cell transplantation. Harvest the organs (liver, lung, brain, kidney, spleen) and part of the myocardium (n = 3 in this section).
- Grind each organ tissue in liquid nitrogen and extract DNA from the tissue using the referenced kit (see the Table of Materials) according to the manufacturer's instructions.
- Follow the manufacturer's instructions to use the referenced kit and primers (see the Table of Materials) to detect human mitochondrial DNA in the above-mentioned tissues (from step 4.5.1).
Echocardiography for evaluation of the left ventricular function of the mice in each group revealed that the MI injuries were effectively reversed in the MD group (Figure 2A). Compared with the MI group, the SD group showed increased ejection fraction (EF) (from 30% to 35%; Figure 2B) and fraction shortening (FS) (from 18% to 22%; Figure 2C) after MI. However, it is even more crucial to note that multiple injections of the hiPSC-CMs in the MD group mice percutaneously increased EF (from 30% to 42%; Figure 2B) and FS (from 18% to 28%; Figure 2C) of the mouse heart after MI.
Fluorescence labeling of nonspecific α-actin (αSA), DAPI, human-specific troponin T (hcTnT), and human nuclear antigen (HNA) of tissue sections showed that the transplanted cell count in the MD group was significantly higher than that in the SD group (Figure 3A). Although the MD group only had two more injections than the SD group, the transplanted cell count in the MD group was ~10x that of the SD group (Figure 3B). In addition, the percentage of transplanted cardiomyocytes in the MD group was also significantly higher than that in the SD group (Figure 3C). This study also showed that the transplanted cells in the MD group were distributed in the infarct area and the marginal infarct area, while the transplanted cells in the SD group were only distributed in the infarct area (Figure 3A).
The MI area in the SD treatment group was smaller than that in the MI group and the MI area in the SD group was significantly smaller than that in the MD group (Figure 2E). In addition, the thickness of the left ventricular anterior wall of the MD group was 4x that of the myocardial MI group, while the thickness of the left ventricular anterior wall in the SD group was twice that of the MI group (Figure 2F). However, the collagen volume fraction in the MD group was 50% lower than that in the MI group, while the collagen volume fraction in the SD group was only 30% lower than that in the MI group (Figure 2G).
The total count of cells expressing IB4 (an endothelial cell marker) and SM22α (a smooth muscle cell marker) 28 days after MI increased significantly in the MD group (Figure 3D,E) compared to the SD or MI group. This study also assessed the degree of hypertrophy of cardiomyocytes in the marginal zone of each group. Wheat germ agglutinin (WGA) and Sarcomeric Alpha Actinin fluorescence staining showed that the minimum fiber diameter (MFD) in ligated mice in all the three groups was significantly higher than that of the sham-ligated mice. However, the MFD of the MD group was significantly smaller than that of the MI and SD groups (Figure 3F,G). This study further used TUNEL immunostaining (which can mark the nucleus of all apoptotic cells) to evaluate the apoptosis of cardiomyocytes. Compared with the SD group or the MI group, the prevalence of TUNEL-positive cardiomyocyte nuclei in the MD group was significantly reduced (Figure 3H,I). No human mitochondrial DNA was detected in any organ in the sham and MI groups (Figure 4A,B). The MD and SD groups only showed human mitochondrial DNA in the heart, and no human mitochondrial DNA was detected in any other organ (Figure 4C,D).
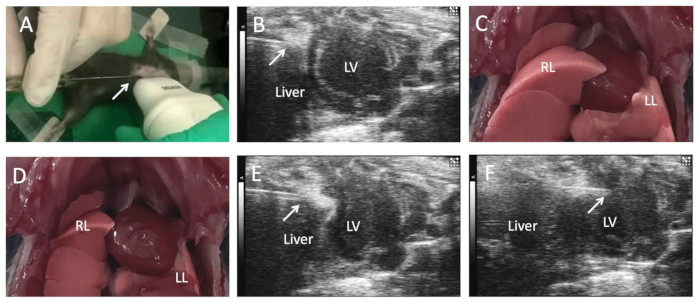
Figure 1: Ultrasound-guided intramyocardial cell injection in mice. After the mouse is anesthetized on an operating table, the limbs and tail are fixed with tape at a constant temperature of 37 °C, while the percutaneous intramyocardial injection is administered in the left ventricle, guided by echocardiography. The mice were anesthetized and maintained by inhalation of isoflurane (1.5%-2%). Remove the hair on the upper abdomen and chest of the mouse. Under transthoracic echocardiography guidance, insert the tip of the microsyringe below the xiphoid process (A) (arrow) and move it (arrow) along the upper edge of the diaphragm (B) to adjust the respiratory rate of the mouse. Press the needle tip against the pericardial wall (C) in the inspiratory phase. (D,E) The needle tip enters the pericardial cavity in the expiratory phase and finally penetrates the left ventricular anterior wall (F) to inject cells. This figure was modified from17. Abbreviations: LV = left ventricle; AO = ascending aorta; RL = right lung; LL = left lung. Please click here to view a larger version of this figure.
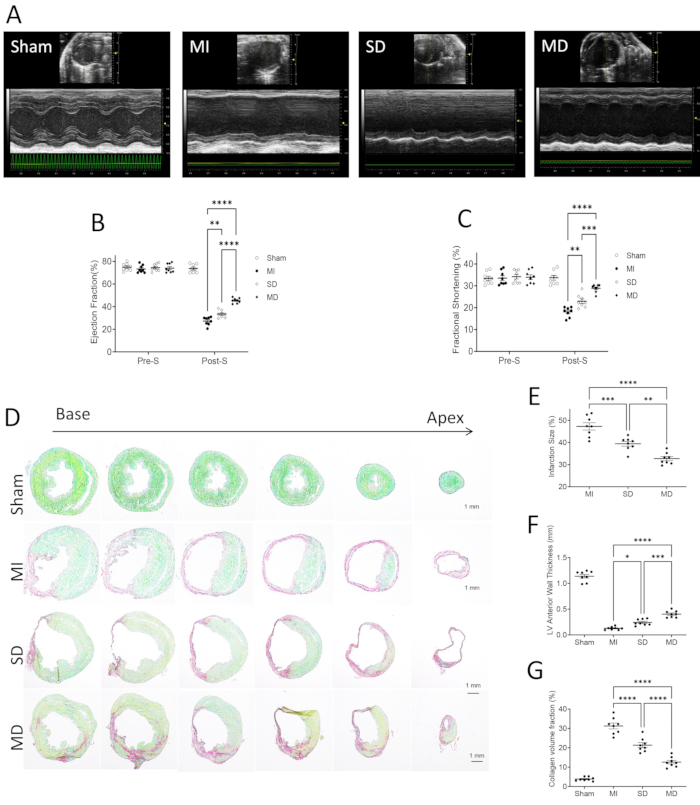
Figure 2: Evaluation of cardiac function in mice in each group. (A) Use high-resolution echocardiography to assess the left ventricular function before inducing myocardial infarction (pre-S) and 4 weeks after treatment (post-S). The ejection fraction (B) and fraction shortening (C) are expressed as absolute values. The data are expressed as mean ± SE, 8 per group. Assess infarct size, collagen volume, and left ventricular morphology. Through Sirius red/fast green staining (D), infarct size (E), left ventricular anterior wall thickness (F), and collagen volume fraction (G) were measured. The data show mean ± SE, 8 mice per group. Scale bar = 1 mm. One-way analysis of variance and Dunn's multiple comparison test. * * p < 0.01; * * * p < 0.001; * * * * p < 0.0001. This figure was modified from17. Abbreviations: pre-S = presurgery; post-S = post surgery; MI = myocardial infarction; SD = single dose; MD = multiple dose. Please click here to view a larger version of this figure.
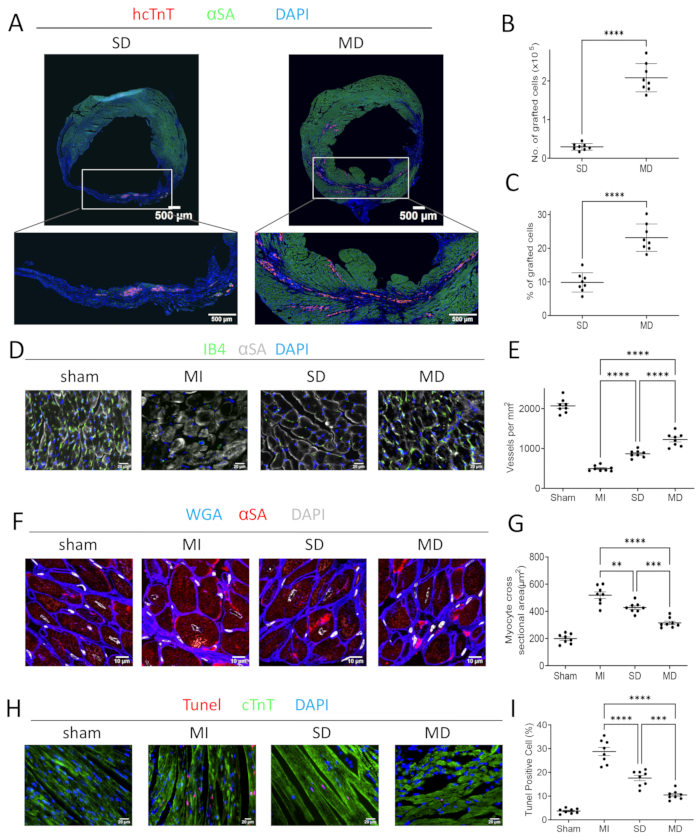
Figure 3: Histological evaluation of the hearts of mice in each group. (A) Serial sections of the injected heart mice with hiPSC-CM were stained for hcTnT, α-sarcomeric actin (αSA), and DAPI. The number (B) and percentage (C) of the transplanted cells were used for quantification. Serial sections from sham-operated, MI, SD, and MD-treated mouse hearts sacrificed 4 weeks after MI induction were histochemically stained for the presence of IB4. (D,E) Capillaries are quantified as the number of IB4-positive vascular structures in each high-power field area around the infarct. The cardiomyocytes were stained with WGA and αSA in the marginal zone of myocardial infarction, and the nuclei were labeled with DAPI. (F,G) The cross-sectional area of cardiomyocytes is measured and displayed as an absolute value. The marginal sections of myocardial infarction were stained with TUNEL to show apoptotic cardiomyocytes (red, TUNEL) and normal cardiomyocytes expressing cardiac troponin T (green, cTnT). (H,I) The ratio of TUNEL-positive cells to total cells was calculated. Scale bars = 500 µm (A), 20 µm (D,H), or 10 µm (F). One-way analysis of variance and Dunn's multiple comparison test. * p < 0.05; * * p < 0.01; * * * p < 0.001; * * * * p < 0.0001. This figure was modified from17. Abbreviations: hcTnT = human cardiac troponin T; αSA = α-sarcomeric actin; WGA = wheat germ agglutinin; DAPI = 4', 6-diamidino-2-phenylindole; TUNEL = terminal deoxynucleotidyl transferase dUTP nick end labeling; MI = myocardial infarction; SD = single dose; MD = multiple dose. Please click here to view a larger version of this figure.
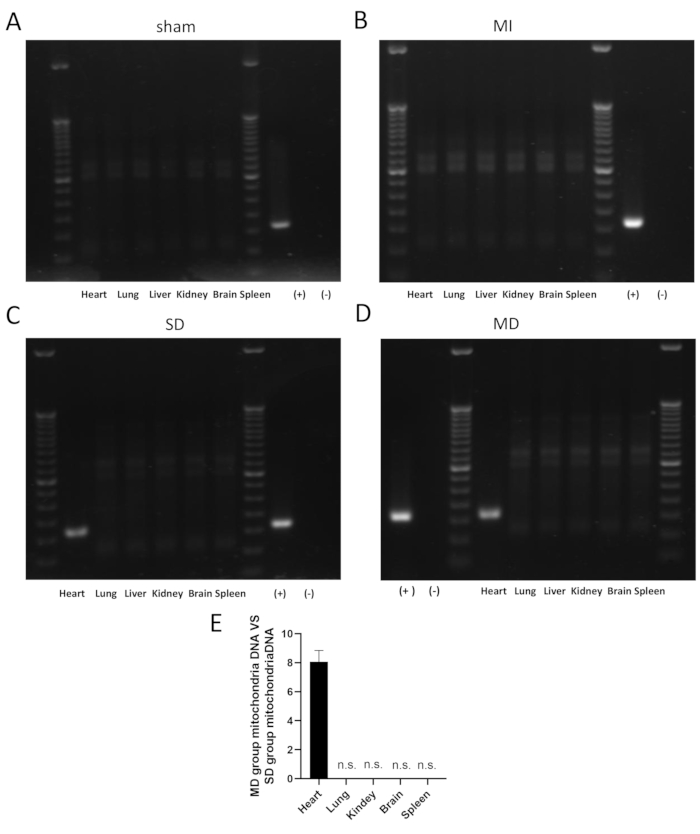
Figure 4: Detection of human mitochondrial DNA in mouse organs in each group. The figure shows the detection of human mitochondrial DNA in mouse hearts and other organ(s) in each group 1 month after cell transplantation PCR. PCR of human mitochondrial DNA did not find transplanted cells (A,B) in the hearts and other organs of mice in the sham (n = 3) and MI group (n = 3). PCR of human mitochondrial DNA found transplanted cells in the hearts of mice in the SD (n = 3) and MD group (n = 3) but not in other organs, including the lung, liver, kidney, brain, and spleen (C,D). The qPCR quantitative analysis of human mitochondrial DNA showed that the human mitochondrial DNA of the MD group was approximately eight times that of the SD group (E). (+) indicates iPSC-CMs positive control. (−) indicates DEPC water negative control. Abbreviations: n.s. = not significant; MI = myocardial infarction; SD = single dose; MD = multiple dose. Please click here to view a larger version of this figure.
