This protocol used a de-identified iPSC line, SkiPS 31.3 (originally reprogrammed using dermal fibroblasts from a healthy 45 year old male)47, and was, thus, exempt from specific Institutional Review Board approval, in concordance with the institution's human research ethics committee guidelines. Perform all the cell and hECT manipulation in aseptic conditions in a HEPA-filtered class II biological safety cabinet or laminar flow work bench. Sterilize all the non-sterile solutions by filtration through a 0.22 µm filter, and maintain all the cells and hECTs in an incubator at 37 °C, 95% relative humidity, and 5% CO2.
1. Bioreactor fabrication
- Bioreactor components and aluminum master cast fabrication
NOTE: Computer-aided design (CAD) files are provided in Supplementary File 1. The protocol may be paused anywhere between these steps. It is recommended to enlist a professional machinist to manufacture the master molds described in this section, as high tolerances (≤5 µm) and a smooth finish are required for accurate post geometry and for proper press-fitting of the polysulfone frames to the polytetrafluoroethylene (PTFE) baseplates (aiming for a snug friction fit, but not too tight).- Using a computer numerical control (CNC) mill, machine the baseplate out of PTFE according to the schematics in Figure 1A. The hECTs will be formed in the six evenly spaced wells (white arrows).
- Using a CNC mill, machine the polydimethylsiloxane (PDMS) rack negative master cast out of aluminum according to the schematics in Figure 1B, with three frame supports (green asterisks). Drill six evenly spaced holes (magenta arrowheads) of 0.5 mm in diameter for creating the PDMS posts.
- Using a CNC mill, machine the bioreactor frame out of polysulfone according to the schematics in Figure 1C. The frame supports (green asterisks) correspond to the frame supports seen in the rack cast (Figure 1B, green asterisks).
- Using a CNC mill, machine the aluminum cast holder out of aluminum according to the schematics in Figure 1D. Each slot contains a triangular shelf (orange triangle) that is 0.25 mm tall to provide a dead space for the PDMS to flow through the holes in the PDMS rack casts (Figure 1B, magenta arrowheads).
- Casting of the PDMS rack from the aluminum negative masters
- Using a thermoplastic fused deposition modeling 3D printer, print two PDMS rack casting apparatus brackets (Supplementary File 1). Use the following print settings: a layer height of 0.1 mm, a wall/bottom/top thickness of 1 mm, an infill density of 90% with triangles, a printing temperature of 230 °C, a build plate temperature of 70 °C, and a brim for adhesion.
- Place four aluminum negative master casts in the cast holder (Figure 2AI) such that the post holes align with the dead space opposite the triangle shelves (see Figure 1D). Wrap the apparatus in a rectangular piece of 0.5 mm thick silicone sheeting (Figure 2B, white arrows) as a gasket to prevent leakage of the liquid PDMS and clamp it between two parallel 3D printed brackets using a screw clamp.
- Add 0.5 mL of PDMS curing agent to 5 mL of PDMS elastomer base (1:10 ratio, as per the manufacturer's instructions) in a shallow container, and mix vigorously for 5 min. Degas the PDMS mixture in a vacuum chamber, and apply a strong vacuum (0.1-1 kPa) for 20-60 min at room temperature or until bubbles disappear.
- Pour the PDMS mixture onto the casting apparatus, overfilling to ensure the complete coverage of each slot (Figure 2AII). If desired, add small, colored glass beads to the body of the PDMS racks (Figure 2AII), opposite the side with the posts (Figure 2B), for the unique identification of each PDMS rack. Return the casting apparatus to the vacuum chamber (ensuring it is horizontally level), and apply a strong vacuum for at least 12 h. Allow the PDMS to cure at room temperature for about 48 h away from dust to enable the complete curing and maximum strength of the delicate posts. Avoid using an oven as this warps the 3D-printed components.
NOTE: The protocol can be paused here.
- PDMS rack removal from the aluminum negative master casts
- Remove the clamp, brackets, and silicone sheeting from the casting apparatus. Using a stainless-steel razor blade, trim away the PDMS film on top of the casting apparatus and frame supports, and gently use fingers to separate the PDMS racks from the sides of the cast holder. Insert a blunted stainless-steel razorblade into the dead space between the cast and the cast holder, and pry them apart (Figure 2CI, II), ensuring that the PDMS filling the dead space remains with the cast holder (as this is attached to the posts). Using a sharp stainless-steel blade, cut away the remaining PDMS films, and cut the dead-space PDMS from the tips of the posts (Figure 2C III-V).
- CRITICAL STEP: Free the PDMS rack from the cast (Figure 2D). Beginning with the side opposite the posts, use fingers to slowly separate the PDMS rack from the cast, working on alternate sides until the posts are free of the master casts.
- Repeat the previous step until all the PDMS racks and all the posts are freed. Use a sharp razor blade to trim away any remaining excess PDMS from the racks. The result is a PDMS rack (Figure 2E) with six intact posts (orange arrowheads) and colored beads (blue arrow) for identification.
NOTE: The protocol can be paused here.
- Stable post tracker (SPoT) fabrication
- Using a thermoplastic fused deposition modeling 3D printer, print the components of the SPoT casting apparatus (Supplementary File 2 and Figure 3AI, II). Use the following print settings: a layer height of 0.1 mm, a wall/bottom/top thickness of 1 mm, an infill density of 80% with triangles, a printing temperature of 230 °C, a build plate temperature of 70 °C, and a brim for adhesion.
- Ensure a secure press fit between the 3D-printed pieces, as well as between the PDMS racks and the three-pronged jig, and confirm that the PDMS racks fit snugly with the posts just reaching the bottoms of the wells without being bent. Trim/file the plastic if necessary.
- Add 0.5 mL of black PDMS part A to 0.5 mL of part B (1:1 ratio, as per the manufacturer's instructions) to a small weighing boat (or a similar small, shallow container), and mix thoroughly until uniform in color. Degas the mixed black PDMS in a vacuum chamber under a strong vacuum for 20 min. Pour the degassed black PDMS onto the 3D-printed base to fill the holes, and tap to ensure that no bubbles remain. Scrape away as much excess PDMS off the base as possible.
- Snap the three-pronged piece onto the base, and place the PDMS racks in the grooves on the three-pronged jig (Figure 3AII, turquoise rectangle), ensuring that the ends of the posts dip into the black PDMS in the circular wells (Figure 3B, C). Cure the black PDMS at room temperature and protected from dust for 48 h.
NOTE: The protocol can be paused here. - Slide out the three-pronged piece, minimizing tension on the posts. Use small forceps to scrape away the thin film of black PDMS that surrounds each SPoT; then, insert fine-tipped bent forceps into the SPoT well to free it from the 3D-printed base (Figure 3D).
- Inspect the SPoTs (Figure 3E), and trim away any remaining black PDMS film from the casting process not removed in step 1.4.5 using fine Vannas scissors. Ensure that the finished posts are of the correct length by fitting the PDMS racks onto the polysulfone frame and then sliding this onto the black baseplate (Figure 4A).
NOTE: The protocol can be paused here. - Pair the PDMS racks, and add them to the frame using the frame tabs (Figure 4A). Autoclave in a bag with a PTFE baseplate for at least a 30 min cycle (<122 °C to reduce warping).
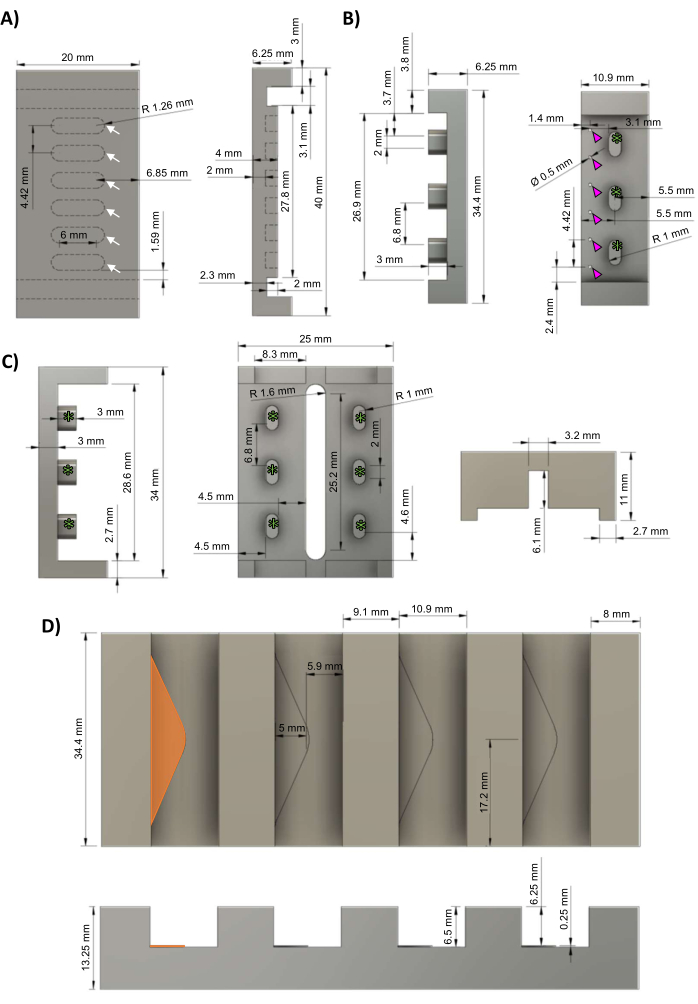
Figure 1: hECT bioreactor components. (A) Top view (left) and side view (right) of the PTFE baseplate with six evenly spaced wells for forming hECTs (white arrows). (B) Side view (left) and top view (right) of the aluminum negative master casts for the PDMS racks with six evenly spaced posts (magenta arrowheads) and three gaps for attaching to the bioreactor frame (green asterisks). (C) Side view (left) and bottom view (right) of the polysulfone frames for the PDMS racks with three evenly spaced frame supports (green asterisks) corresponding to the frame supports in the PDMS rack cast (panel B). (D) Top view (top) and side view (bottom) of the aluminum cast holder with four slots for the PDMS rack casts, each with a 0.25 mm high triangular shelf (left-most shelf highlighted in orange). This figure was modified from van Neste27. Abbreviations: hECT = human engineered cardiac tissue; Ø = diameter; PTFE = polytetrafluoroethylene; PDMS = polydimethylsiloxane; R = radius. Please click here to view a larger version of this figure.
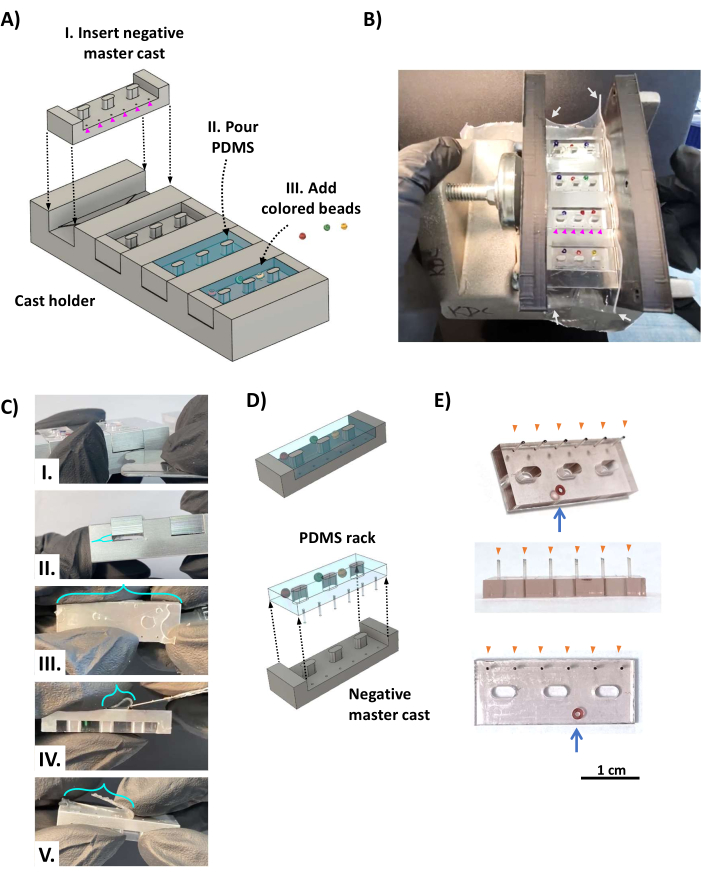
Figure 2: Fabrication of the PDMS racks. (A) CAD renderings show an oblique view of the casting apparatus. (I) A negative PDMS rack master cast is inserted into each of the four slots of the cast holder with the holes that form the PDMS posts (magenta arrowheads) placed over the dead space opposite the triangular shelf (Figure 1D, orange triangle). (II) PDMS is poured into each cavity of the negative master cast. (III) Colored beads are added to the uncured PDMS as a color-coded identification system. (B) Photo showing the assembled PDMS rack casting apparatus, which is clamped on either side with two 3D-printed brackets held in place by a screw clamp and wrapped with 0.5 mm thick silicone sheeting (white arrows) to seal the clamped sides. The colored beads are placed so that they do not cover the 0.5 mm diameter holes that form the posts (magenta arrowheads). (C) Once the PDMS is cured, the cast is removed from the cast holder. (I) A blunted stainless-steel razor blade or similar thin metal tool is inserted between the cast and the cast holder to pry the cast from the cast holder (II). (III) The film (turquoise brackets) formed by the PDMS flowing through the holes of the posts is attached to the tips of the posts and must be cut away using a sharp blade (IV,V). (D) The PDMS rack is separated from the cast. (E) Photos showing oblique (top), side (middle), and bottom (bottom) views of the PDMS rack with a glass bead embedded in the body for identification (blue arrow). The tips of the posts (orange arrowheads) have been marked with black ink. Scale bar = 1 cm. This figure was modified from van Neste27. Abbreviations: CAD = computer-aided design; PDMS = polydimethylsiloxane. Please click here to view a larger version of this figure.
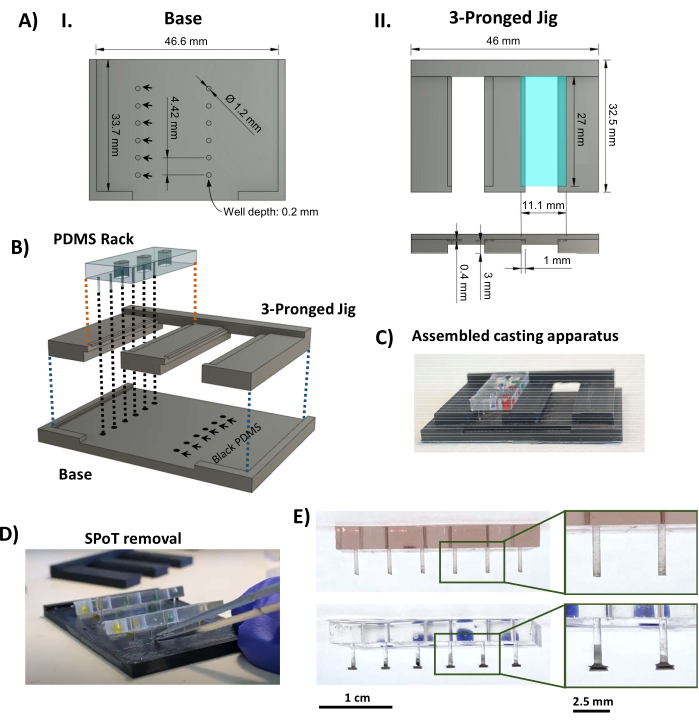
Figure 3: SPoT fabrication. (A) CAD renderings indicating key dimensions of the (I) base and (II) three-pronged piece of the SPoT casting jig. The dimensions of the circular SPoT forms (AI, black arrows) are set as 0.2 mm deep x 1.2 mm in diameter, and each holds the black PDMS for an individual SPoT. The 11.1 mm x 27 mm shelf seen in the top view (AII, top, turquoise rectangle) is depressed by 0.4 mm (as seen in the side view below) to hold the PDMS rack in place during curing. (B) CAD rendering showing the assembly of the SPoT casting apparatus. (C) A photo of the assembled SPoT casting apparatus. (D) After the PDMS has cured, the three-pronged jig is slid out from underneath the PDMS racks, and the SPoTs are freed from their wells using fine forceps. (E) Photos of the PDMS rack without (top) and with (bottom) SPoTs. Insets show magnified views of the posts. Scale bars = 1 cm (E), 2.5 cm (zoomed-in images in of E). This figure was modified from van Neste27. Abbreviations: CAD = computer-aided design; Ø = diameter; PDMS = polydimethylsiloxane; R = radius; SPoT = stable post tracker. Please click here to view a larger version of this figure.
2. Cell culture
- Culturing the iPSCs
NOTE: Different cell lines may require adjustments to the passage dilution and frequency and/or the titration of the medium additives.- Coat a cell-culture-treated 6-well plate with qualified basement membrane matrix (diluted in 1:1 Dulbecco's Modified Eagle Medium:Ham's F12 Nutrient Solution [DMEM/F12] according to the manufacturer's instructions), and incubate the plate at 37 °C for at least 30 min. Prepare 500 mL of iPSC culture medium according to the manufacturer's instructions, and add 5 mL of penicillin-streptomycin (10,000 IU/mL to 10,000 µg/mL) stock solution.
- To passage the iPSCs, aspirate the medium from the wells and wash each well once with 1 mL of phosphate-buffered saline (PBS). Add 1 mL of iPSC dissociation solution per well, and incubate in a laminar flow hood for 1 min.
- Aspirate the iPSC dissociation solution, and incubate the cells at 37 °C (without any medium) for 5 min. Add 1 mL of 2 µM thiazovivin in iPSC medium to neutralize the iPSC dissociation solution.
- Use a 2 mL serological pipette to dissociate the colonies into clumps of roughly 10 cells, and wash each well with an additional 1 mL of 2 µM thiazovivin in iPSC medium. Add 2 mL of cell suspension to each well of the plate newly coated with basement membrane matrix (step 2.1.1).
- After 24 h, remove the medium, and add fresh iPSC medium (without thiazovivin). Feed the iPSCs every 48 h with 2 mL of iPSC medium or every 72 h with 4 mL of medium. Replate the cells at a 1:6 dilution for passaging every 3 days or when they reach 80% confluence.
NOTE: Different cell lines may require adjustment of the dilution and passage frequency .
- Cardiomyocyte differentiation
- Begin the differentiation when the iPSC monolayers are 80%-90% confluent.
- Prepare the differentiation medium by adding 10 mL of B27 supplement without insulin and 5 mL of penicillin-streptomycin stock solution to 500 mL of Roswell Park Memorial Institute 1640 medium (RPMI). Prepare the cardiomyocyte maintenance medium by adding 10 mL of B27 supplement and 5 mL of penicillin-streptomycin stock solution to 500 mL of RPMI 1640.
NOTE: The differentiation medium and cardiomyocyte maintenance medium can be stored at 4 °C for up to 2 weeks. - Day 0: Wash the cells with 1 mL of DMEM/F12, and add 2 mL of 10 µM CHIR99021 and diluted basement membrane matrix in differentiation medium.
- Day 1: After 24 h, or when the cell confluence has reduced to below 70%, wash the cells with 1 mL of DMEM/F12, add 2 mL of differentiation medium, and incubate for 48 h.
- Days 3-4: Wash the cells with 1 mL of DMEM/F12, and add 2 mL of 5 µM IWR-1 in differentiation medium. Repeat on day 4.
- Days 5-6: Wash the cells with 1 mL of DMEM/F12, and add 2 mL of differentiation medium. Repeat on day 6.
- Days 7-10: Wash the cells with 1 mL of DMEM/F12, and add 2 mL of cardiomyocyte maintenance medium. Repeat every 24 h.
- Days 11+: Replace the medium with 4 mL of fresh cardiomyocyte maintenance medium every 48-72 h. Aspirate and pipette slowly to avoid damaging the vigorously beating monolayers.
3. hECT culture
- Harvesting the cardiomyocytes
- Harvest the cardiomyocyte monolayers for use in the hECT fabrication 8-60 days post-differentiation induction. Expect 2-5 million cells per well.
NOTE: If the cells have not begun beating by day 10, the differentiation is unlikely to be successful. Vigorously beating monolayers often detach after 11-15 days into the differentiation and compact into dense tissues. It is recommended to use or replate such cells at this time. - Rinse each well of cardiomyocytes 2x with 2 mL of PBS. Add 1 mL of room-temperature 0.25% trypsin-EDTA. Incubate at 37 °C for 5-10 min until the cells appear rounded and will detach with light tapping of the plate.
- Add 1 mL of 10% FBS in cardiomyocyte maintenance medium to each well to neutralize the dissociation. Gently pipette the monolayers using a 5 mL serological pipette tip, and transfer to a 50 mL conical tube to break up the pellet into clumps of 10-20 cells.
- Mix the cell suspension by inverting the conical tube before transferring 10 µL of cells to 10 µL of trypan blue. Count the cells using an automated cell counter or glass hemocytometer. Separate the cell suspension appropriately if not all the cells will be used or if some cells are set aside for flow cytometry.
NOTE: Supplemental cells (such as fibroblasts) may be added at this point. - Centrifuge the cells at 250 × g for 5 min. Immediately aspirate as much supernatant as possible without disturbing the cell pellet, and keep on ice. Work quickly to minimize the time that the cells spend in the pellet.
- Harvest the cardiomyocyte monolayers for use in the hECT fabrication 8-60 days post-differentiation induction. Expect 2-5 million cells per well.
- hECT fabrication
- Use the volumes in Table 2, and adjust according to the number of cells in the pellet so that each hECT contains 1 million cells. After each step, mix by pipetting slowly to avoid bubbles.
NOTE: Perform steps 3.2.2-3.2.3 shielded from direct light as some components are light-sensitive. - Prepare a 2.9 g/mL type-1 collagen solution in a 1.7 mL microtube by adding 13.442 µL of distilled water, 4.4 µL of 10x PBS, and 0.638 µL of 1M NaOH. Add 25.52 µL of 5 mg/mL collagen stock solution, and mix slowly.
- Prepare extracellular matrix mix (ECM mix from Table 2): Add 5.5 µL of 0.2 N pH 9 HEPES solution followed by 5.5 µL of 10x MEM. Mix thoroughly until a uniform light-yellow to light-pink color is observed. Transfer 35.2 µL of the ECM mix solution to the cell pellet, and add 4.4 µL of basement membrane matrix.
- Open the autoclaved bag of bioreactor parts (step 1.4.7, Figure 4A). While wearing gloves sterilized with 70% ethanol, remove the black baseplate from the autoclave bag, and place in a 60 mm dish with the wells facing up. Pipette 44 µL of the cell mixture into each well slowly to avoid introducing bubbles. If necessary, use the pipette to remove any bubbles that were introduced by pipetting or have formed due to the hydrophobicity of the PTFE. Restore the volume of the hECT such that the surface of the liquid is flush with the lip of the well (Figure 4BI).
- Don a fresh pair of sterilized gloves, and remove the polysulfone frame with PDMS racks from the autoclave bag. Lower the frame onto the baseplate such that the ends of the frame fit into the grooves at the ends of the baseplate (Figure 4BII, III). Inspect the bioreactor to ensure the posts are all straight and the frame is not tilted before placing into a 60 mm dish.
- Add 1 mL of 10% FBS in cardiomyocyte maintenance medium to the 60 mm dish (take care not to disturb the hECTs) to increase the humidity in the dish as the hECTs solidify. Place the 60 mm dish without a lid into a high profile (20 mm tall) 100 mm dish, cover with a 100 mm dish lid, and return the bioreactor to the 37 °C, 5% CO2 incubator to allow the collagen to form a gel with the cells in suspension.
- After 2 h, remove the dish from the incubator. Add 13 mL of 10% FBS in cardiomyocyte maintenance medium, tilting the dish to encourage the medium to flow between the PTFE baseplate and the PDMS racks.
- Inspect the bioreactor from the side to ensure no air bubbles are trapped between the hydrophobic surfaces of the PTFE baseplate and the PDMS racks, and return the dish to the incubator. If there is trapped air, tilt the bioreactor out of the medium to let the bubble break, and slowly lower it again, or use a micropipette with a gel loading tip to siphon out the air, taking care not to disturb the posts.
- Use the volumes in Table 2, and adjust according to the number of cells in the pellet so that each hECT contains 1 million cells. After each step, mix by pipetting slowly to avoid bubbles.
- Baseplate removal
- Inspect the hECT compaction through the gap in the frame. Over the course of 24-96 h, the hECTs compact and become more opaque (Figure 4CI-III). Once there is a visible gap between the hECTs and the wall of the baseplate (Figure 4CII), perform two half-volume medium changes to change the medium to cardiomyocyte maintenance medium without FBS. Remove the baseplate when the hECTs are compacted by at least 30% compared to the original diameter (Figure 4CIII). Fill the 60 mm dish containing the bioreactor with cardiomyocyte maintenance medium until the liquid is flush with the lip of the dish, and add 14 mL to a new 60 mm dish.
- CRITICAL STEP: While wearing sterile gloves, flip the bioreactor over in its dish so that the baseplate is on top (Figure 4BIV). Inspect for trapped air bubbles as in step 3.2.8. Slowly lift the baseplate, keeping it level (Figure 4BV).
- If an hECT falls off during baseplate removal but remains in the baseplate, use sterile curved fine forceps to transfer the hECT from the baseplate into the 60 mm dish. Use the forceps to guide the end of the hECT to its post. Use a second pair of forceps to hold the post steady, and thread it through the hole in the hECT. Repeat for the second post if necessary.
- With all the hECTs attached to the posts, transfer the frame with the hECTs to the new 60 mm dish, and place the frame with the posts pointing down (Figure 4BVI). Inspect the bioreactor to ensure the hECTs remain on their posts just proximal to the SPoTs.
- If an hECT has been pushed by surface tension to the base of its posts, stabilize the frame with a pair of sterile curved forceps. Insert the other pair of forceps through the slot in the frame, keeping it closed. Once the tip of the forceps has been lowered past the PDMS racks, twist it so that it reaches the post, and use the closed tips to gently push the hECT toward the end of the post until it rests on the SPoT (Figure 4BVI, inset).
- hECT maintenance
- Perform half-volume medium changes with cardiomyocyte maintenance medium every 24-48 h (after 2 weeks of culture, the frequency can be reduced to twice per week.)
- When the hECTs display clusters of spontaneous beating, typically by day 3, and coordinated beating with visible post deflection by day 5, begin the functional measurements, and repeat as often as desired.
NOTE: hECTs that have not started coordinated beating by day 7 are unlikely to do so at all.
| Component | Volume (μL) | |||||||
| distilled H2O | 13.442 | 2.9 mg/mL collagen solution | "ECM mix" | final hECT cell mixture | ||||
| NaOH 1N | 0.638 | |||||||
| PBS 10x | 4.4 | |||||||
| 5 mg/mL collagen stock | 25.52 | |||||||
| 0.2 N pH 9 HEPES | 5.5 | |||||||
| 10x MEM | 5.5 | |||||||
| Volume of ECM mix to transfer to cell pellet | 35.2 | |||||||
| Volume of Matrigel | 4.4 | |||||||
Table 2: hECT reagents. The components should be added in the order listed and kept on ice.
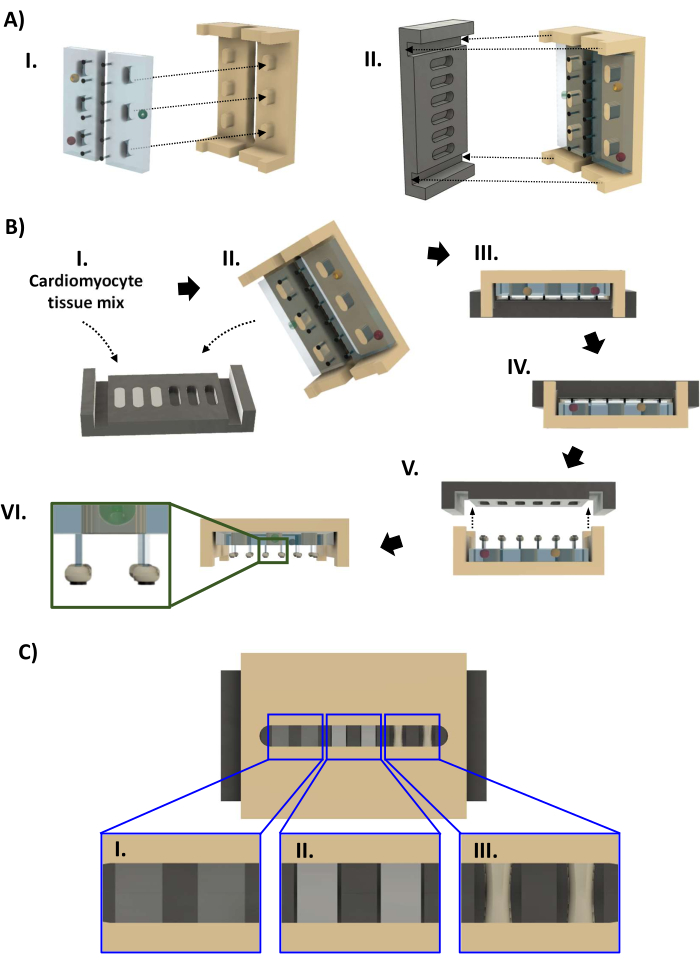
Figure 4: Bioreactor assembly and hECT fabrication. (A) (I) Two PDMS racks (left, light blue) fitted onto the polysulfone frame (right, tan). (II) The PTFE baseplate (black, left) then fits onto the frame (right) such that each pair of posts fits into a well of the baseplate. (B) (I) Forty four microliters of cardiomyocyte suspension in collagen-based extracellular matrix is added to each of the six baseplate wells. (II,III) The frame with PDMS racks is press-fit onto the baseplate. After 1-4 days, the hECTs can be removed from the baseplate. (IV) First, the bioreactor is inverted before (V) the baseplate is lifted off the frame. (VI) Side-view of the bioreactor with six hECTs. Inset: magnified view showing the hECT position on the posts relative to the SPoTs (inset). (C) CAD rendering showing three levels of hECT compaction ([I] low, [II] medium, and [III] high) as seen through the gap in the polysulfone frame. This figure was modified from van Neste27. Abbreviations: CAD = computer-aided design; PDMS = polydimethylsiloxane; PTFE = polytetrafluoroethylene; SPoT = stable post tracker; hECT = human engineered cardiac tissue. Please click here to view a larger version of this figure.
4. hECT pacing equipment
- Jacket for the heated stage
- Use a laser cutting machine to cut the components of the acrylic insulating jacket out of a 0.635 cm thick clear acrylic sheet (Supplementary File 3), one each of Figure 5A-D, and two each of Figure 5E, F.
- Assemble parts (B), (C), (D), and one of (E) from Figure 5, and bond together using acrylic glue as shown in Figure 5GI. Attach the top panel (Figure 5GII), allow several hours for the glue to set, and then slide the heated stage into the side of the jacket (Figure 5GIII).
- Once the jacket is in place, use tape to secure the inserts in between the legs of the heated stage, and add the front panel (Figure 5GIV) to finish the assembly (Figure 5GV).
- Graphite electrode fabrication
- Cut 6.25 mm thick, 25 mm wide graphite bars using a band saw into blocks 35 mm long; then, cut each block lengthwise in a curved line so that each electrode is 13-16 mm tall at one end and 8-10 mm tall at the other end. Drill two 0.7 mm diameter holes in the upper corner (Figure 6AI). Polish the pieces with paper towels, and sonicate in water for 20 min to remove graphite dust. Ensure that the electrodes wedge between the walls of the dish and the 25 mm wide bioreactor to ensure a consistent distance between the electrodes (Figure 6AII).
- Thread a 150 mm long x 0.25 mm diameter steel wire through the holes of the electrodes, and bend it to fit over the lip of the 60 mm dish and around the walls of the 100 mm dish so that the lid can be closed (Figure 6AII).
- Clean the electrodes by soaking in distilled water for 1-2 h after each use to remove any absorbed medium, allow to dry overnight, and then autoclave at 132 °C for 30 min. Before commencing the measurements, place one electrode on either side of the bioreactor (Figure 6AII). Position the wires so that the 100 mm dish lid can be closed, and return the bioreactor to the incubator to equilibrate.
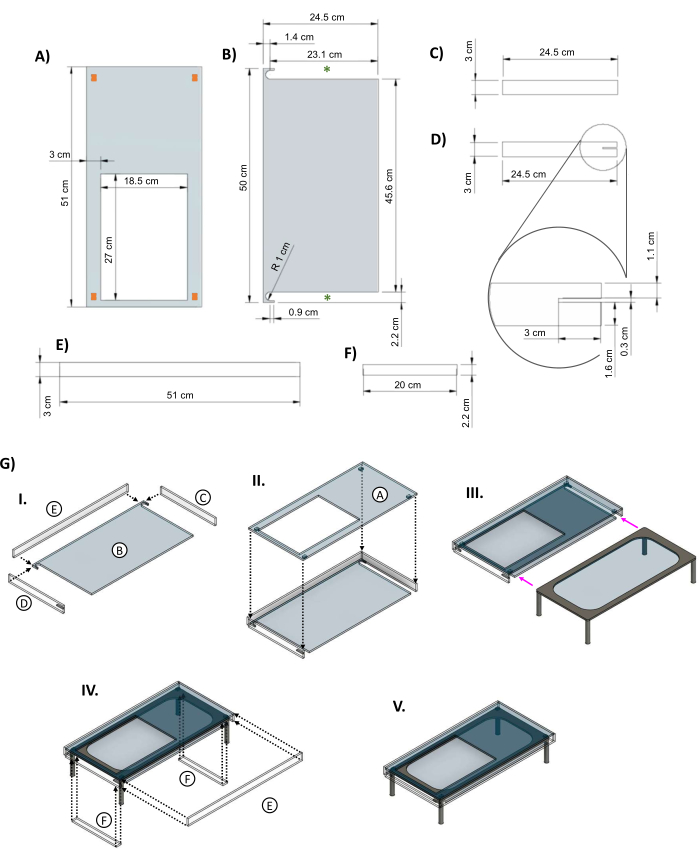
Figure 5: Acrylic jacket for insulating the heated glass stage. CAD images showing the key dimensions of the pieces of the acrylic jacket designed for the glass table. (A) The top panel has a 27 cm x 18.5 cm hole cut-out to allow for the bioreactor dish to sit on the heating element. The orange rectangles in the corners indicate the suggested placement of small spacer pieces to provide space between the top of the jacket and the heating element. (B) The bottom piece of the jacket has two cut-outs to allow the legs of the heated stage to slide in (green asterisks). (C&D) Two side panels fit under the top piece. (D) The left side panel includes a 3 cm x 0.3 cm cut-out (inset) for the stage power cord. (E) Long panels fit on the front and back. (F) Inserts are added to fill the gaps once the table is inside. (G) (I) The side and back panels are attached to the bottom piece, and then (II) the top panel is added. (III) The glass table is slid into the jacket (magenta arrows). (IV) The inserts are attached between the legs of the table, and the back fits onto the opening to close the box. (V) The completed jacket assembly. This figure was modified from van Neste27. Abbreviations: CAD = computer-aided design; R = radius; Ø = diameter. Please click here to view a larger version of this figure.
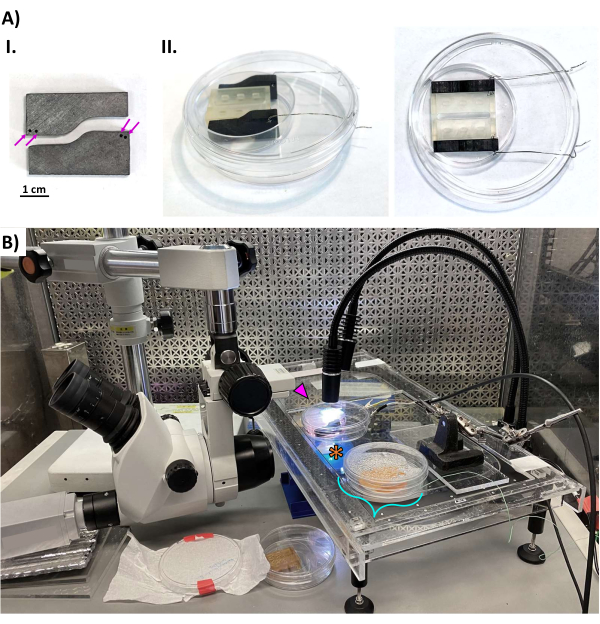
Figure 6: Data acquisition of hECT contraction. (A) (I) Photos of the electrodes cut from graphite bars. The magenta arrows indicate holes for attaching the stainless steel wires. Scale bar = 1 cm. (II) Oblique view (left) and top view (right) showing the placement of the graphite electrodes in the bioreactor. The electrodes take up the space between the 25 mm wide bioreactor and the wall of the dish to ensure a consistent distance between the electrodes. The wires are bent to allow the closure of the dish lid. (B) Photo of the hECT pacing setup inside the laminar flow clean bench-all equipment is placed on the vibration isolation table to reduce vibration noise from the clean bench. The bioreactor (magenta arrowhead) sits on the jacketed heated stage, illuminated by an LED light source from above. The dissecting microscope is pointed horizontally at a right-angled mirror (orange asterisk) to view the bioreactor from below and is fitted with a CCD camera (left). The turquoise bracket indicates a water bath for continuous temperature monitoring to provide feedback to the closed-loop heated stage controller. This figure was modified from van Neste27. Abbreviations: hECT = human engineered cardiac tissue; LED = light-emitting diode. Please click here to view a larger version of this figure.
5. hECT functional measurements
- Setting up the pacing workspace
- Turn on the heated stage to 39.5 °C, and set up the pacing equipment on a vibration isolation table inside a laminar flow clean bench according to Figure 6B. Mount the dissecting microscope on a boom stand, and point it at a right-angled mirror (Figure 6B, orange asterisk) located on a lab jack below the glass table to view the bioreactor from below. Affix a high-speed CCD camera to the microscope, and connect to the computer. Irradiate the setup with UV light for 15 min to sterilize the workspace.
- Place the bioreactor (Figure 6B, magenta arrowhead) on the jacketed heated stage, illuminated by a dual-head gooseneck LED light source from above (the necks of LED lamps can be more securely fastened to the main unit compared to the fiber-optic lamps). Minimize additional noise by ensuring the pacing equipment on the vibration table (and the table itself) is not touching any part of the laminar flow clean bench.
- Add a second 60 mm dish filled with prewarmed water inside of a 100 mm dish onto the heated table (Figure 6B, turquoise bracket), and outfit with a temperature probe for continuous temperature monitoring. Adjust the temperature setting of the heated stage as needed to maintain the temperature of the reference dish at 36-37 °C.
- Set the microscope magnification to 1.5x (or another desired magnification with which an hECT can be visualized in its entirety with adequate resolution).
- Adjusting the camera settings
- Open the camera software. Resize the video feed to crop the field of view as much as possible while still visualizing a whole hECT. This maximizes the camera speed.
- Set the capture rate a 90 frames per second. Adjust the exposure time and light source position to optimize the uniformity of the lighting conditions across the field of view and maximize the contrast of the SPoTs.
- Acquisition software setup
- Turn on the square pulse stimulator, and connect it to the computer. Adjust the settings to deliver biphasic pulses with an amplitude of 12 V and a duration of 5 ms.
- Open the data acquisition software, and then open the "AutomatedPostTracking3.vi" file (Supplementary File 4). Once it loads, click on the white arrow on the left side of the toolbar to initialize the program (Figure 7A).
- Calibrate the software using a glass hemocytometer on the heated stage. In the toolbar (Figure 7B), click the line tool to draw a line across 1 mm of the hemocytometer markings (not shown). In the Distance calibration (pixels/mm) box (Figure 7C), set the Reference length (mm) a 1, and then click on the Calculate button.
- Measure the hECT cross-sectional area by using the line tool to draw a line across the width of the tissue. Click on the 1 in the Cross-sectional area (mm^2) box (Figure 7D) to calculate the area (assuming a cylindrical geometry of the linear tissue strips, as established in the literature1,2,3,4,5,6,7,8,9,10,11,12,15,16,18,19,20,
21,22,23,24,25,26,37,38). Repeat along different parts of the hECT, and record the values under the other two buttons in the box. The output data table file reports the average of these three values to calculate the diameter of the tissue.
- hECT functional characterization
- Ensure the post tips are in focus. Turn on the thresholding switch (Figure 7E), and adjust the slider (Figure 7F) until the SPoTs (Figure 7G) are nicely demarcated and do not change shape as the hECT contracts.
- Use the rectangle tool to draw a rectangle around one of the SpoTs (Figure 7, green rectangle), and click on the Set 1 button inside the Post boundaries box (Figure 7H) to set the rectangle position around the SPoT, ensuring that the SPoT remains within the boundary of the rectangle at all times. Repeat for the other post, and record it under Set 2.
- Adjust the object size settings (Figure 7I) to prevent the program from tracking smaller objects. Ensure that the number of objects tracked in each rectangle remains constant. The interface (Figure 7J) shows the measured distance between the tracked objects in real time. Use this graph to monitor the noise.
- Select a directory to save the files (Figure 7K). Store data from different days in separate folders. Select the current Tissue number, and write any desired comments in the Comments box.
- Under the Pacing Frequency (Hz) header (Figure 7L), indicate the range of frequencies desired (Min and Max), and the desired Interval for stepping from Min to Max. If pacing the hECTs across their entire capturing range, test different pacing frequencies to find the lowest frequency at which a 1:1 stimulus:peak ratio is achieved, and continue to increase the frequency until that ratio is lost. Measure the spontaneous function by choosing an arbitrary frequency range (e.g., 0.01 Hz to 0.01 Hz) and keeping the square pulse stimulator output off.
- In the boxes to the right, choose the desired Setting time (s) (an interval of time after the frequency has been set but data are not recorded) to allow the hECT to adjust to the new pacing frequency. Specify the Recording time (s) and Pacing Voltage (V). Begin the program by clicking on the Start Program button (Figure 7M).
NOTE: The results are saved automatically in the selected directory. After each recording, observe that the script displays the Fourier transformation of the data (Figure 7N), where the peaks correspond to the detected beating frequency. - If desired, run the "Excitation Threshold Finding" program to find the minimum voltage required to stimulate the hECT in view (Figure 7O). If desired, calculate the maximum and minimum deflections of the posts (Figure 7P).
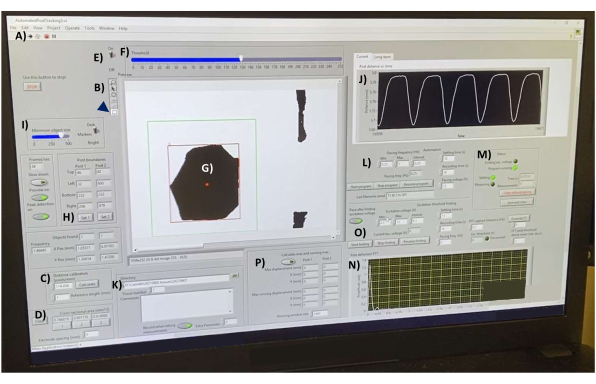
Figure 7: Post deflection data acquisition interface. (A) Button for running the software. (B) Toolbar containing the line and rectangle tools for the length measurements and object selection, respectively. (C) Distance calibration controls. (D) Tools for measuring the hECT cross-sectional area at three different points. (E) Thresholding switch and (F) slider for converting the video feed into high-contrast images in real time. (G) A SPoT visible in the preview window. (H) Tools for selecting the SPoTs. (I) Slider for filtering the objects by size. (J) Graph showing the measured distance between the tracked objects in real time. (K) Options for selecting the directory to save the output files. (L) Options for setting the frequency range, frequency interval, recording time, and setting time between recordings for the post tracking program (M). (N) Graph output of the Fourier transformation of the deflection curve of the last saved recording. (O) Program to find the minimum voltage required to stimulate the hECTs. (P) Program to calculate the maximum and minimum deflections of the posts. Abbreviations: hECT = human engineered cardiac tissue; SPoT = stable post tracker. Please click here to view a larger version of this figure.
6. PDMS rack measurements
- Unloaded distances
- Before hECT fabrication, mount the desired pair of PDMS racks onto a frame. Use the pacing setup and software described in step 5.1 for the functional measurements. Select the stationary SPoTs at the ends of the posts.
- Adjust the light source and/or thresholding if necessary to reduce the noise a <2 µm. Record the average live y-value indicated in the graph in a spreadsheet.
- Post heights and hECT heights
- From the pacing setup described in step 5.2, remove the angled mirror and heated stage. Place the bioreactor directly on the lab jack for a side view of the bioreactor.
- Open the camera software. Adjust the exposure time and light source position to optimize the uniformity of the lighting conditions across the field of view and maximize the visibility of the posts.
- Open the data acquisition software, and then open the "PostMeasurement_PB3.vi" file (Supplementary File 5). Once it loads, click on the white arrow on the left side of the toolbar to initialize the program.
- Calibrate the software using a glass hemocytometer. Click on the line tool in the vertical toolbar to the left of the viewing window, and draw a line across 1 mm of the hemocytometer markings. In the Distance calibration (pixels/mm) box in the lower left of the screen, set the Reference length (mm) a 1, and then click on the Calculate button.
- Below the calibration fields, set the desired tissue number (for identification) in the Tissue Number field. Focus the camera on the left post of the hECT, and select Left in the Post Side box.
- Use the line tool to draw a line from the base of the post (top) to the tip of the SPoTs (bottom), and record by clicking on Measure Post Ht.
- Draw a line from the base of the post to the far edge of the hECT, and record by clicking on Measure Tissue Top Ht. Draw a line from the base of the post to the near edge of the hECT, and record by clicking Measure Tissue Base Ht.
- At this point, turn the bioreactor around to measure the right post height. Select the right post option to record the same measurements. Click on the Add button to populate the spreadsheet with the measured values and automatically calculate the average height of the hECT, which will be used in step 7.
- Once finished recording the tissue heights, click on the Save button to save the values to a text file.
7. Functional data processing using custom analysis scripts
- In a spreadsheet editor, fill out the summary file using the template (Supplementary File 6). Use the post length and average tissue height values acquired in steps 6.2. Ensure that all the hECTs that have data in the folder are represented in the summary file. Name the file "summary #.csv", where # refers to the number of days into the experiment.
NOTE: The hECT functional data must be in separate folders according to the experiment day. - Ensure the folder containing the AnalyzeLogsGUI scripts (Supplementary File 7) and the folder with the hECT recordings are both added to the path.
- Open the data analysis software. To the left of the directory bar, click on the Browse for folder button to navigate to the parent folder that contains both the AnalyzeLogsGUI folder and the hECT functional data. In the Current Window sidebar, right-click on these folders to Add to Path | Add Selected Folders and Subfolders.
- Open the "AnalyzeLogsGui_SC.m" file. In the Editor tab, press the Run button, and wait for the graphical user interface (GUI) to appear in a new window.
- In the Log Selection box (Figure 8AI), click the Select Directory button, and navigate to the folder that includes the hECT functional data. Select the desired hECT to be processed from the Tissue dropdown menu.
- In the Data Inputs box (Figure 8AII), input the unloaded distance between the posts recorded from steps 6.1 in the Diastolic Distance field. Input 0.25 in the Post Radius (mm) field.
- In the Analysis Constraints box (Figure 8AIII), choose the frequencies to omit from the analysis, or select specific frequencies to include (separated by commas). The start time and end time are set to 0 and −1, respectively, by default to process the whole length of the recordings. Change these values to trim the recordings if necessary.
- Change the filter parameters (Figure 8AIV) of Polynomial Order and Frame Size to alter the level of smoothing during the filtering process and the Peak Detection Threshold slider to set the minimum peak size that will be recognized by the scripts.
NOTE: The script contains the Spike Removal option, which clips tall peaks caused by artifacts; however, this is not recommended as it changes the shape of the twitches. Remove artifacts through trimming the recording instead (Figure 8AIII). - Use additional options (Figure 8AV) for additional data analysis output: Post deflection analysis to run an additional peak detection algorithm, Autoscale y-axis on zoom plots to automatically adjust the axes on the twitch force curve (Figure 8B), Save force-trace curves to save each twitch force figure to a .fig file, and Save force-time data to save the x- and y-coordinates of the filtered data plotted in the twitch force curve figure.
- Click on Run Analysis to generate a .txt file that contains the attributes of the twitch force curve (Supplementary File 8) averaged across a whole recording.
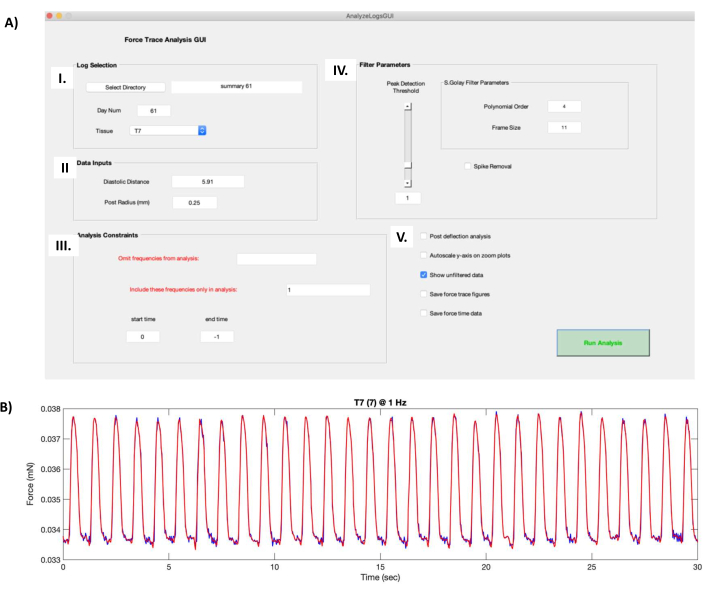
Figure 8: Twitch force curve calculations. (A) Running the "AnalyzeLogsGUI.m" file in the data processing software opens the GUI window. (I) The Log Selection box allows the user to select the directory for the folder containing the hECT functional data. The Day Num field is automatically populated from the title of the summary file created in protocol step 7.1. The hECT to be processed is selected using the Tissue dropdown menu. (II) The Data Inputs box contains information about the pair of PDMS posts that support the hECT, such as the unloaded distance (obtained in protocol step 6.1) and the post radius (0.25 mm). (III) The Analysis Constraints box allows the user to choose the frequencies to omit or to include and to trim the recordings. (IV) The filter parameters box contains the options to choose how the raw twitch force curve is filtered. Polynomial Order and Frame Size change the level of smoothing during the filtering process. The Peak Detection Threshold slider decides the minimum peak size that will be recognized by the scripts. The Spike Removal option clips tall peaks caused by artifacts. (V) Additional options include Post deflection analysis, which runs an additional peak detection algorithm, Autoscale y-axis on zoom plots, which acts on the twitch force curve, Save force-trace curves, which saves the twitch force figures, and Save force-time data, which saves the plotted twitch force data. (B) Example of the twitch force curve of a 30 s recording of an hECT paced at 1 Hz produced by the GUI screenshot from panel A. The red twitch force curve shows the filtered force produced by the parameters in AIV, superimposed onto the raw twitch force curve (dark blue curve, appears when the Show unfiltered data option in AV is selected). Abbreviations: hECT = human engineered cardiac tissue; GUI = graphical user interface; PDMS = polydimethylsiloxane. Please click here to view a larger version of this figure.
Following the above protocol, cardiomyocytes were generated from a healthy iPSC line used previously by our group9,15 and fabricated into hECTs after 8-61 days in culture. Figure 9A shows representative images of hECTs as viewed from the bottom, which were created without (top) and with (bottom) SPoTs. Functional measurements were taken at room temperature (23 °C) and at physiological temperature (36 °C) between 37 days and 52 days after hECT fabrication. In the fabrication of the PDMS racks, we have documented that an experienced user can expect to have an 80% yield in PDMS racks with all six posts intact and an overall 95% yield of at least five posts (based on three users in our laboratory), with <3% variability in post height.
The SPoTs provided a single defined shape to track during the data acquisition (Figure 9B and Supplementary Video S1) compared to the fragmented shapes of the marker ink, which does not bond well to the tips of the PDMS posts (Supplementary Video S2)27. In some extreme instances, the tracking object might even be obscured (Figure 9C, top row). These irregularities introduce a lot of noise that obscures the twitch force curve, thus preventing the accurate measurement of the developed forces under 10 µN. To correct for this and ensure consistent tracking of these shapes, many adjustments of the lighting angle and position are typically required to optimize the contrast and clarity. The darkness and regularity of the SPoT shapes streamline this process, thus reducing acquisition time by approximately 50% (from ~12-30 min to 5-10 min per hECT for a typical capture range of 1 Hz to 4 Hz). Additionally, in this work, the SPoTs provided a more reliable shape for optical tracking, and the reduction in noise enabled the measurement of weak tissues with a developed force as low as 1 µN, representing a post deflection of less than 5 µm (Figure 9D), as well as reducing the variability between the measurements of the same hECT27.
In our experience, sample loss in longitudinal experiments typically occurs due to the slipping of the hECTS off the ends of the inverted PDMS posts. This slipping off of the hECTs usually occurs upon removal of the hECTs from the baseplate (Figure 4BV, 1-4 days post hECT fabrication) or even later in the experiment (1-3 weeks post hECT fabrication) as the hECTs compact and mature. This maturation of the hECTs sometimes exerts enough passive and active tension on the flexible posts to make the hECTs pull themselves off the end of a post, resulting in a useless clump of tissue compacted around the opposite post (Figure 9E). The SPoTs provide a cap geometry that prevents hECT loss (Figure 9F), as quantified in Figure 9G. For the 103 bioreactors created over the course of 2 years (each with three to six hECTs at the start), the PDMS racks without SPoTs retained 95% of hECTs on average across 66 bioreactors. However, while most bioreactors had no tissue loss, some bioreactors lost 30%-100% of hECTs (often when a single bioreactor represents an entire experimental group), resulting in substantial inefficiency. In this work, the SPoTs effectively eliminated hECT loss, thus significantly improving the retention rate to 100% across 37 bioreactors (p = 0.038)27.
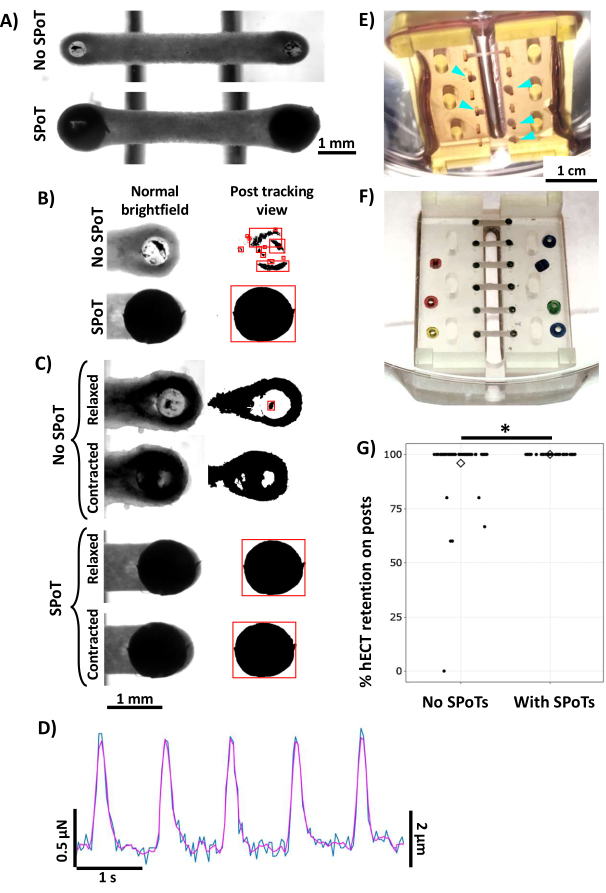
Figure 9: Improvement of post deflection data quality and increase in hECT retention with the addition of SPoTs to the PDMS posts. (A) Bottom view of hECTs without (top) or with (bottom) SPoTs. (B,C) Close-up images of one end of an hECT on a post viewed from below the bioreactor, with the right column threshold settings the same as during data acquisition. The red boxes indicate objects trackable by the post tracking software. (B) Comparison of the trackable fiducial markers on a post with marker ink versus SPoT. (C) Relaxed and contracted hECTs on posts with marker ink (top two rows) or with SPoTs (bottom two rows). (D) Example twitch force tracing of an hECT electrically paced at 1 Hz beating with a developed force of 1 µN, corresponding to a deflection of less than 5 µm (teal: unfiltered trace; magenta: filtered trace). (E) Oblique view of a bioreactor without SPoTs where hECTs slipped off one of their posts, resulting in a clump of tissue that formed around the opposite post (turquoise arrowheads). (F) Photo of a bioreactor with SPoTs showing 100% hECT retention. (G) Dot plot showing the tissue retention per bioreactor for PDMS racks (each with three to six hECTs) without SPoTs (n = 322 hECTs, 66 bioreactors) and PDMS racks with SPoTs (n = 134 hECTs, 37 bioreactors), including data from bioreactors with tissue failures during baseplate removal (days 1-4) and later in the culture process (days 4-15). *p = 0.038; diamond indicates the mean. Scale bars = 1 mm (A,C), 1 cm (E). This figure was modified from van Neste27. Abbreviations: hECT = human engineered cardiac tissue; SPoT = stable post tracker; GUI = graphical user interface; PDMS = polydimethylsiloxane. Please click here to view a larger version of this figure.
As an example application of the above methods, we also demonstrate the importance of measuring hECT function at physiological temperature (36 °C) rather than at room temperature (23 °C). hECT function was found to be stable over extended culture time in the current pacing setup with the heated stage (Figure 10A)27. Compared to measurements at physiological temperature, hECTs showed altered contraction dynamics at room temperature, with slower rates of contraction and relaxation (indicated by the slopes of the peaks in Figure 10B).
In this work, 1 hECT out of 10 demonstrated hypothermic inotropy (where the developed force was higher at 23 °C than at 36 °C), but only at low frequencies. When the hECT was paced at 1.5 Hz, it had a stronger developed force at 36 °C (no hypothermic inotropy) and complete relaxation between twitches (flat interpeak regions of the twitch force curve, right panel) but incomplete relaxation between contractions at 23 °C (increased passive force between peaks, left panel) (Figure 10BI). When the hECT was paced at 0.75 Hz, hypothermic inotropy was present (Figure 10BII), and the hECT was observed to fully relax between contractions, even at 23 °C (left panel). However, definitive frequency-matched comparisons of hECT function were challenging because the capture range of most hECTs showed minimal overlap across temperatures (Figure 10C). This was largely due to the low maximum capture frequency at 23 °C (mostly ≤1.5 Hz) and high minimum capture frequency of hECTs at 36 °C (mostly ≥ 1.5 Hz) (Figure 10D); these limitations are not seen in native myocardium (tested at 28 °C and 37 °C) as native ventricular myocardium does not beat spontaneously46. Only one of the hECTs having frequency overlap showed frequency-matched hypothermic inotropy (Figure 10D). As indicated by the twitch force curves in Figure 10B, hECTs paced at 36 °C showed higher magnitudes of +dF/dt and −dF/dt (Figure 10E, solid lines) than when paced at 23 °C (dashed lines). In the hECT that displayed hypothermic inotropy (red line), the contraction and relaxation were much faster at 36 °C despite the lower force. When paced at 36 °C, hECTs also had a higher spontaneous beat rate (Figure 10F) (n = 10, p = 0.000016 for a paired t-test) and a more expansive range of capturing frequencies (Figure 10G) (n = 9, p = 0.0000061 for a paired t-test), thus achieving 1:1 capture at supraphysiological frequencies48 of 4.5 Hz to 6.75 Hz (Figure 10C).
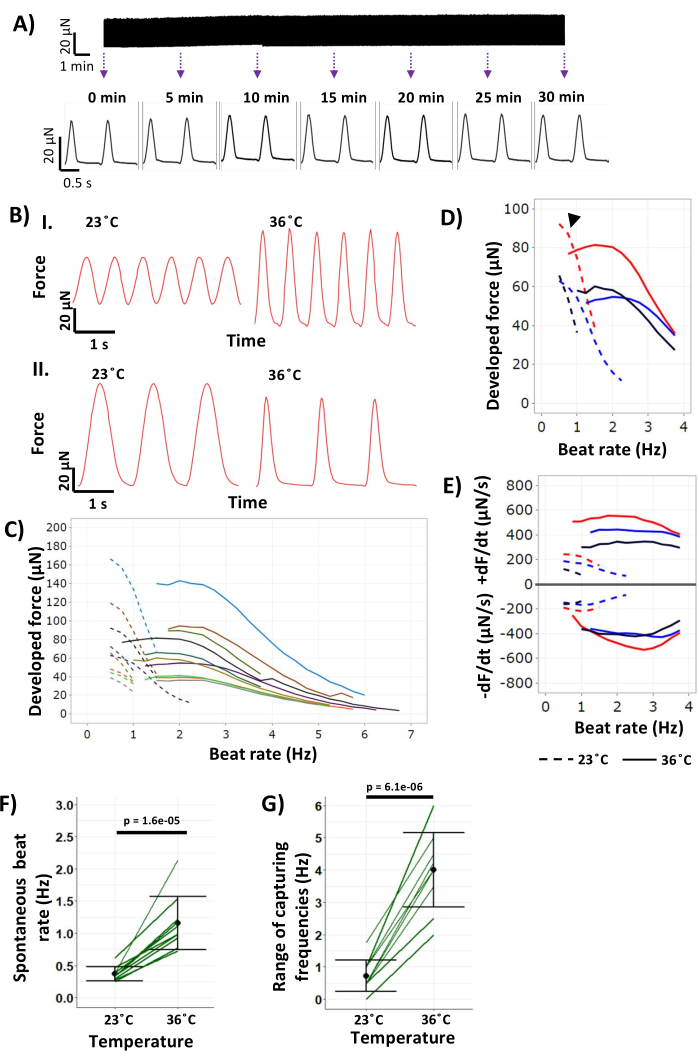
Figure 10: hECT contractile dynamics demonstrating temperature dependence. (A) Twitch force tracing of an hECT paced at 1 Hz for 30 min (top) to show stability in the function over time, with insets (bottom) showing a magnified view of the top at 5 min intervals. (B) Twitch force tracings of an hECT paced at (I) 1.5 Hz and (II) 0.75 Hz without and with hypothermic inotropy, respectively. The left panel tracings were obtained at 23 °C, and the right panel tracings were obtained at 36 °C. (C) Force-frequency relationship of hECTs (n = 6 hECTs at day 37 post fabrication across two bioreactors, n = 4 at day 52 post fabrication across two bioreactors) at 23 °C (dashed lines) and at 36 °C (solid lines). Each color represents one hECT.(D) Force-frequency relationships of three hECTs from panel C that demonstrate frequency overlap at both temperatures, one of which demonstrates frequency-matched hypothermic inotropy (black arrowhead). (E) +dF/dt and −dF/dt of the same hECTs in panel D plotted across frequencies at 23 °C (dashed lines) and 36 °C (solid lines). (F) Spontaneous beat rate of hECTs at the two temperature conditions (n = 10, p = 0.000016). (G) Range of frequencies with 1:1 stimulation:peak capture (range of frequencies in this graph defined as maximum capturing frequency – minimum capturing frequency) at each temperature (n = 9, p = 0.000006.1). p-values from paired Student's t-test. Error bars indicate the standard deviation. This figure was modified from van Neste27. Abbreviation: hECT = human engineered cardiac tissue. Please click here to view a larger version of this figure.
Supplementary File 1: CAD files for the machined bioreactor parts. This file was adapted from van Neste27. Please click here to download this File.
Supplementary File 2: CAD files for the 3D-printed SPoT casting apparatus. This file was adapted from van Neste27. Please click here to download this File.
Supplementary File 3: CAD files for the insulating acrylic jacket for the heated stage. This file was adapted from van Neste27. Please click here to download this File.
Supplementary File 4: AutomatedPostTracking3.vi file for tracking hECT deflections (protocol step 5.3). This file was adapted from van Neste27. Please click here to download this File.
Supplementary File 5: PostMeasurement_PB3.vi file for measuring post lengths and tissue heights (protocol step 6.2). This file was adapted from van Neste27. Please click here to download this File.
Supplementary File 6: Template for "summary #.csv" (protocol Step 7.1), which is used for processing the post deflection data. This file was adapted from van Neste27. Please click here to download this File.
Supplementary File 7: AnalyzeLogsGUI folder containing MatLab scripts for processing the post deflection data (protocol step 7). This file was adapted from van Neste27. Please click here to download this File.
Supplementary File 8: Descriptions of the variables in the MatLab script output "_datatable.txt" file. Lines 10-24 are parameterizations of the twitch force curve averaged across all the peaks over the duration of the recording (indicated in line 25). This file was adapted from van Neste27. Please click here to download this File.
Supplementary Video S1: Video of spontaneously beating hECTs on posts with SPoTs. This file was adapted from van Neste27. Please click here to download this File.
Supplementary Video S2: Video of spontaneously beating hECTs on posts without SPoTs. This file was adapted from van Neste27. Please click here to download this File.
