Summary

RGBradford:使用智能手机相机进行蛋白质定量

Published: September 08, 2023
doi:

Summary

本文提供了一种使用 Bradford 测定法和智能手机作为分析设备进行蛋白质定量的方案。样品中的蛋白质水平可以使用从智能手机拍摄的微孔板图片中提取的颜色数据进行量化。

Abstract

蛋白质定量是生命科学研究中必不可少的程序。在其他几种方法中,布拉德福德测定法是最常用的方法之一。由于其广泛应用,Bradford测定法的局限性和优点已被详尽报道,包括对原始方法的多次修改以提高其性能。原始方法的改变之一是使用智能手机相机作为分析仪器。利用Bradford测定条件下存在的三种形式的考马斯亮蓝染料,本文描述了如何使用从单张微孔板图片中提取的颜色数据准确定量样品中的蛋白质。在微孔板中进行测定后,使用智能手机相机拍摄照片,并使用免费的开源图像分析软件应用程序从图片中提取RGB颜色数据。然后,使用未知蛋白质浓度样品的蓝色与绿色强度之比(在RGB标度中)基于标准曲线计算蛋白质含量。使用RGB颜色数据计算的值与使用常规吸光度数据计算的值之间没有显著差异。

Introduction

无论下游用途如何(例如 ELISA、酶动力学、蛋白质印迹、蛋白质纯化和质谱),蛋白质定量对于生命科学实验室的准确分析都至关重要。除了用作辅助读数(即计算每质量蛋白质的分析物的相对水平)外,样品中的蛋白质水平本身也可以是所需的输出。例如,人们可能对食物资源1 或尿液2 中的蛋白质水平感兴趣。有许多方法可用于测量样品3中的蛋白质浓度,包括直接紫外吸光度读数4、蛋白质-铜螯合5,6、蛋白质-染料结合比色法7和蛋白质-染料结合荧光试验8。在引用次数最多的文献9,10的前三名中,有两篇描述蛋白质测量方法的论文5,7证明了蛋白质定量的相关性。尽管许多作者通过引用非主要参考文献或根本没有引用任何内容而忽略了他们的实际引用,但描述Lowry蛋白测定和Bradford蛋白测定的原始论文各有>200,000次引用10次。

Bradford 检测的受欢迎程度源于其经济性、简单性、速度和灵敏度。该测定基于蛋白质与染料考马斯亮蓝G在酸性条件下的相互作用。在测定条件下(即低pH值),染料以三种形式存在:红色阳离子形式,λmax为470nm;在650 nm处具有λmax的绿色中性形式;以及在590nm处λmax为11,12的蓝色阴离子形式(图1)。阳离子形式在没有蛋白质的情况下占主导地位。当蛋白质与染料相互作用时,它们会稳定蓝色阴离子形式,导致溶液颜色发生明显变化,从棕色变为蓝色。通常,通过分光光度法定量染料蓝色形式浓度的变化,其在590-595nm处的吸光度与测定中的蛋白质量成正比。

Figure 1
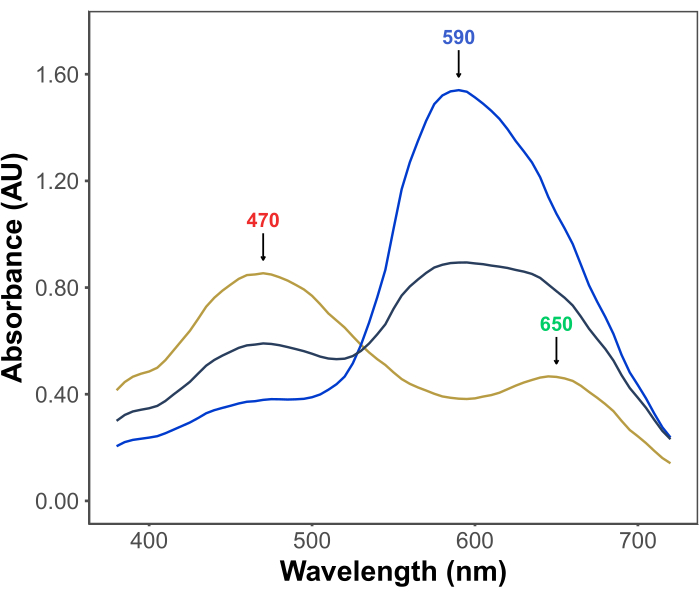
图 1:Bradford 测定条件下的考马斯亮蓝 G 吸收光谱。 三个主峰用箭头标记,表示染料的红色(470 nm)、绿色(650 nm)和蓝色(590 nm)形式的λmax。在没有蛋白质(黄线)和存在 3 μg(灰线)和 10 μg(蓝线)牛血清白蛋白的情况下记录光谱。 请点击这里查看此图的较大版本.

Bradford测定法的广泛使用导致了几个局限性的识别(例如,对不同蛋白质11的可变反应,以及脂质13和洗涤剂7的干扰)以及改进其性能的修饰(例如,添加洗涤剂14,15,碱化14,16和使用吸光度比率17).除了对测定本身的修改外,还描述了使用替代设备(例如智能手机或相机)来捕获分析信号18,19,20。事实上,利用智能手机作为便携式化学分析仪的方法的开发一直是一个活跃的研究领域。使用智能手机的动机源于这些设备的可负担性、便携性、易用性和广泛可用性。

本文提供了一种使用 RGBradford assay20 进行蛋白质定量的方案,该检测使用智能手机作为分析设备。与最初的 RGBradford 出版物20 相比,这里引入了简化颜色提取过程的程序。它涉及使用免费提供的软件应用程序从微孔板图片的每个孔中自动提取颜色信息,从而节省大量时间和精力。这是使用图形编辑器软件应用程序20从每个孔逐个手动获取颜色数据的先前方法的替代方法。最终,可以使用从智能手机拍摄的微孔板图片中提取的颜色数据来量化样品中的蛋白质水平。

Protocol

1. Bradford蛋白测定试剂的制备 将 100 mg 考马斯亮蓝 G 溶解在 50 mL 95% (w/v) 乙醇中。混合至考马斯亮蓝G完全溶解。注意:乙醇易燃,会引起眼睛刺激。避免火焰并使用护目镜。 在前面的溶液中,小心地加入 100 mL 85% (w/v) 磷酸。注意: 磷酸对金属有腐蚀性,会导致皮肤腐蚀、严重的眼睛损伤和急性口腔毒性。戴上手套和护目镜。 将含有考马斯亮蓝 G、乙…

Representative Results

图4是微孔板的图片,从中提取颜色数据,并记录了450nm和590nm处的吸光度。此处报告的代表性 RGB 颜色数据是自动获取的,如第 5 节所述。颜色数据的典型模式是蓝色值的增加和红色和绿色值的减少(图 5)。请注意,尽管所有孔中都有明显的反射,并且微孔板未完全对齐(图4),但从图片中提取的颜色数据准确地反映了吸光度读…

Discussion

本文描述了RGBradford,这是一种使用智能手机摄像头记录来自Bradford蛋白质测定的数据,提取颜色数据并准确定量生物样品中的蛋白质水平的方法,如最近最初描述的那样20。与原始RGBradford方法的一个区别是,这里使用了使用ImageJ插件22 自动获取颜色数据的过程。RGBradford方法的主要新颖之处在于使用RGB数据作为分析信号;因此,人们可以使用实验室中使用的任何?…

Divulgazioni

The authors have nothing to disclose.

Acknowledgements

这项工作由国家科学技术发展委员会(CNPq,巴西)[资助号428048/2018-8和402556/2022-4]和巴西利亚大学(巴西)资助。作者感谢 Duarte Nuno Carvalho 博士和 Evelyn Santos 博士(i3s,葡萄牙波尔图)提供对他们在本研究中使用的智能手机的访问。

Materials

96-well flat-bottom polystyrene microtiter plates  Jet Biofil, Guangzhou, China TCP011096 Any flat-bottom microplate compativle with optical reading will suffice. 
Bovine serum albumin Sigma-Aldrich, St. Louis, MO A2153
Coomassie Brilliant Blue G Sigma-Aldrich, St. Louis, MO B0770
Ethyl alcohol
iPhone 11 Apple MWM02BR/A Can be substituted with other smartphone equiped with a camera
iPhone 14 Pro Apple N/A
Phosphoric acid Sigma-Aldrich, St. Louis, MO 695017
Redmi Note 9 Pro XIAOMI  N/A
S22 Ultra Samsung  N/A
SpectraMax 384 Plus. Microplate reader. Molecular Devices, San Jose, CA PLUS 384 Any microplate reader capable of reading at 450 nm and 590 nm will work. This is optional. The method was actually created to dismiss the need of a microplate reader.

Riferimenti

  1. Zaguri, M., Kandel, S., Rinehart, S. A., Torsekar, V. R., Hawlena, D. Protein quantification in ecological studies: A literature review and empirical comparisons of standard methodologies. Methods in Ecology and Evolution. 12 (7), 1240-1251 (2021).
  2. Koga, T., et al. Mild electrical stimulation and heat shock ameliorates progressive proteinuria and renal inflammation in mouse model of Alport syndrome. PLoS One. 7 (8), e43852 (2012).
  3. Peterson, G. L. Determination of total protein. Methods in Enzymology. 91, 95-119 (1983).
  4. Goldfarb, A. R., Saidel, L. J., Mosovich, E. The ultraviolet absorption spectra of proteins. The Journal of Biological Chemistry. 193 (1), 397-404 (1951).
  5. Lowry, O. H., Rosebrough, N. J., Farr, A. L., Randall, R. J. Protein measurement with the Folin phenol reagent. The Journal of Biological Chemistry. 193 (1), 265-275 (1951).
  6. Smith, P. K., et al. Measurement of protein using bicinchoninic acid. Analytical Biochemistry. 150 (1), 76-85 (1985).
  7. Bradford, M. M. A rapid and sensitive method for the quantitation of microgram quantities of protein utilizing the principle of protein-dye binding. Analytical Biochemistry. 72 (1-2), 248-254 (1976).
  8. Datki, Z., et al. Application of BisANS fluorescent dye for developing a novel protein assay. PLoS One. 14 (4), e0215863 (2019).
  9. Van Noorden, R., Maher, B., Nuzzo, R. The top 100 papers. Nature. 514 (7524), 550-553 (2014).
  10. . Scopus Available from: https://www.scopus.com/ (2022)
  11. Compton, S. J., Jones, C. G. Mechanism of dye response and interference in the Bradford protein assay. Analytical Biochemistry. 151 (2), 369-374 (1985).
  12. Chial, H. J., Thompson, H. B., Splittgerber, A. G. A spectral study of the charge forms of Coomassie Blue G. Analytical Biochemistry. 209 (2), 258-266 (1993).
  13. Pande, S. V., Murthy, M. S. R. A modified micro-Bradford procedure for elimination of interference from sodium dodecyl sulfate, other detergents, and lipids. Analytical Biochemistry. 220 (2), 424-426 (1994).
  14. Gogstad, G. O., Krutnes, M. -. B. Measurement of protein in cell suspensions using the Commassie brilliant blue dye-binding assay. Analytical Biochemistry. 126 (2), 355-359 (1982).
  15. Friedenauer, S., Berlet, H. H. Sensitivity and variability of the Bradford protein assay in the presence of detergents. Analytical Biochemistry. 178 (2), 263-268 (1989).
  16. Stoscheck, C. M. Increased uniformity in the response of the Coomassie blue G protein assay to different proteins. Analytical Biochemistry. 184 (1), 111-116 (1990).
  17. Zor, T., Selinger, Z. Linearization of the Bradford protein assay increases its sensitivity: Theoretical and experimental studies. Analytical Biochemistry. 236 (2), 302-308 (1996).
  18. Gee, C. T., Kehoe, E., Pomerantz, W. C. K., Penn, R. L. Quantifying protein concentrations using smartphone colorimetry: A new method for an established test. Journal of Chemical Education. 94 (7), 941-945 (2017).
  19. de Camargo, C., Vicentini, M., Gobbi, A., Martinez, D., Lima, R. Smartphone for point-of-care quantification of protein by Bradford assay. Journal of the Brazilian Chemical Society. 28 (4), 689-693 (2016).
  20. Moreira, D. C. RGBradford: Accurate measurement of protein concentration using a smartphone camera and the blue to green intensity ratio. Analytical Biochemistry. 655, 114839 (2022).
  21. Ernst, O., Zor, T. Linearization of the Bradford Protein Assay. Journal of Visualized Experiments. (38), 1918 (2010).
  22. Angelani, C. R., et al. A metabolic control analysis approach to introduce the study of systems in biochemistry: the glycolytic pathway in the red blood cell: Metabolic control analysis and the glycolytic pathway. Biochemistry and Molecular Biology Education. 46 (5), 502-515 (2018).
check_url/it/65547?article_type=t

Play Video

Citazione di questo articolo
Moreira, D. C. RGBradford: Protein Quantitation with a Smartphone Camera. J. Vis. Exp. (199), e65547, doi:10.3791/65547 (2023).

View Video