Urban forests are valuable resources, and require care and management to ensure their health. The distribution of trees, their condition, and the scale and shape of urban forests can be mapped using GIS, or Geographical Information System, software.
Trees in urban areas may range from simple street trees to landscaped boulevards, greenways, public gardens, or those at industrial brownfield sites. Combined, these urban forests are essential components of city infrastructure. Urban forestry uses novel methods to address the needs and challenges unique to urban trees.
Urban forests fill valuable environmental niches, acting to clean air and water, control storm waters, prevent erosion, reduce noise, and conserve energy. Additionally, urban forests can provide important habitats for animals, provide shelter for nesting, or act as travel corridors for wildlife. Their value can also be social, connecting urban inhabitants to nature, enhancing architecture, and providing educational opportunities to learn about nature.
The structure, diversity, and resultant ecological value of urban forests can be quantified using GIS, or Geographical Information Systems, software. GIS allows for extensive data collection and management, which is an ideal framework for compiling urban forestry data. GIS allows users to combine geographical and tree-survey data to produce accurate maps of urban forests.
This video will illustrate the process of collecting tree survey data, incorporating this data into a GIS platform, and evaluating the environmental value of trees of interest.
Urban forest surveys may be conducted at a variety of locations. Commonly, parkway trees planted between sidewalks and curbs are recorded. Data is typically collected by city block, and records tree location, species, health, land use, and diameter at breast height, or DBH.
Tree condition is a visual assessment based on six categories. These are trunk condition, which takes into account factors including missing bark or decay; growth rate, examining twig elongation and length of current year’s growth; and structure, taking note of dead or broken limbs. Insects and disease are noted; crown development, which assesses trees for a balanced appearance of branches, leaves, and reproductive structures; and finally life expectancy, based on the life expectancy for the species, minus the damage present.
Each category carries a rating system, based on the amount of unhealthy tree features summed together, which combined give an overall condition score for a tree. This can be attributed to a categorical tree health measurement ranging from excellent down through very good, good, fair, poor, to very poor.
A GPS receiver, which uses satellite positioning transmitted to the handset allows the user to record geodesic coordinates of latitude and longitude. Location is also noted by postal address. Once collected, data can be entered into a GIS software program, which allows spatial and geospatial statistical analysis of trees and tree characteristics. There are several such programs available, including ArcGIS or Google Earth.
The National Tree Benefits Calculator is a free online software tool that is used to provide an economic estimation of the monetary benefits provided by urban and suburban trees. Here, users can select their survey region, and choose from a list of trees in that area. Inputting a few simple details including tree trunk diameter and land-use type, will give an estimation of the value of the tree in several key areas, including property value, air quality, and storm water control.
Now that we are familiar with the concept of urban forestry surveys and the principles behind them, let’s take a look at how these are carried out in the field.
To begin the survey, select a suitable outdoor location and turn on the GPS receiver. Wait for it to connect to satellites and detect the location. Proceed to the start of the survey area selected for data collection. Survey one city block segment at a time. At each tree encountered, record the species using this collection’s video on Tree Identification. Also record the longitude and latitude provided by the GPS receiver, and postal address.
Next, measure the diameter of each tree at 4.5 ft above the ground, which is taken as the diameter at breast height, or DBH. Assign each tree a number, resetting the numbering at the start of each block segment.
Observe the condition of each tree by visually estimating and scoring according to the criteria presented in the table shown. Sum the points to obtain an overall score for each tree, and assign each a corresponding health category.
Two programs that can be used to compile GIS data are Google Earth or ArcGIS. Using these programs, trees can be place-marked individually or their coordinates complied into a single file and uploaded.
To use the Google Earth GIS program, type in the tree coordinates and select new placemark, using the “Add Placemark” feature. Name each tree by species name, and once all tree data points are saved as placemarks, right click on the “My Places” label, select “Save As”, then save to any location.
To use the ArcGIS program, when importing data endure all column headings are free of spaces. Underscores can be used instead. If the coordinates are in latitude and longitude format, they should be converted to decimal degrees format before import into ArcGIS.
Save the data as a comma-delimited CSV file. Next, create a layer by adding the CSV file to ArcMap using the Add Data tool, either under File: Add Data, or by clicking the “Add Data” tool on the standard toolbar.
Right-click on the new layer and choose “Display XY Data”. Ensure that the X, or longitude, and Y, or latitude, fields were selected correctly by ArcMap.
Next, click “Edit”, then “Select” to highlight the coordinate system for the points, then “Add”, and “OK”. The correct coordinate system to use can be obtained from the GPS unit itself.
There should now be a point layer at the top of the Table of Contents with the same name as the CSV file, and the word “Events” at the end of the name. This is an “event theme”, and is a temporary layer. To make a permanent copy, right-click on the layer and choose “Data” then “Export Data”. Pick an output location and enter a file name. Change the name from the default “Export Output” to “Urban_Forestry_Survey” and click “OK”.
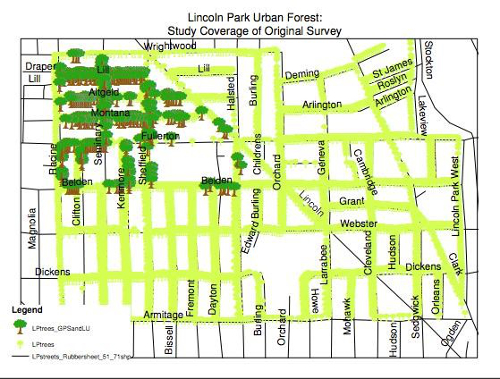
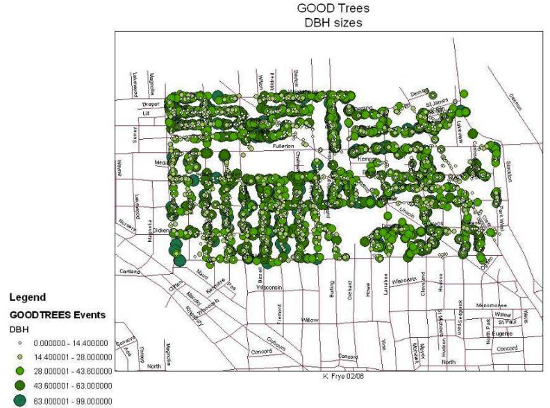
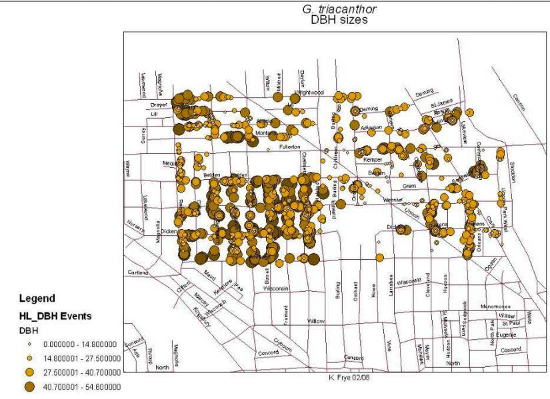
Data entered into the ArcGIS program will produce a map of urban forestry data. These maps can be used in a number of ways, including identifying patterns of DBH sizes, or determining if trees in a particular area are not reaching life expectancy.
Open up the iTree for Education software tool. For each tree, input the relevant data, and record the environmental benefits for each tree. Estimated benefits of urban trees can be calculated and assigned monetary values. This includes a tree’s annual benefits for storm water management, property value, energy efficiency, and carbon sequestration.
The results from analysis with the National Tree Benefit Calculator can give a summary of the economic and environmental value of the trees surveyed. This can allow urban planners to decide upon any tree removals, or supplementary plantings that may benefit the area surveyed.
Urban Forestry maps can be used in a variety of applications, and some of these are explored here.
In urban residential or suburban areas, urban forestry will often have different requirements from trees than those in commercial or retail areas. Trees may be protected or selected for planting based on similar ecological properties such as wind or noise barriers, or water management concerns. However, aesthetic value may play a greater part in residential forestry.
Geographical Information Systems can also be used to map many other phenomena, natural or manmade. GIS maps of natural measurements of lead levels in soil can also be compiled and used to determine contamination levels, or safe versus unsafe regions for planting of food crops.
You’ve just watched JoVE’s introduction to Urban Forestry using GIS. You should now understand the importance of urban forestry, how to use GIS to create maps for the study of urban trees, and how to use the National Tree Benefit Calculator to ascertain the value of surveyed trees. Thanks for watching!