- 00:00Panoramica
- 01:22Principles of HPLC
- 05:05Preparation of the Mobile Phase
- 06:08Preparation of Component and Standard Solutions
- 07:25HPLC Setup
- 09:25Diet Soda Samples
- 10:16Risultati
- 11:27Applications
- 12:44Summary
高速液体クロマトグラフィー (HPLC)
English
Condividere
Panoramica
ソース: 博士ポール亭 – パデュー大学
高速液体クロマトグラフィー (HPLC) は、液体試料のコンポーネントを定量化する一般的に使用される重要な分析法です。この手法でソリューション (最初の段階) 多孔質微粒子のパッキングには表面にバインドされている 2 番目のフェーズが含まれている列をポンプでくまれます。2 つのフェーズにおける試料成分の異なる溶解性により、従ってこれらのコンポーネントの分離を作成する別の平均速度で列を移動するコンポーネントです。一方の列の段階は固定相と呼ばれる移動相ポンプのソリューションと呼びます。
静止したおよび/またはモバイル相採用の種類に応じて、液体クロマトグラフィーのいくつかのモードがあります。この実験は、逆相クロマトグラフィー固定相は非極性、移動相は極性を使用しています。採用する固定相は、3 μ m のシリカ粒子に結合して移動相はその溶出強度を変化させる追加極性有機修飾子 (アセトニ トリル) で緩衝水溶液 C18 炭化水素グループです。このフォームのシリカは、水溶性、アプリケーションの広い範囲を提供するサンプルに使えます。この実験ではダイエット飲料 (すなわちカフェイン、安息香酸、アスパルテーム) で頻繁に見られる 3 つの要素の混合物が分かれています。3 種の知られていた量を含む 7 つの準備ができてソリューションを使用し、彼らのクロマト グラムに記録されます。
Principi
高速液体クロマトグラフィーの実験では、高圧ポンプはインジェクターを介してリザーバから移動相を取る。それは成分の分離用逆相 C18 充填カラムを通過します。最後に、移動相は、220 nm で廃液ボトル終了吸光度が測定される検出器セルに移動します。インジェクターのポートから検出器まで移動するコンポーネントにかかる時間の量は、保存期間と呼ばれます。
液体クロマト グラフは、逆相カラムで分離を実行する、この実験で使用されます。柱寸法が 3 mm (内径) × 100 ミリメートルとシリカ C18 オクタデシルシラン (ODS) 修飾とはパッキング (3 μ m 粒子サイズ)。Rheodyne 6 ポート ロータリー射出バルブ最初の小さなループのサンプルを格納するため、バルブの回転によって移動相にサンプルを紹介します。
220 の波長吸収分光法による検出は nm。254 でこの実験を実行できる nm、検出器が変数でない場合。検出器からのデータは計測したデジタルマルチメータ (DMM) を使用して、アナログ電圧出力を持って、データ集録プログラム搭載コンピューターで読み取る。結果として得られるクロマト グラムは、サンプルのすべてのコンポーネントのピークを持っています。この実験では、すべての 3 つのコンポーネントは、5 分以内溶出します。
この実験は、単一移動相とのイソクラティック移動相と呼ばれるポンプを使用します。分離しにくいサンプルの場合は、グラデーションの移動相が使用できます。これは、初期の移動相は主に水性のものと、時間をかけて第二有機溶媒を徐々 に追加して全体的な移動相に。このメソッドは、コンポーネントの保持時間を削減し、ガスのクロマト グラフの温度勾配と同様に動作時間をかけてこの相の極性を発生させます。周囲温度の変動に伴う時エラー離れて任意の保持かかるどこ列は (通常は 40 ° C に加熱すると、いくつかのインスタンスがあります。
逆相 HPLC の充填カラム固定相は通常 C4、C8、または C18 パッキングします。C4 列は、C18 カラムは、ペプチドや低分子量の基本的なサンプルに対し大きな分子量の蛋白質のために主にです。
吸収分光法による検出は、成分の吸収スペクトルはすべて容易に利用できる、任意の検出方法では圧倒的に。いくつかのシステムの検出方法として電気化学的測定、電気伝導度や電流などを使用します。
この実験では、移動相は主に 20% アセトニ トリルと 80% (DI) 純水を精製しました。少量の酢酸は、微量の状態で静止した梱包段階で、シラノールを保つ移動相の pH を下げるに追加されます。これはテーリング、狭いピークを与えることから吸着ピークを低減します。その後、pH を上げるし、部品の保持時間を減らすを助けるのために 40% 水酸化ナトリウムで pH を調整します。
各グループは、濃度の異なる標準液 (表 1) を含む 7 バイアルのセットを使用します。各ピークを識別する最初の 3 の使用し、最後の 4 はコンポーネントごとに校正グラフを作成します。基準 1-3 は、校正チャートにも使用されます。
| 番号 | カフェイン (mL) | 安息香酸 (mL) | アスパルテーム (mL) |
| 1 | 4 | 0 | 0 |
| 2 | 0 | 4 | 0 |
| 3 | 0 | 0 | 4 |
| 4 | 1 | 1 | 1 |
| 5 | 2 | 2 | 2 |
| 6 | 3 | 3 | 3 |
| 7 | 5 | 5 | 5 |
表 1。在庫基準 (各標準の容量は 50 mL) 7、作業基準を準備するために使用のボリューム。
Procedura
Risultati
The HPLC chromatograms are able to quantify each of the 3 components for all the samples based upon the calibration curves of the standards (Figure 3).
From this set of experiments, it was determined that a 12-oz can of these diet sodas contained the following amounts of each component:
Diet Coke: 50.5 mg caffeine; 217.6 mg aspartame; 83.6 mg benzoate.
Coke Zero: 43.1 mg caffeine; 124.9 mg aspartame; 85.3 mg benzoate.
Diet Pepsi: 34.1 mg caffeine; 184.7 mg aspartame; 79.5 mg benzoate.
Not surprisingly, all 3 had roughly the same amount of benzoate, as it is just a preservative. The Coke products had a bit more caffeine, and the Coke Zero had much less aspartame than the other two sodas, as it also includes citric acid for some flavoring.
The following numbers are the actual amounts of caffeine and aspartame in a 12-oz can of the 3 diet sodas (The caffeine content was obtained from the Coca-Cola and Pepsi websites. The aspartame content was obtained from both LiveStrong.com and DiabetesSelfManagement.com.):
Diet Coke: 46 mg caffeine; 187.5 mg aspartame
Coke Zero: 34 mg caffeine; 87.0 mg aspartame
Diet Pepsi: 35 mg caffeine; 177.0 mg aspartame
Sample Calculations (Table 2):
Concentration of caffeine in STD#1: The component solution for caffeine had 0.400 g of caffeine diluted to 500 mL = 0.500 L → 0.800 g/L = 0.800 mg/mL.
STD#1 had 1 mL of this solution diluted to 50.0 mL
0.800 mg/mL * (1.0 mL / 50.0 mL) = 0.016 mg/mL = 16.0 mg/L.
STD#2 had 2 mL of this solution diluted to 50.0 mL
0.800 mg/mL * (2.0 mL / 50.0 mL) = 0.032 mg/mL = 32.0 mg/L.
The results from the three calibration graphs (Figure 4) yielded the following equations:
Caffeine Peak Area = 0.1583*[Caffeine mg/L] – 0.574
Aspartame Peak Area = 0.02696*[Aspartame mg/L] – 0.405
Benzoate Peak Area = 0.1363*[Benzoate mg/L] – 1.192
Diet Coke: Caffeine Peak Area = 10.68 = 0.1583*[Caffeine mg/L] – 0.574
[Caffeine mg/L] = (10.68 + 0.574)/ (0.1583) = 71.1 mg/L in the injected sample.
Since the sample was diluted by a factor of 2, the Diet Coke had 141.2 mg/L caffeine.
The amount per 12-oz can = (141.2 mg/L)(0.3549 mL/12-oz can) = 50.5 mg caffeine/can.
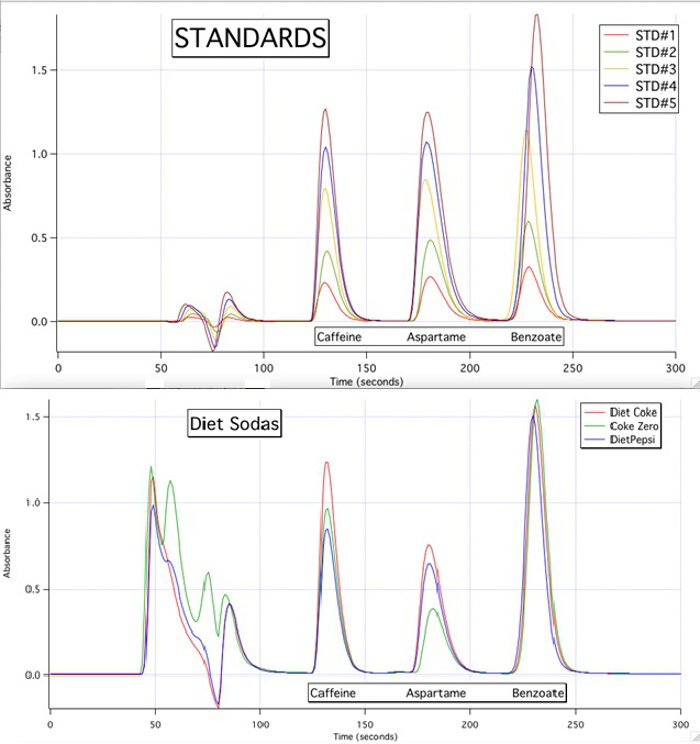
Figure 3. The HPLC chromatograms of the 5 standards and the 3 samples.
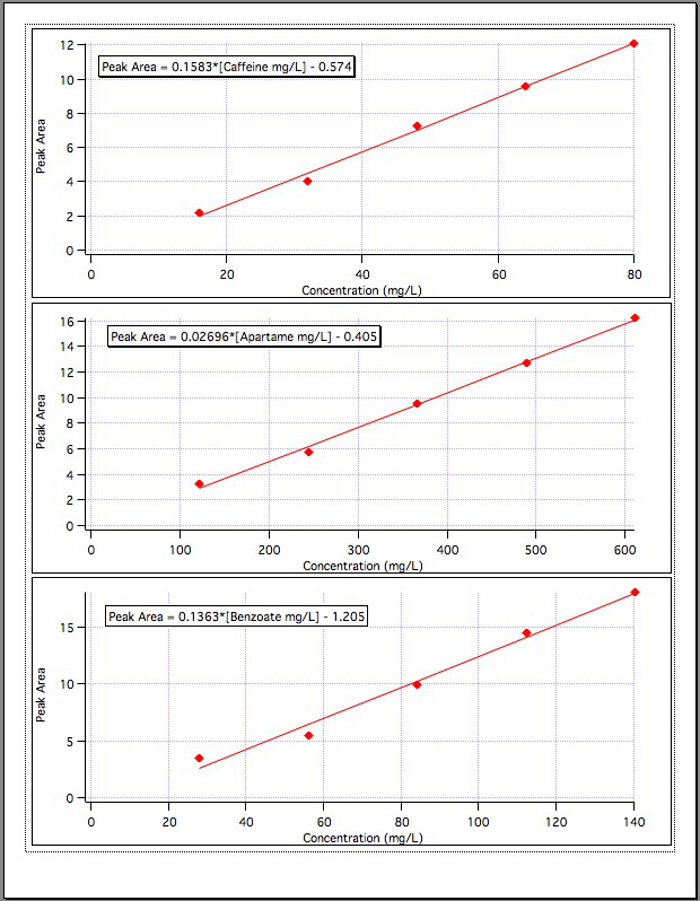
Figure 4. The calibration curves for each of the 3 components.
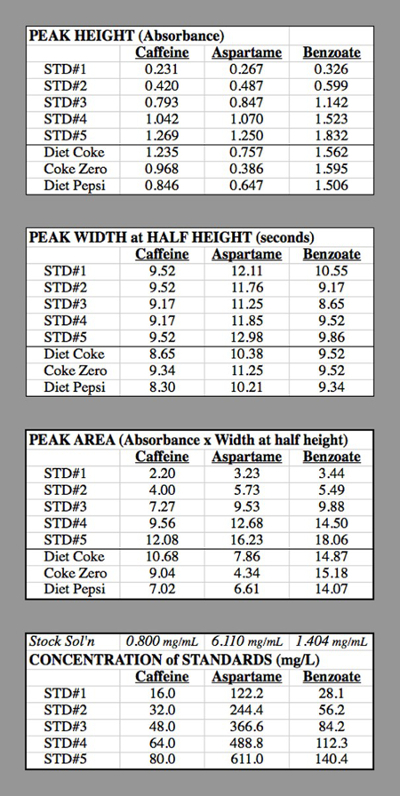
Table 2. The data tables for the HPLC trials used for generating the calibration curves.
Applications and Summary
HPLC is a widely-used technique in the separation and detection for many applications. It is ideal for non-volatile compounds, as gas chromatography (GC) requires that the samples are in their gas phase. Non-volatile compounds include sugars, vitamins, drugs, and metabolites. Also, it is non-destructive, which allows each component to be collected for further analysis (such as mass spectrometry). The mobile phases are practically unlimited, which allows changes to the polarity of pH to achieve better resolution. The use of gradient mobile phases allows for these changes during the actual trials.
There has been concern over the possible health issues that may be associated with the artificial sweetener aspartame. Current product labeling does not show the amount of these components inside of the diet beverages. This method allows for quantifying these amounts, along with the caffeine and benzoate.
Other applications include determining the amounts of pesticides in water; determining the amount of acetaminophen or ibuprofen in pain reliever tablets; determining whether there are performance-enhancing drugs present in the bloodstream of athletes; or simply determining the presence of drugs in a crime lab. While the concentrations of these samples, and often the identity of the components, can be readily determined, the one limitation is that several samples could have close to identical retention times, resulting in co-eluting.
Trascrizione
High-performance liquid chromatography, or HPLC, is a highly versatile technique that separates components of a liquid mixture based on their different interactions with a stationary phase.
HPLC is an adaptation of column chromatography. In column chromatography, a column is packed with micro-scale beads called the stationary phase. The stationary phase beads are functionalized with chemical groups that induce an interaction between the bead and the components of a mixture located in the liquid, or mobile phase. As the mixture flows through the column, the components interact with the stationary phase differently.
In HPLC, column chromatography is performed at a higher flow rate, and therefore higher pressure, than classical column chromatography. This enables the use of smaller stationary phase beads with a greater surface area to volume ratio, which greatly increases the interaction of the stationary phase and components in the mobile phase.
This video will introduce the basics of the operation of HPLC by demonstrating the separation of components of various diet sodas.
There are two types of HPLC used in the laboratory: analytical, and preparative. In analytical HPLC, the instrument is used to identify components of a small volume, and the analyzed sample is then discarded as waste. In preparative HPLC, the instrument is used to purify a mixture and a desired amount of each component is collected in fractions.
The HPLC instrumentation consists of a series of simple components. First, the mobile phase, held in solvent reservoirs, is pumped through the system by one or more pumps at a constant flow rate. The sample is injected into the mobile phase stream by the sample injector. The sample, diluted by the mobile phase, is then delivered to the HPLC column, where the components of the sample are separated. The components are then analyzed by the detector, and either saved in fractions for later use, or transferred to a waste bottle.
The HPLC column is the key component to the system. It is composed of a metal or plastic cylinder, packed with micro-scale beads of stationary phase, or chromatography resin. The sample mixture flows through the packed particle bed at a constant flow rate and each component interacts with the stationary phase as it flows by.
The compounds interact with the stationary phase differently, and therefore travels down the length of the column to the detector at a different rate. The time required for a component to exit the column, or elute, is called the retention time. The result is a plot of retention time vs. intensity, or a chromatogram. The retention time is used to identify the component. The peak size, specifically the area under the peak, is used to quantify the amount of the compound in the initial solution.
The choice of stationary phase depends on the properties of the components in the sample mixture. The most commonly used stationary phase is silica beads, as they are an inert nonpolar material that forms micro-scale beads, and achieves sufficient packing density. The most common type of HPLC is reversed-phase chromatography, which utilizes a hydrophobic stationary phase, typically silica beads with C18 chains bonded to the beads’ surface. The components are eluted in order of decreasing polarity.
The mobile phase used in reversed-phase chromatography is typically a mixture of water and an organic solvent, such as acetonitrile. Depending on the sample, the mobile phase can remain a constant ratio of water and organic solvent, known as isocratic mode. However, this can lead to broad peaks, in the case of high water content, or overlapping peaks—in the case of high organic content.
The mobile phase ratio can also be changed linearly or stepwise during the separation, to create a mobile phase gradient. A gradient elution can prevent peak broadening of the less polar components, thereby improving the separation and shortening the elution time.
Now that the basics of HPLC have been outlined, the HPLC technique will be demonstrated in the laboratory. In this experiment, HPLC will be used to separate and quantify three common components of diet soda.
First, to prepare the mobile phase, add 400 mL of acetonitrile to 1.5 L of purified deionized water. Then carefully add 2.4 mL of glacial acetic acid. Dilute the solution to a total volume of 2 L. The resulting solution should have a pH between 2.8 and 3.2.
Adjust the pH to 4.2 by adding 40% NaOH, drop-wise to the stirring solution, with the use of a calibrated pH meter.
Filter the mobile phase through a 0.47-μm membrane filter under vacuum to degas the solution and remove solids that could plug the column. It is important to degas the solution, as bubbles can cause voids in the stationary phase, or work their way to the detector cell and cause instability in measurements.
Prepare three component solutions of caffeine, benzoate, and aspartame, which are three typical components of diet sodas. These component solutions are then used to prepare the standard solutions that will be utilized to determine the unknowns. Prepare 500 mL of the caffeine and benzoate solutions.
Prepare 100 mL of the aspartame component solution. Store the solution in the refrigerator when not in use to avoid decomposition.
Next, prepare 7 standard solutions, each with different concentrations of caffeine, benzoate, and aspartame. Pipet the proper amount of each component into a volumetric flask, and dilute to the 50-mL mark with mobile phase.
The first 3 solutions each contain one component, to enable peak identification. The other 4 solutions contain a range of concentrations of all 3 components, in order to correlate peak height to concentration.
Pour each standard solution into a labeled vial in a sample rack. Store the sample rack with samples and the remaining solutions in the refrigerator.
First, set up the mobile phase and waste containers. Ensure that the waste lines are fed into a waste container, and are not recycling back into the mobile phase. Ensure that the inlet mobile phase line is fed into the mobile phase container.
Verify that the flow rate of the mobile phase is set to 0.5 mL/min. This flow rate will enable all components to elute within 5 min, but is slow enough to ensure resolution of individual peaks.
Next, verify the minimum and maximum pressures on the solvent delivery system. These settings shut the pump off in case of a leak or clog, respectively.
Press “zero” on the detectors front panel, to set the blank. Rinse a 100-μL syringe with deionized water, then with several volumes of 1 of the 7 working standards. Then fill the syringe with that solution. Begin with the 3 single-component samples in order to identify the peak of each component.
Next, manually inject the solution, by placing the injector handle in the load position. Slowly inject the 100 μL of solution through the septum port.
Verify that the data collection program is set to collect data for 300 s, which allows for enough time for all 3 peaks to elute through the detector. When ready to begin the trial, rotate the injector handle to the inject position, in order to inject the sample into the mobile phase. Immediately, click “Start Trial” on the data collection program. When the scan is complete, repeat the process for each of the 7 standard solutions. For each of the first 3 standards, only one of the 3 peaks appears. Note the location of the peak, which is used to identify the component.
Select 3 diet soda samples, and allow them to sit out in open containers overnight to remove the carbonation.
After overnight degassing, draw approximately 3 mL of each diet soda into a plastic syringe. Next, attach a filter tip to the syringe and push the soda through the filter into a glass vial, in order to remove any solid particulates.
Dilute 2 mL of each sample with 2 mL of the mobile phase to decrease the soda concentration by half.
Draw 100 μL of one of the soda samples into a syringe, and inject it into the sample loop. Run the trial with identical parameters to the standard solutions. Repeat for each soda sample.
First, correlate the peak areas of the standard samples to the known concentrations. To do so, determine the peak areas on the chromatographs for each standard sample using the triangular method. Calculate the peak height times with the width at half of the height, and use this value as the peak area.
Using the peak area and known concentrations create a calibration curve for each component, and determine the least-squares fit for each calibration curve.
Calculate the concentration of each component in the diet sodas from the peak areas. Remember that the sodas were all diluted by a factor of 2 prior to injection into the HPLC. Based on these results, calculate the mg of each component in a 12-oz can of soda.
Unsurprisingly, all 3 sodas tested contained roughly the same amount of the preservative benzoate. However, the Coke products contained more caffeine. The calculated values for all components correlated well to reported values by the manufacturers.
HPLC is a highly versatile instrument, which is used in a wide range of analyses.
HPLC is often used to purify peptide molecules. In this example, transmembrane peptide complexes were prepared, and then stabilized by oxidative crosslinking the proteins with disulfide bonds.
The proteins were then dissolved in formic acid, and purified using reversed phase HPLC. The sample was then eluted using a linear gradient of two solvents, and the purity confirmed with mass spectrometry.
HPLC can also be used to identify organic compounds synthesized in the lab. In the Miller-Urey experiment, the abiotic synthesis of organic compounds on primordial earth was studied. Primordial gases, such as methane and ammonia, were introduced to a flask containing water, simulating early oceans. Electrical discharge was then applied, imitating lightning on primordial earth.
The water was then analyzed using HPLC coupled with mass spectrometry, and compared to known amino acid standards. 23 amino acids were synthesized and identified in this experiment.
You’ve just watched JoVE’s introduction to HPLC. You should now understand the basics of running the instrument, and analyzing the resultant data.
Thanks for watching!