גלי קול ומשמרת דופלר
English
Condividere
Panoramica
מקור: אריאנה בראון, אסנטה קוריי, PhD, המחלקה לפיזיקה ואסטרונומיה, בית הספר למדעי הפיזיקה, אוניברסיטת קליפורניה, אירווין, קליפורניה
גלים הם הפרעות שמתפשטות בחלל בינוני או ריק חומרי. גלי אור יכולים לנוע דרך ואקום וצורות מסוימות של חומר, והם רוחביים בטבע, כלומר התנודות מאונכות לכיוון ההתפשטות. עם זאת, גלי קול הם גלי לחץ הנעים דרך מדיום אלסטי כמו אוויר, והם אורך בטבע, כלומר התנודות מקבילות לכיוון ההתפשטות. כאשר הצליל מוצג למדיום על ידי אובייקט רוטט, כמו מיתרי הקול של אדם או מיתרים בפסנתר, החלקיקים באוויר חווים תנועה קדימה ואחורה כשהעצם הרוטט נע קדימה ואחורה. התוצאה היא אזורים באוויר שבהם חלקיקי האוויר נדחסים יחד, הנקראים דחיסות, ואזורים אחרים שבהם הם מפוזרים זה מזה, הנקראים נדירים. האנרגיה הנוצרת על ידי גל קול מתנדנדת בין האנרגיה הפוטנציאלית שנוצרת על ידי הדחיסות לבין האנרגיה הקינטית של התנועות הקטנות והמהירויות של החלקיקים של המדיום.
ניתן להשתמש בדחיסות ובדחיסות נדירות כדי להגדיר את הקשר בין מהירות גלי הקול לתדירות. מטרת הניסוי היא למדוד את מהירות הקול באוויר ולחקור את השינוי הנראה לעין בתדירות של אובייקט הפולט גלי קול בזמן תנועה, הנקרא אפקט דופלר.
Principi
Procedura
Risultati
Room Temp: 20 °C
Expected velocity: v = 331.4 + 0.6(20) = 343.4 m/s
| Frequency | Initial in-phase Distance | Final in-phase Distance | Wavelength | Calculated Velocity | % Error |
| 5 kHz | 27.4 cm | 34.3 cm | 6.90 cm | 345 m/s | 0.5% |
| 8 kHz | 25.5 cm | 29.75 cm | 4.25 cm | 340 m/s | 1.0% |
| 3 kHz | 22.8 cm | 34.2 cm | 11.40 cm | 342 m/s | 0.4% |
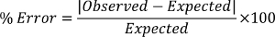
Using Equation 2, the speed of sound can be calculated to a fairly accurate value. For example, for the first frequency, f = 5 kHz = 5,000 Hz and λ = 6.90 cm = 0.069 m, so velocity = λf = 5,000 x 0.069 = 345 m/s. To determine the error between the expected velocity and the observed velocity, we employ the following:
The Doppler effect will be evident by the swinging of the tuning fork, or any other sound emitting object. As the tuning fork swings towards the microphone, the sound waves get bunched together producing a higher frequency, as evident by the bunching of sound waves on the oscilloscope. As the fork swings away, the waves become more spread out and so do the waves on the oscilloscope.
Applications and Summary
In this experiment, the wave properties of sound are defined and explored. Specifically, the relationship between sound wave frequency, wavelength, and speed were confirmed. Tuning forks are designed to emit only one frequency, making them optimal devices to demonstrate the Doppler effect. As the tuning fork moves closer and further from the observer, the frequency appears higher and lower pitched, respectively. Both the Doppler effect and Equation 2 can be extended to other waves forms, such as light.
As humans, we use sound waves to communicate every day. However, one of these forms of communication truly represents how our species first harnessed the physics of sound: music, particularly instruments that require breath. Open-end air column instruments, like the trumpet, tuba, or flute, consist of an air column enclosed inside of a hollow tube that is sometimes curved. As air is pushed into the instrument, a vibration occurs inside that causes the pressure waves to reflect off the insides of the tube. However, only pressure waves of certain wavelengths and frequencies with reflect in such a way that they begin to interfere with the incident waves thus creating standing pressure waves. Each musical instrument has a set of natural frequencies at which it vibrates, or resonates. These are called the harmonics and each harmonic is associated with a specific standing wave pattern defined by its endpoints, wavelength, and frequency. In a flute, holes can be opened along the flute to reduce the effective length of the boundaries, therefore reducing the wavelength and increasing the frequency. In a trumpet, valves make the air travel through different parts of the trumpet that are different sizes, resulting again in changes in wavelength and frequency.
A notable application of the Doppler effect is the Doppler radar, used by meteorologists to read weather events. Typically, a transmitter emits radio waves at a specific frequency towards the sky from a weather station. The radio waves bounce off of clouds and precipitation and then travel back to the weather station. The frequency of the waves reflected back to the station appear to decrease if the clouds or precipitation are moving away from the station, whereas the radio frequency appears to increase if the atmospheric objects are moving towards the station. This technology can also be applied to determine wind speeds and direction.
The Doppler effect also has applications in medical physics. In a Doppler echocardiogram, sound waves of a certain frequency are channeled into the heart and reflect off of blood cells moving through the heart and blood vessels. Similar to the Doppler radar, cardiologists can understand the speed and direction of blood flow in the heart due to the shift in frequencies received after reflection. This can help them identify areas of obstruction in the heart.
Trascrizione
Unlike light waves, sound waves are disturbances that propagate through a medium, which could be solid, gas, or liquid.
Light waves are transverse waves that have oscillations perpendicular to the direction of propagation. Whereas sound waves are longitudinal pressure waves whose oscillations are parallel to the direction of propagation.
In this video, we will explore various properties of sound waves, and learn about the Doppler Effect — a phenomenon discovered by Austrian physicist Christian Doppler. Next, we will learn how to measure the speed of sound coming out of speakers, and how to visualize Doppler effect in the lab. Finally, we will see some examples where these concepts are applicable.
Let’s begin by discussing the properties of the sound waves and the Doppler Shift phenomenon. When sound is introduced through the vibration of an object, such as a guitar string, the particles in the air experience forward and backward motion.
This creates regions in the air where particles are compressed, called compressions, or spread apart, called rarefactions. These features can be used to define the relationship between the sound waves speed and frequency.
The distance between the compressions is the wavelength, or lambda, which has the unit of meters. Frequency is the number of wavelength cycles per second and it is expressed in Hertz. The speed of sound is the product of these two qualities.
Since the sound waves travel due to compression of the particles in the medium, the density of the air molecules have an effect on the speed of the sound. The density of air depends on the surrounding’s temperature, so the speed of the sound wave also depends on temperature.
Assuming the air is at a standstill, the speed of the sound wave through air can be calculated using the following equation, where Tc is the air temperature in Celsius.
If the air is moving, the speed of sound will change depending on the direction of air movement. For example, if the sound wave is moving in the opposite direction of a strong wind, the waves speed is decreased by the speed of the wind.
Now, let’s look at what happens when the source of the sound is moving. Take for example, an ambulance emitting a siren at a fixed frequency, ft. As the ambulance is approaching, the perceived pitch of the siren, fr, increases until it reaches you. This is because as the siren moves towards you, the relative positions of the sound waves bunch together, and the sound appears to have a higher frequency than the transmitted frequency.
By the same logic, as the ambulance drives away, you hear the siren at a lower and lower pitch, as the sound waves spread apart and the sound appears to have a lower frequency than the transmitted frequency. The difference between the emitted and perceived frequencies at any given time is called the Doppler effect, or the Doppler shift.
Now that we’ve discussed the basics of sound waves and the Doppler shift, let’s first take a look at how to measure the speed of sound at different frequencies. Then, we’ll demonstrate how to visualize the Doppler effect using a moving apparatus.
First, set up two speakers facing one another on an optical bench. Connect one speaker to a function generator using a BNC tee, with the other side of the BNC tee connected to channel 1 or A on an oscilloscope
Then, connect the second speaker to channel 2 or B on the oscilloscope.
Turn on the function generator and oscilloscope, and adjust the dial on the function generator to produce a wave with 5 kHz frequency. The speaker connected to the function generator should produce a steady pitch that sounds like an alarm. Two 5kHz waves that are out of phase with one another, one for the emitting speaker and one for the receiving speaker should appear in different colors on the oscilloscope.
Slowly slide the speaker connected to channel B along the bench until the two waves are in phase. Then, record the distance between the two speakers.
Next, slowly slide the channel B speaker away from the emitting speaker so the waves are out of phase. Continue sliding the speaker backwards until the waves are in phase again. Record the new distance between the speakers. Repeat the experiment for 8 kHz and 3 kHz frequencies
To calculate the speed of the soundwave, first subtract the final distance from the initial to give the wavelength of the sound wave. Then, use this value and the frequency to obtain the speed. Note the inversely proportional relationship between wavelength and frequency.
Compare the experimental speeds with the expected speed using the temperature of the room. The experimental values for different frequencies appear to be approximately the same, and the difference between them and the expected value is equal to or less than one percent.
First, tie a one-meter-long piece of string to the end of a Doppler apparatus. When held at waist height, the apparatus should get close to, but not touch the floor.
Next, connect a microphone to an oscilloscope channel and place the microphone at a fixed distance –1.5 m — from where you are standing.
Turn on the Doppler apparatus, and hold it in place 1.5 m away from the microphone. Observe the wave on the oscilloscope.
Begin swinging the apparatus around in circles at a steady speed. Those observing the swinging apparatus will notice that the pitch, or frequency, gets higher as it swings closer to them, and lower as it swings away.
Simultaneously, the oscilloscope will show more waves, or a higher frequency, when the apparatus is close to the microphone. When the apparatus is far from the microphone the frequency decreases.
Sound and sound waves are found in everyday life and are used in many areas of arts, science, and medicine.
When someone uses an open-end air column instrument, like the trumpet, the sound waves produced inside the tube create music. As air is pushed into the instrument, a vibration occurs inside that causes the pressure waves to reflect off the insides of the tube.
Only pressure waves of certain wavelengths and frequencies fit inside of the tube and resonate, creating sound. All other wavelengths and frequencies are lost.
The Doppler effect is the basis of the Doppler ultrasound instrument, which is used for vascular assessment. The handheld Doppler device consists of a probe which is placed on the patient’s skin. The probe emits ultrasound waves at a specific frequency, which reflect off of the blood cells and are detected by the receiving element in the probe. The velocity of the blood flow is evident by the change in frequency of the reflected wave.
You’ve just watched JoVE’s introduction the Doppler effect. You should now understand the basic principles of the Doppler effect, how to measure the speed of sound waves in the laboratory, and some applications of the technique in the real world. Thanks for watching!