1. Design and Fabrication of the Microfluidic Test System
- Design microfluidic device as two separate parts: a top part and bottom part (Figure 1) in a CAD program.
- Start making the bottom part by using the rectangle tool to draw a 40 mm by 60 mm rectangle.
- At one corner with the circle tool create a 6.2 mm diameter circle centered 10 mm from edges. With the linear pattern tool replicate the holes across the rectangle with 20 mm spacing for a total of 6 holes.
- Using the fillet tool fillet the rectangles with a radius of 1 mm.
- Extrude the part 10 mm with the extrude tool.
- In the center of the top face, with the rectangle tool create a rectangle 30 mm by 1 mm and with the extrude cut tool cut 0.2 mm for the flow channel.
- Using the circle tool make a 1 mm diameter circle at the end of the flow channel. Then with the line tool construct a path connecting the circle to the nearest 40 mm by 10 mm face, including a 4 mm radius made with the fillet tool. Make a cut along this path with the swept cut tool.
- With the circle tool create a 3.9 mm diameter circle at the center of the flow path and cut 8 mm with the extrude cut tool to allow for fittings.
- Repeat steps 1.7 and 1.8 for the opposite side of the flow channel.
- With the top part repeat steps 1.2-1.5. Then in center of the top face create a permeate channel using the rectangle tool to create a rectangle 30 mm by 1 mm and cut 0.5 mm using the extrude cut tool.
- Use the circle tool to make a 1 mm circle centered in the permeate channel 5 mm from an end. With the line tool construct a path connecting the circle to one of the 1 cm by 6 cm faces, including a 4 mm radius made with the fillet tool. Make a cut along the path with the swept cut tool.
- With the circle tool create additional 3.9 mm diameter circle with its center on the permeate path and cut 8 mm with the extrude cut tool.
- At the parts top 40 mm edges, with the rectangle tool, create rectangles 40 mm by 5 mm adding 4 mm radii with the fillet tool. Use the extrude tool to extrude 3 mm downward for handles.
- Print parts with a multi-material photopolymer 3-D printer using a hard transparent polymer, including 0.05 mm overcoating with a soft rubbery polymer on the face of each part that contains the channel. Use manufacturer’s standard protocol, calibration and settings.
- Tap threads (M5) into feed, retentate and permeate orifices. Use plumber’s tape to connect 1/8” fittings to the feed and retentate and 1/16” fittings to the permeate.
- Connect microfluidic devices to pump, valves, pressure transducer and backpressure regulator with 1/8” tubing (Figure 2).
- Connect 0.45 μm filters to inlet tubes.
- Discharge permeate to flow-meter and beakers on balances with 1/16” tubing.
- Attach continuous rotation servo to backpressure regulator with screws and standard servo to 3-way valve with tie-wire.
- Connect servos and power supply to servo shield.
- Connect pressure transducer, switches and servo shield to microcontroller.
- Connect microcontroller, balances, flow-meter and pump to a PC for data logging and system control.
- Configure balances to print data to their serial port.
2. Prepare Membranes to Be Tested
- Cut membranes to 40 mm x 8 mm.
- Soak membranes in ultrapure water (3 x 10 min) with sonication.
- Then soak the membranes in 50/50 ultrapure water/ethanol for 1 hr.
- Rinse the membranes with ultrapure water and store in ultrapure water at 4 °C.8
3. Prepare Solutions to Be Tested with Nanofiltration Membranes
- Add 500 ml of ultrapure water to an Erlenmeyer flask. Then add 0.04 g of BSA and 0.29 g of NaCl.
- Add 500 ml of ultrapure water to a separate Erlenmeyer flask. Then add 0.6 g of MgSO4.
- Add 500 ml of ultrapure water to a third Erlenmeyer flask. Then add 0.29 g of NaCl.
- Insert stir bars into each flask and place flasks on stir plates. Mix for 5 min at 500 rpm.
4. Perform a Nanofiltration Fouling Experiment
Note: Perform the experiment at RT (ca. 24 °C). First configure the system for measuring a single membrane by closing valves to flow cells not connected to the flow-meter.
- Insert one pump inlet tube into the ultrapure water reservoir and the other inlet tube into the MgSO4 solution (Figure 2).
- Use a syringe to draw water and MgSO4 solution through tubing so as to remove all air bubbles in the system.
- Insert a nanofiltration membrane on the bottom part of the flow cell, with the active side towards the feed channel, and place on the top part of the flow cell.
- Fasten nuts by hand and then tighten evenly with a wrench so as to minimize leakage.
- Select the ultrapure water with the reservoir selector switch.
- Set pump flow rate to 2 ml/min and start the pump.
- Adjust pressure regulator to 4 bar.
- Set experimental parameters to switch reservoirs every 45 min starting with the water reservoir.
- Set reservoir switch to auto, and start experiment.
- At 60 min collect MgSO4 permeate in a tube for next 30 min.
- At 91 min replace MgSO4 flask with flask containing the solution of BSA and NaCl.
- Quickly stop pump and use a syringe to draw BSA solution through the inlet tube to remove MgSO4 leftover in tubing. Then start pump again.
- At 150 min collect BSA permeate in a tube for next 30 min.
- After 225 min, shut down the system and remove nanofiltration membrane from the flow cell.
- Using a syringe, flush out test solution inlet tube with ultrapure water.
- Repeat steps 4.1-4.15 for each additional membrane tested.
- For NaCl only tests, repeat steps 4.1-4.10, and 4.14-4.16 replacing MgSO4 solution with NaCl solution and ending the experiment after 90 min instead of 225 min.
5. Calculate Salt Rejection of Nanofiltration Membranes
- Rinse electrodes of the potentiostat test cell with ultrapure water.
- With a pipette, deposit 5 μl of MgSO4 solution onto the test cell electrodes.
- Record resistance of the solution.
- Repeat steps 5.1-5.3 four more times and calculate the average value.
- Repeat steps 5.1-5.4 for the NaCl and BSA/NaCl solutions as well as for each permeate solution collected.
- Calculate salt rejection with Equation 1:
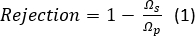
where Ωs is the resistance of the test solution and Ωp is the resistance of the permeate. The resistance is inversely proportional to conductivity of a solution, which directly correlates to salt concentration.
6. Prepare Solution to Be Tested with Ultrafiltration Membranes
- Add 1 L of ultrapure water to a 4 L beaker. Then add 0.32 g of BSA.
- Insert stir bar into beaker and place on a stir plate. Mix for 5 min at 500 rpm.
- Add additional 3 L of ultrapure water to beaker and mix again for 5 min at 500 rpm.
7. Perform an Ultrafiltration Fouling Experiment
Note: Perform an experiment at RT (ca. 24 °C). First configure the system to measure 4 membranes in parallel by opening all valves to flow cells.
- Place one pump inlet tube into the ultrapure water reservoir and other inlet tube into the BSA solution (Figure 2).
- Use a syringe to draw the water and the BSA solution through the tubing so as to remove all air bubbles in the system.
- Insert ultrafiltration membranes on the bottom part of the flow cells, with the active sides towards the feed channels, and close the cells with the top halves of the microfluidic device.
- Fasten nuts by hand, then tighten evenly with a wrench. Improper tightening may lead to water leakage.
- Select ultrapure water with reservoir switch.
- Set pump flow rate to 8 ml/min and start the pump.
- Adjust pressure regulator to 0.4 bar.
- Monitor flux values of membranes with data acquisition software according to manufacturer’s protocol.
- Adjust pressure regulator until average flux is 200 LMH ± 10%.
- Replace individual membrane if flux is not 200 LMH ± 20%.
- Enter experimental run parameters. First select the ultrapure water reservoir for 60 min with a constant flux of 200 ± 20 LMH. Then, select the BSA reservoir for 420 min with manual control of the pressure regulator. Finally, select the ultrapure water reservoir for 15 min with manual control of the pressure regulator to the flush system at the end of experiment.
- Set reservoir switch to auto, and start experiment.
- After run completion, shut system down and remove membranes from flow cells.
- With a syringe, flush pump inlet tube with ultrapure water.
The microfluidic flow cells were designed using a CAD program and printed using a multi-material photopolymer three-dimensional (3-D) printer. This cell was designed in two parts, so that membranes could be easily inserted and removed from the device (Figure 1). Each part was 1 cm thick, printed from a hard, clear polymer for structural integrity, and the sides facing the membrane were overcoated with a very thin 50 µm layer of rubber-like polymer. The overcoating was performed to provide the cell with a sealing capability, which prevents water leakage. A flow channel was designed at 0.2 mm deep, 1 mm wide and 30 mm long to test a 30 mm2 area of membrane. After cutting the membranes to 40 mm by 8 mm and washing protocol, a test membrane was inserted into the device. Six stainless steel bolts and nuts (M6) were used to tighten the device and it was connected to the system (Figure 2). In this manner, the cell is permanently connected to the system, while membranes may be easily replaced. One cell was operated for nanofiltration membrane experiments, and four cells were operated in parallel for ultrafiltration membrane experiments.
For nanofiltration membranes, a flow meter was connected to measure the permeate flux. To perform an experiment, pure water at a rate of 2 ml/min. was initiated and the pressure was adjusted to 4 bar. This resulted in a permeate flux of ~40 LMH (Figure 3), and corresponded to ~10 LMH/bar. After equilibration and observation of a constant flux (ca. 45 min), the solution was changed to MgSO4 (10 mM) to test for rejection and verify the integrity of the membrane, and permeate was collected. The resistivity of this solution was measured which is inversely proportional to conductivity. At the salt concentrations tested, the conductivity is linearly proportional to the concentration and the % salt rejection may be calculated. The membranes tested in the present experiment gave 83% ± 4%, and 64% ± 3% rejections of MgSO4 and NaCl, respectively. The system feed was then returned to pure water until a stable flux was achieved, and then changed to an aqueous solution of BSA (0.08 g/L) in NaCl (10 mM). The decrease in flux compared to the flux of a control membrane under the conditions of 10 mM NaCl indicated membrane fouling due to BSA.
For ultrafiltration membranes, four microfluidic devices were connected in parallel, with permeate flux measured using balances. These balances were connected to the computer and facilitated continuous data collection. Using a pure water feed rate of 8 ml/min for the system, which is 2 ml/min per flow cell, the pressure was adjusted in order to obtain an average flux of 200 LMH (Figure 4). The flux of each membrane was assessed, and the membrane was replaced if the flux difference was > 20% from the initial chosen flux average of 200 LMH. The solution was changed to BSA (0.08 g/L) and the flux decrease was monitored. The feed solution was then changed back to pure water. For representative results, we compared 30 and 50 kDa hydrophilic polyethersulfone ultrafiltration membranes, and observed that although 50 kDa membrane had a higher normalized flux at the termination of the experiment (26.5% of initial flux) compared with 23% for the 30 kDa membrane, the difference was not significant.
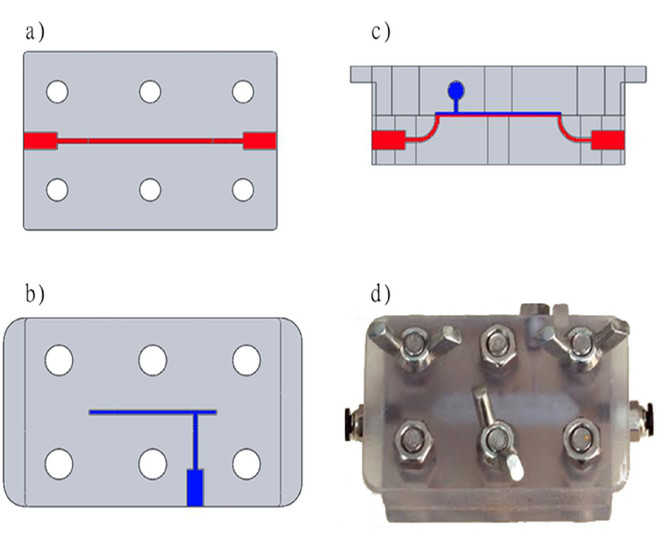
Figure 1. Design and image of the microfluidic device used. The design was made using a CAD program and printed using a three-dimensional photopolymer printer. (A) Bottom part containing the feed channel (top view). (B) Top part containing the permeate channel (top view). (C) Assembly of the device (side view). (D) Image of the functional device including a membrane coupon, the parts fastened together with nuts and bolts. Please click here to view a larger version of this figure.
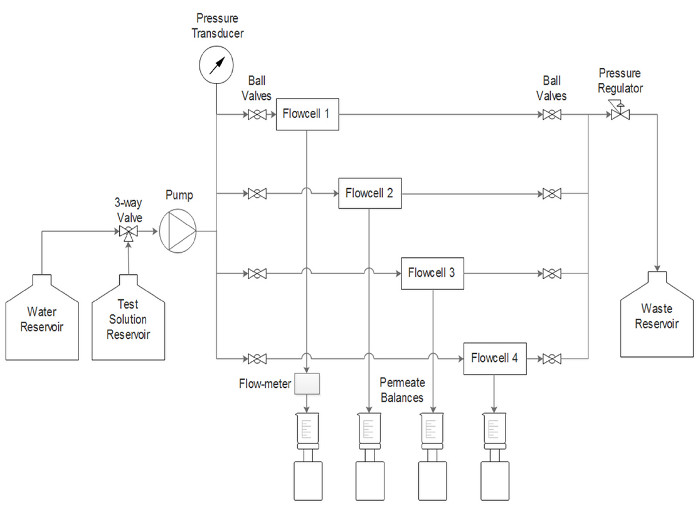
Figure 2. Schematic representation of the system. The nanofiltration membrane testing was performed using Flow cell 1. The ultrafiltration membrane testing was performed using all 4 flow cells in parallel. Computer data logging not shown. Please click here to view a larger version of this figure.
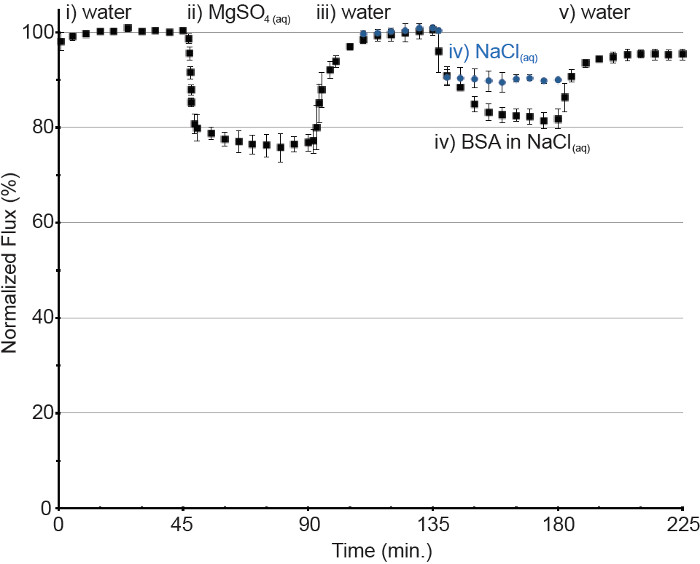
Figure 3. Performance and fouling of a nanofiltration membrane under cross-flow conditions. Experimental conditions for full run (black square): i) ultrapure water, 2 ml/min, 4 bar. ii) 10 mM MgSO4, 2 ml/min, 4 bar. iii) ultrapure water, 2 ml/min, 4 bar. iv) BSA (0.08 g/L) in 10 mM NaCl, 2 ml/min, 4 bar. v) ultrapure water, 2 ml/min, 4 bar. Control membrane 10 mM NaCl, 2 ml/min, 4 bar (blue circle). Error bars denote the standard deviation. Please click here to view a larger version of this figure.
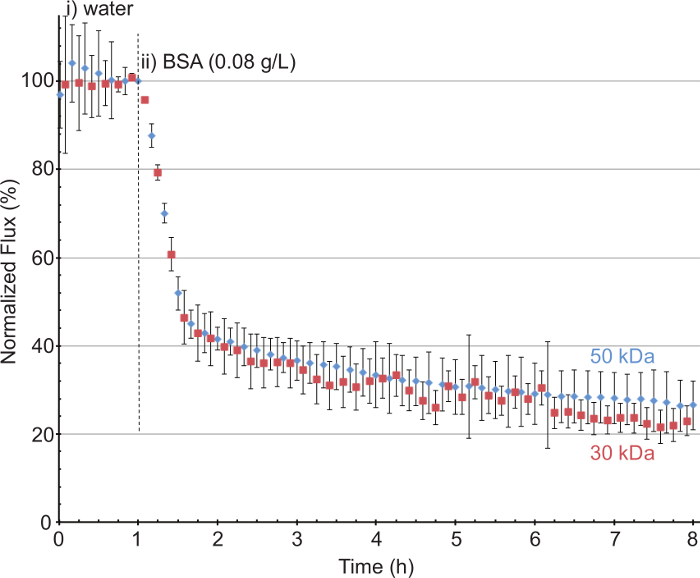
Figure 4. Fouling of ultrafiltration membranes 30 kDa (red square) and 50 kDa (blue diamond) under cross-flow conditions. i) pressure was adjusted so that average initial pure water permeate flux was 200 LMH. ii) BSA (0.08 g/L) 2 ml/min. Error bars denote the standard deviation. Please click here to view a larger version of this figure.