Science Education
>

Optimization of the Epimedii Folium Mutton-Oil Processing Technology and Testing Its Effect on Zebrafish Embryonic Development

PREPARAZIONE ISTRUTTORI
CONCETTI
Student Protocol
JoVE Journal
Medicina
È necessario avere un abbonamento a JoVE per visualizzare questo.  Accedi o inizia la tua prova gratuita.
JoVE Journal Medicina
Optimization of the Epimedii Folium Mutton-Oil Processing Technology and Testing Its Effect on Zebrafish Embryonic Development

All animal-related experiments were conducted with approval from the Experiment Ethics Committee of the Chongqing Institute of TCM (laboratory animal ethics review certificate number: ZJS2022-03).

1. Determination of the bioactive components

NOTE: The species used in this research was Epimedium sagittatum, and the samples were collected in Fengdu County, Chongqing. The sample was identified as a dry above-ground part of E. sagittatum (Sieb. et Zucc.) Maxim. by researchers of The Institute of Biological Medicine, Chongqing Institute of Traditional Chinese Medicine.

  1. Prepare the control product solution by accurately weighing the appropriate amount of each reference substance, namely, icariin, epimedin A (EA), epimedin B (EB), epimedin C (EC), and baohuoside I (BI), using an electronic analytical balance, and dissolve in methanol. Using these, prepare a mixed reference stock solution containing 381.61 µg/mL icariin, 124.14 µg/mL EA, 110.24 µg/mL EB, 1091.75 µg/mL EC, and 184.98 µg/mL BI.
  2. Prepare the test product solution by crushing EF through a No. 3 sieve. Place approximately 0.2 g (using an electronic analytical balance) of crushed EF into a stoppered Erlenmeyer flask, add 20 mL of dilute ethanol, and then ultrasonicate at 400 W power and 50 kHz frequency for 1 h. Shake well, and pass through a 0.22 µm membrane filter to obtain the test solution.
  3. Perform the chromatography as follows. Use high-performance liquid chromatography (HPLC) with a C18 column with dimensions of 4.6 mm x 250 mm and an inner diameter of 5 µm. Use acetonitrile as mobile phase A and ultrapure water as mobile phase B. Use the following gradient elution parameters: 0-30 min, 24% A to 26% A; 30-31 min, 26% A to 45% A; 31-45 min, 45% A to 47% A. Use a detection wavelength of 220 nm (for the detector used, see Table of Materials). Keep the column temperature at 30 °C and the current velocity at 1.0 mL/min, and use a sample size of 10 µL.
  4. To investigate the linear relationship, use the mixed reference solution as in step 1.1 diluted 2 times, 4 times, 8 times, 16 times, and 32 times, for icariin, EA, EB, EC, and BI, respectively. Use acetonitrile as mobile phase A and ultrapure water as mobile phase B.
  5. Use the following gradient elution parameters: 0-30 min, 24% A to 26% A; 30-31 min, 26% A to 45% A; 31-45 min, 45% A to 47% A. Use a detection wavelength of 220 nm (for the detector used, see Table of Materials). Keep the column temperature at 30 °C and the current velocity at 1.0 mL/min and use a sample size of 10 µL. Finally, record the peak areas. Plot the linear regression with the reference concentration (x-axis, µg/mL) as the abscissa and the peak area (y-axis) as the ordinate using professional software (see Table of Materials).
  6. Perform the precision test by measuring the mixed control solution six consecutive times by HPLC using the chromatographic conditions shown in step 1.3. Record the detection time and peak areas of each chemical composition, and calculate the relative standard deviations (RSD) of the peak areas to assess the precision (reproducibility) using the formula below:
    RSD% = standard deviation (SD)/arithmetic mean of calculated results (X) x 100 %
  7. To perform the reproducibility test, accurately weigh the EF powder, and prepare six parts of the test product solution in parallel according to the method in step 1.2. Subject the prepared solutions to HPLC under the chromatographic conditions presented in step 1.3. Record the retention times and peak areas of each chemical composition and calculate the amounts of each compound from a standard curve (peak areas versus concentrations). Calculate the RSD% as above.
  8. To perform the stability test, store the test solutions at room temperature, and measure their contents by the HPLC method described in step 1.3 at 0 h, 2 h, 4 h, 8 h, 12 h, and 24 h after preparation to assess the stability. Record the retention times and peak areas of each chemical composition and calculate the RSD% of the peak areas as above.
  9. To perform the sample recovery test, weigh 0.2 g of EF powder into a stoppered Erlenmeyer flask for six replicates. Add an appropriate amount of the reference solution (the amount of reference substance added to the sample is equivalent to 100% of the known content of the sample) and prepare the test solution according to the method presented in step 1.2.
  10. Inject the samples into the chromatograph and analyze according to the chromatographic conditions in step 1.3. Record the peak areas, and calculate the average recovery and RSD% values as below:
    Spiked sample recovery rate = (spiked sample content − sample content)/sample amount x 100%

2. Optimization of the EF mutton-oil processing technology using the Box-Behnken design-response surface methodology

  1. Select the key parameters in EF processing, such as the amount of mutton oil (A; 15%-35%), the mutton oil temperature (B; 50-120 °C), and the frying temperature (C; 80-300 °C), as influential factors. Use the comprehensive scores of icariin, EA, EB, EC, and BI content as the evaluation indexes. The percentage of mutton oil here is the mass percentage.
  2. Use the response surface analysis software (see Table of Materials) to design the Box-Behnken response surface experiments, explore the quadratic response surface, and construct a second-order polynomial model. Select the new Box-Behnken Design, and set the Numeric Factors option to 3; set factors A, B, and C. Click on Continua. Set the Responses option to 1 (which was the comprehensive score). Click on Continua to complete the design. A total of 17 experiments were planned (see Table 1).
    NOTE: For the independent and dependent variables, along with their low, middle, and high levels, see Table 2.
  3. Process the EF according to the specific parameters in Table 1; for example, for order number 1, weigh refined mutton oil as 15% v/v, and then heat to 50 °C to melt it. Add the crude EF to the melted mutton, stir-fry over a gentle fire (190 °C) until it is evenly shiny, and then remove and cool. Performed 17 experimental operations. A total of 17 groups of EF-processed products were obtained in this work.
    NOTE: Mutton oil is solid at room temperature (25 °C) and melts into liquid when heated. Mutton oil in a liquid state can be used as the excipient.
  4. Prepare the test solutions of the processed products according to the method described in step 1.2. Then, analyze them using HPLC according to the chromatographic conditions described in step 1.3. Record the retention times and peak areas of each chemical composition, and calculate the contents of the icariin, EA, EB, EC, and BI in each test solution against an external standard curve. Use the comprehensive score calculation formula below to calculate the comprehensive scores of the 17 experimental groups:
    Comprehensive score = Z/Zmax × 0.5 + BI/BImax × 0.5
    where Z is the sum of the icariin, EA, EB, and EC contents; Zmax is the maximum value of the sum of the icariin, EA, EB, and EC contents in the 17 experimental groups; BI is the BI content; and BImax is the maximum value of the BI content in the 17 experimental groups.
  5. Import the comprehensive scoring results for the 17 groups of experiments into the data analysis software (see Table of Materials) to analyze the experimental data. Under the evaluation items, select the quadratic process order option and polynomial model type option.

3. Testing the effect of processing on zebrafish embryonic development

  1. Sample preparation
    1. Crush the crude and processed EF through a No. 3 sieve (see Table of Materials). To 100 g of each EF sample, add 1,000 mL of ultrapure water. Soak the EF for 0.5 h, boil the water twice for 30 min each, and then filter with filter paper.
    2. Combine the filtrates and concentrate the sample by heating. Add ultrapure water to a final volume of 100 mL to obtain the processed EF (PEF, 1 g/mL) and the crude EF (CEF,1 g/mL) stock solutions. Measure the amount of raw drug in each stock solution.
    3. Place aliquots of 1 mL, 1.5 mL, 2.5 mL, 5 mL, and 7.5 mL stock solutions in 10 mL volumetric flasks, and then add ultrapure water to volume to prepare the test solutions with concentrations of 100 mg/mL, 150 mg/mL, 200 mg/mL, 250 mg/mL, 500 mg/mL, and 750 mg/mL for the zebrafish embryotoxicity study.
      NOTE: The concentrations of the test solutions were prepared by referring to the relevant literature20,21 and by performing preliminary experiments to give the 10-fold concentration gradient used in normal toxicology. CEF was an unprocessed sample, and PEF was a sample prepared with the best processing technology described in section 2.
  2. Zebrafish husbandry and embryo treatment21
    1. Adapt wild-type zebrafish (see Table of Materials) at a controlled temperature for 2 days, keep them in a flow-through aquarium at pH 7.0-7.4 and feed them twice daily.
      NOTE: The inhibition of melanin formation in zebrafish was achieved by adding 1-phenyl-2-thiourea in a concentration of 0.003% (mass/volume) to the culture medium, which kept their bodies transparent for morphological observation.
    2. Select adult fertile wild-type zebrafish in the evening and separate them by using baffles in mating boxes. Remove the baffles the following morning, and allow the fish to spawn for 30 min. Collected the fertilized eggs with a dropper every 15 min. In total, 520 healthy wild-type embryos were collected. Keep the zebrafish embryos in an incubator at 28.5 °C for 24 h.
    3. Randomly assign the healthy embryos at 24 h post fertilization (hpf) to 13 groups, and along with one control group, separately soak in 10 mL of each of the following solutions in a culture dish: PEF: 100 µg/mL, 150 µg/mL, 200 µg/mL, 250 µg/mL, 500 µg/mL, 750 µg/mL; CEF: 100 µg/mL, 150 µg/mL, 200 µg/mL, 250 µg/mL, 500 µg/mL, 750 µg/mL . Treat the blank control group with the medium as a solution. Each group contained 40 embryos in this study.
      NOTE: The medium composition is 0.15 M NaCl, 5 mM KCl, 0.25 mM Na2HPO4, 0.45 mM KH2PO4, 1.3 mM CaCl2, 1.0 mM MgSO4, and 4 mM NaHCO3.
    4. Culture the zebrafish in a constant temperature incubator for up to 120 hpf. Count the number of dead larvae every day, observe the main organ morphology of the larvae in each experimental group under a stereomicroscope (scale bar = 500 µm, see Table of Materials), and calculate the half-death concentration (LC50) of zebrafish at 72 hpf by using data analysis software (see Table of Materials).

Optimization of the Epimedii Folium Mutton-Oil Processing Technology and Testing Its Effect on Zebrafish Embryonic Development

Learning Objectives

Methodological investigation results
A linear relationship between the concentration of icariin, EA, EB, EC, BI, and chromatographic peak areas was observed (see Table 3). The RSD% values (n = 6) of the chromatographic peak areas of icariin, EA, EB, EC, and BI were 0.28%, 1.22%, 0.65%, 1.67%, and 1.06%, respectively, indicating that the precision of the HPLC measurements was good. The RSD% values (n = 6) of the contents of icariin, EA, EB, EC, and BI were 1.59%, 1.46%, 1.86%, 2.29%, and 0.98%, respectively, indicating that the method had good repeatability. The RSD% values (n = 6) of the peak areas of icariin, EA, EB, EC, and BI in the samples were 1.49%, 1.96%, 1.42%, 0.96%, and 0.81%, respectively, indicating that the sample solution was stable within 24 h. The average recovery rates of icariin, EA, EB, EC, and BI were 99.98%, 100.14%, 100.09%, 100.75%, and 100.94%, respectively, and the RSD% values were 0.56%, 0.78%, 0.84%, 1.10%, and 1.47%, respectively (see Table 4). These results show that the accuracy of the method met the requirements.

The above experimental results showed that the analytical method provided results that had excellent precision, reproducibility, and accuracy and were acceptable for the quality analysis of the EF-processed products.

Optimization of the mutton-oil processing technology of EF by applying the Box-Behnken design-response surface methodology
We performed quadratic polynomial regression fitting of the above data to obtain the following model: Y = 0.86 − 0.11 x A + 0.025 x B − 0.078 x C − 0.023 x A x B − 0.037 x A x C + 0.037 x B x C − 0.045 x A2 + 2.5 x 10⁻³ x B2 − 0.14 x C2. The variance analysis gave a value of P < 0.01, indicating that the model was significant. The P value of the lack of fit was P > 0.05, indicating that the lack of fit was not significant. The R2 value was 0.9300, indicating that the fit of the model was good, and the error was small. It was feasible to use this model to analyze and predict the effect of the chemical composition content of the EF stir-fried with mutton oil. In addition, A2 and D2 had an effect on the content of the processed products, and the difference was statistically significant (P < 0.01). The effects of A and C of the one-degree term and C2 of the second-order term on the comprehensive score were significant. The one-degree term B, the second-order A2, B2, and all of the interaction items had no significant effect on the comprehensive score. The analysis of the P values showed that, of the experimental parameters, the mutton oil amount (A) had the greatest effect on the comprehensive score, followed by the frying temperature (C), and then the mutton oil temperature (B). The above results are shown in Table 5.

The software was used to set the mutton oil amount, mutton oil temperature, and frying temperature to the medians and to use the comprehensive score as the index to draw a single-factor influence diagram of one factor (Figure 1). Increasing the frying temperature first increased the comprehensive score and then decreased it (Figure 1). The mutton oil temperature had a negligible effect on the comprehensive score. The mutton oil amount was the main significant factor that affected the change in the comprehensive score, and as the amount increased, the content trended downward.

To help better understand the results, the predicted models are presented in Figure 2 as 3D response surface plots. In terms of the slope of the response surface, the greater the significance of the interaction effect between factors, the gentler the slope, and the less significant the effect. An ellipse in the shape of a contour line indicates a strong interaction between factors, whereas a circle indicates the opposite. The response surface of the mutton oil amount and the frying temperature was steeper compared to the other tested factors, and the contour lines tended to be more elliptical (see Figure 2C,D), indicating that the interaction between these two factors was more significant; in contrast, the interactions between other factors were not significant (see Figure 2A,B,E,F).

The optimal mutton oil processing technology of EF was selected as follows: a mutton oil amount of 15%; a mutton oil temperature of 120 °C; and a frying temperature of 189 °C. Considering that the temperature cannot be very accurately controlled in actual operation, the temperature value is specified as a variable ±10 °C. Therefore, the final parameters were as follows: a mutton oil amount of 15%; a mutton oil temperature of 120 °C ± 10 °C; and a frying temperature of 189 °C ± 10 °C. The optimal process was as follows: heating the mutton oil at 120 °C ± 10 °C, adding the crude EF, frying it with a gentle fire (189 °C ± 10 °C) until it is evenly shiny, and removing and cooling. For every 100 kg of EF, 15 kg of mutton oil (refined oil) should be used. Using these conditions, three parallel experiments were conducted, and the scores obtained were 0.96, 0.97, and 0.94 (RSD% = 1.60%), indicating stable and feasible conditions. The typical HPLC chromatograms of the crude, processed, and mixed reference substances of EF are shown in Figure 3.

Test of the effect of processing on the embryonic development of zebrafish
The zebrafish hatched into juveniles at 72 hpf. The development of each organ was basically complete. The fish bodies remained transparent, and it was easy to lay them on their side on the glass slide. The shapes of the organs were easy to observe and identify when viewed under a microscope. The blank control group did not experience any death or organ toxicity during the administration period. Compared with the control group, at a drug concentration of 100 µg/mL, no obvious abnormalities were found in the crude EF group (S) and the processed group (P) at 72 hpf. At 96 hpf and later, swim bladder incompleteness and loss of the swim bladder were more common in the juvenile fish in the crude group but were rare in the juvenile fish in the processed group. At a drug concentration of 150 µg/mL, obvious spinal deformities, body curvature deformities, pericardial edema, and liver deformation were seen in the juvenile fish in the crude group at 72 hpf, but those changes were rare in the juvenile fish in the processed group, and the degree of teratogenicity was weaker than that of the crude group. At a drug concentration of 200 µg/mL, all juvenile fish in the crude group died, and obvious teratogenicity appeared in the juvenile fish in the processed group. At a drug concentration of 250 µg/mL, a small number of zebrafish survived in the processed group. The microscopic examination results of the zebrafish are shown in Figure 4.

The zebrafish mortality rates in the crude and processed Epimedium herb groups depended on the concentration and time of administration. The time-dose-mortality relationship is shown in Figure 5. The zebrafish mortality results showed that 24 h after administration (48 hpf), at a drug concentration of 200 µg/mL, all zebrafish in the crude drug group died, whereas the mortality in the processed group was only 6.67%. At 48 h after EF administration (72 hpf), the concentration that caused the death of all zebrafish in the crude drug group was 200 µg/mL, and the concentration that caused the death of all zebrafish in the processed group was 500 µg/mL. The median lethal concentration of the two experimental groups at 72 hpf was calculated. The results showed that the LC50 (see Figure 6) was 151.3 µg/mL in the crude group (S) and 219.8 µg/mL in the processed group (P).

Figure 1
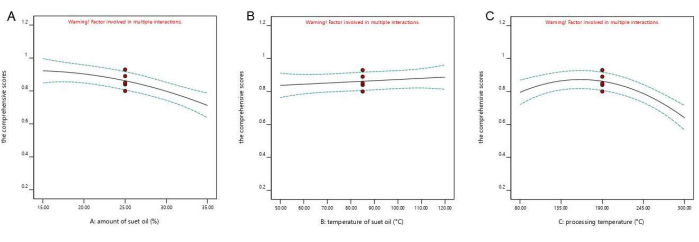
Figure 1: Univariate analysis. The figure shows the single-factor influence diagram. A is the single-factor result of the amount of mutton (suet) oil; B is the single-factor result of the temperature of the mutton (suet)oil; and C is the single-factor result of the frying temperature. With an increasing frying temperature, the comprehensive score first increases and then decreases. The mutton-oil temperature has little effect on the score. The amount of mutton oil was the main significant factor affecting the change in the comprehensive score, and the content showed a downward trend with an increasing amount of mutton oil. Please click here to view a larger version of this figure.

Figure 2
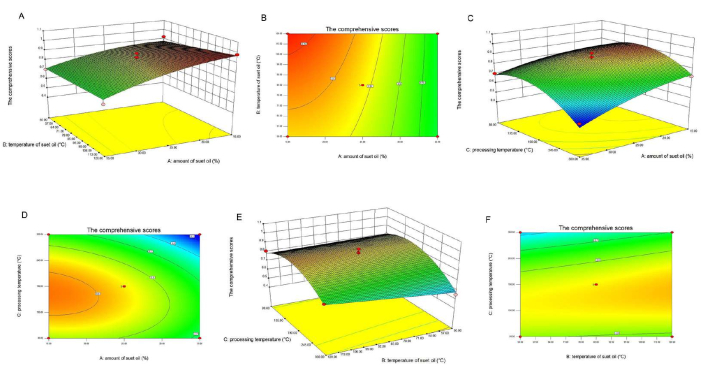
Figure 2: Response surface and contour plot of the influence of different factor interactions on the comprehensive score. (A) This figure shows a 3D response surface plot of the interaction between the mutton oil amount and temperature. (B) This figure shows a contour plot of the interaction between mutton oil amount and temperature. (C) This figure shows a 3D response surface plot of the interaction between the mutton oil amount and processing temperature. (D) This figure shows a contour plot of the interaction between mutton oil dosage and processing temperature. (E) This figure shows a 3D response surface plot of the interaction between mutton oil amount and processing temperature. (F) This figure shows a contour plot of the interaction between mutton oil amount and processing temperature. The result shows that the response surface of the mutton oil amount and frying temperature was steep, than the other tested parameters and the contour lines tended to be elliptical (see C,D), indicating that the interaction between these two factors was significant, whereas the interactions between other factors were not significant (see A,B,E,F). The suet oil term used in the figure refers to mutton oil. Please click here to view a larger version of this figure.

Figure 3
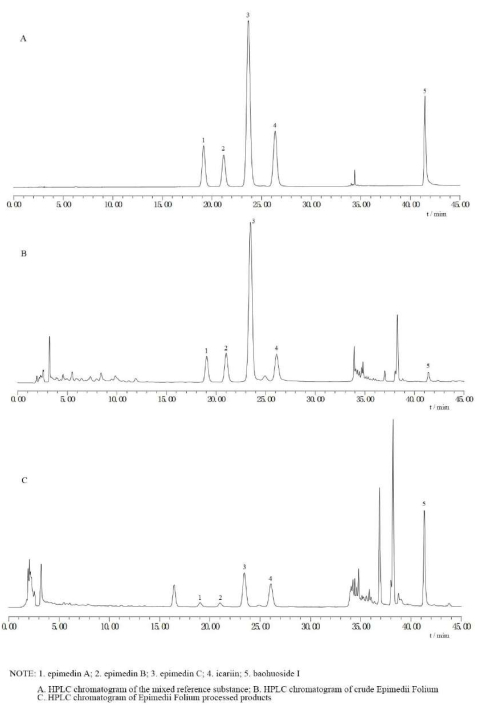
Figure 3: HPLC chromatograms of the crude, processed, and mixed reference substances of EF. (A) This figure shows the HPLC chromatogram of the mixed reference substance. (B) This figure shows the HPLC chromatogram of crude Epimedii folium. (C) This figure shows the HPLC chromatogram of Epimedii folium processed products. These three pictures demonstrate that the BI content in raw EF is low, while it increases after processing. Please click here to view a larger version of this figure.

Figure 4
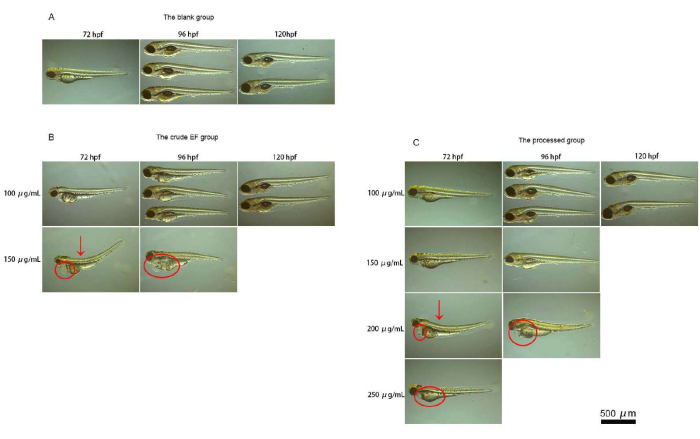
Figure 4: Micrographs of zebrafish. This figure shows micrographs of the zebrafish. (A) This figure shows the results for the observation of the zebrafish under a microscope in the blank group. (B) This figure shows the results for the observation of the zebrafish under a microscope in the crude group. (C) This figure shows the results for the observation of the zebrafish under a microscope in the processed group. The blank control group did not experience any death or organ toxicity during the administration period. At an EF drug concentration of 150 µg/mL, obvious spinal deformities, body curvature, pericardial edema, and liver deformation were seen in the juvenile fish in the crude group at 72 hpf, whereas those changes were rare in juvenile fish in the processed group, and the degree of teratogenicity was weaker than that in the crude group. At a drug concentration of 200 µg/mL, all the juvenile fish in the crude group died, and obvious teratogenicity appeared in the processed group. At a drug concentration of 250 µg/mL, only a small number of zebrafish survived in the processed group. Please click here to view a larger version of this figure.

Figure 5
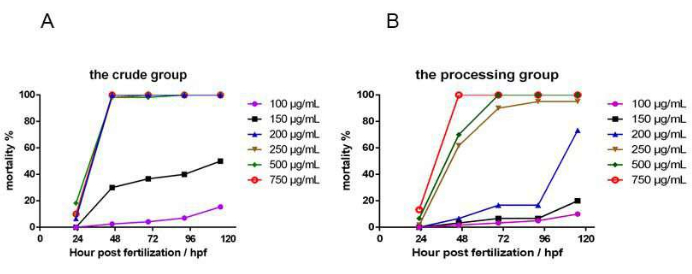
Figure 5: The dosing time-dose-mortality relationship. This figure shows the dosing time-dose-mortality relationship. (A) This figure shows the dosing time-dose-mortality relationship of the crude group. (B) This figure shows the dosing time-dose-mortality relationship of the processed group. n = 40. Please click here to view a larger version of this figure.

Figure 6
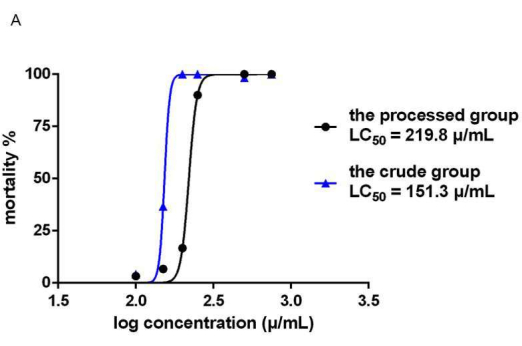
Figure 6: LC50 diagram of crude and processed EF. The LC50 diagram of the crude and processed EF is shown. The median lethal concentrations of the two experimental groups at 72 hpf were calculated. The LC50 was 151.3 µg/mL in the crude group (S) and 219.8 µg/mL in the processing group (P). n = 40. Please click here to view a larger version of this figure.

Table 1: Experimental design and the Box-Behnken response surface method results of the 17 groups of experiments. Table 1 shows the 17 groups of experiments designed by the Box-Behnken design-response surface method and their comprehensive score results. Please click here to download this Table.

Table 2: Variables used in the Box-Behnken design. The independent and dependent variables are listed here along with their low, middle, and high levels. The Box-Behnken design enabled the identification of the most influential factors in the EF processing, with the mutton oil amount (A) (15%-35%), mutton oil temperature (B) (50 °C-120 °C), and frying temperature (C) (80 °C-300 °C) as the influencing factors. Please click here to download this Table.

Table 3: Regression equations and linear ranges of the chemical constituents of EF. The results of the regression equation and linear range of the EF chemical composition show that there was good linearity between each of the concentrations of icariin, EA, EB, EC, and BI and their chromatographic peak areas. Please click here to download this Table.

Table 4: Sample recovery test rates. The average recovery rates of icariin, EA, EB, EC, and BI were 99.98%, 100.14%, 100.09%, 100.75%, and 100.94%, respectively, and the RSD% values were 0.56%, 0.78%, 0.84%, 1.10%, and 1.47%, respectively. The results show that the accuracy of the method was suitable. Please click here to download this Table.

Table 5: Regression coefficients of the predicted quadratic model. The P value of the model was P < 0.01, indicating that the model was significant. The P value of the lack of fit was P > 0.05, indicating that the lack of fit was not significant. The R2 value was 0.9300, indicating that the fit of the model was good, and the error was small, so the model was suitable for analyzing and predicting the effect of the chemical composition content of the EF stir-fried with mutton oil. In addition, A2 and D2 had significant effects on the content of processed products (P < 0.01). The influences of A and C of the one-degree term and C2 of the second-order term on the comprehensive score were significant. The one-degree term B, the second-order A2, B2, and all of the interaction items had no significant effects on the comprehensive score. The analysis of the P value showed that, of the experimental parameters, the amount of mutton oil (A) had the greatest influence on the comprehensive score, followed by the frying temperature (C), and then the temperature of the mutton oil (B). Please click here to download this Table.

List of Materials

Acetonitrile Fisher 197164
Baohuoside Equation 1 (BEquation 1 Chengdu Manst Biotechnology Co., Ltd. MUST-20042402
Chromatographic column Waters Corporation Symmetry C18
Design Expert software Stat- Ease Inc., Minneapolis, MN Trial Version8.0.6.1
Detector Waters Corporation 2998
Disintegrator Hefei Rongshida Small Household Appliance Co., Ltd. S-FS553
Electronic analytical balance Mettler-Toledo International Inc. MS205DU
Epimedin A (EA) Chengdu Manst Biotechnology Co., Ltd. MUST-21112118
Epimedin B (EB) Chengdu Manst Biotechnology Co., Ltd. MUST-20080403
Epimedin C (EC) Chengdu Manst Biotechnology Co., Ltd. MUST-20080310
Ethanol Chongqing Chuandong Chemical ( Group ) Co., Ltd. 20180801
Graphpad software GraphPad Software Inc., San Diego, CA, USA 6.02
High Performance Liquid Chromatography (HPLC) Waters Corporation 2695
Icariin Chengdu Glip Biotechnology Co., Ltd. 21091401
Methanol Chongqing Chuandong Chemical (Group) Co., Ltd. 20171101
Microporous membrane Tianjin Jinteng Experimental Equipment Co., Ltd. 0.22μm
Mutton oil Kuoshan Zhiniu Fresh Food Store 20211106
Office Excel office software Microsoft Office Excel 2021
Pharmacopoeia sieve Shaoxing Shangyu Huafeng Hardware Instrument Co., Ltd. R40/3
Pure water machine Chongqing Andersen Environmental Protection Equipment Co., Ltd. AT Sro 10A
Qualitative filter paper Shanghai Leigu Instrument Co., Ltd. 18cm
Stereomicroscope Carl Zeiss, Oberkochen, Germany Stemi 2000
Ultrasonic cleaner Branson Ultrasonics (Shanghai) Co.,Ltd. BUG25-12
Zebrafish China Zebrafish Resource Center (CZRC) The AB strain

Lab Prep

As a traditional Chinese medicine (TCM), Epimedii folium (EF) has a history in medicine and food that is > 2,000 years old. Clinically, EF processed with mutton oil is often used as a medicine. In recent years, reports of safety risks and adverse reactions of products that use EF as a raw material have gradually increased. Processing can effectively improve the safety of TCM. According to TCM theory, mutton-oil processing can reduce the toxicity of EF and enhance its tonifying effect on the kidneys. However, there is a lack of systematic research and evaluation of EF mutton-oil processing technology. In this study, we used the Box-Behnken experimental design-response surface methodology to optimize the key parameters of the processing technology by assessing the contents of multiple components. The results showed that the optimal mutton-oil processing technology of EF was as follows: heating the mutton oil at 120 °C ± 10 °C, adding the crude EF, stir-frying it gently to 189 °C ± 10 °C until it is evenly shiny, and then removing it and cool. For every 100 kg of EF, 15 kg of mutton oil should be used. The toxicities and teratogenicities of an aqueous extract of crude and mutton-oil processed EF were compared in a zebrafish embryo developmental model. The results showed that the crude herb group was more likely to cause zebrafish deformities, and its half-maximal lethal EF concentration was lower. In conclusion, the optimized mutton-oil processing technology was stable and reliable, with good repeatability. At a certain dose, the aqueous extract of EF was toxic to the development of zebrafish embryos, and the toxicity was stronger for the crude drug than for the processed drug. The results showed that mutton-oil processing reduced the toxicity of crude EF. These findings can be used to improve the quality, uniformity, and clinical safety of mutton oil-processed EF.

As a traditional Chinese medicine (TCM), Epimedii folium (EF) has a history in medicine and food that is > 2,000 years old. Clinically, EF processed with mutton oil is often used as a medicine. In recent years, reports of safety risks and adverse reactions of products that use EF as a raw material have gradually increased. Processing can effectively improve the safety of TCM. According to TCM theory, mutton-oil processing can reduce the toxicity of EF and enhance its tonifying effect on the kidneys. However, there is a lack of systematic research and evaluation of EF mutton-oil processing technology. In this study, we used the Box-Behnken experimental design-response surface methodology to optimize the key parameters of the processing technology by assessing the contents of multiple components. The results showed that the optimal mutton-oil processing technology of EF was as follows: heating the mutton oil at 120 °C ± 10 °C, adding the crude EF, stir-frying it gently to 189 °C ± 10 °C until it is evenly shiny, and then removing it and cool. For every 100 kg of EF, 15 kg of mutton oil should be used. The toxicities and teratogenicities of an aqueous extract of crude and mutton-oil processed EF were compared in a zebrafish embryo developmental model. The results showed that the crude herb group was more likely to cause zebrafish deformities, and its half-maximal lethal EF concentration was lower. In conclusion, the optimized mutton-oil processing technology was stable and reliable, with good repeatability. At a certain dose, the aqueous extract of EF was toxic to the development of zebrafish embryos, and the toxicity was stronger for the crude drug than for the processed drug. The results showed that mutton-oil processing reduced the toxicity of crude EF. These findings can be used to improve the quality, uniformity, and clinical safety of mutton oil-processed EF.

Procedura

As a traditional Chinese medicine (TCM), Epimedii folium (EF) has a history in medicine and food that is > 2,000 years old. Clinically, EF processed with mutton oil is often used as a medicine. In recent years, reports of safety risks and adverse reactions of products that use EF as a raw material have gradually increased. Processing can effectively improve the safety of TCM. According to TCM theory, mutton-oil processing can reduce the toxicity of EF and enhance its tonifying effect on the kidneys. However, there is a lack of systematic research and evaluation of EF mutton-oil processing technology. In this study, we used the Box-Behnken experimental design-response surface methodology to optimize the key parameters of the processing technology by assessing the contents of multiple components. The results showed that the optimal mutton-oil processing technology of EF was as follows: heating the mutton oil at 120 °C ± 10 °C, adding the crude EF, stir-frying it gently to 189 °C ± 10 °C until it is evenly shiny, and then removing it and cool. For every 100 kg of EF, 15 kg of mutton oil should be used. The toxicities and teratogenicities of an aqueous extract of crude and mutton-oil processed EF were compared in a zebrafish embryo developmental model. The results showed that the crude herb group was more likely to cause zebrafish deformities, and its half-maximal lethal EF concentration was lower. In conclusion, the optimized mutton-oil processing technology was stable and reliable, with good repeatability. At a certain dose, the aqueous extract of EF was toxic to the development of zebrafish embryos, and the toxicity was stronger for the crude drug than for the processed drug. The results showed that mutton-oil processing reduced the toxicity of crude EF. These findings can be used to improve the quality, uniformity, and clinical safety of mutton oil-processed EF.

Tags