The procedures for the care and use of animals were approved by the Ethics Committee of Mianyang Normal University, and all relevant institutional and governmental regulations concerning the ethical use of animals were strictly followed. For the present study, SPF rats (Kunming species, both male and female, weighing 180-220 g) were utilized. The animals were obtained from a commercial source (see Table of Materials). All animals were housed in a pathogen-free environment and provided ad libitum access to food.
1. Preparation of reagents
2. Grouping and administration
3. Pathological section of gastric wall
4. Determination of serum gastrointestinal hormones
5. Fecal total DNA extraction and PCR amplification and purification
6. Sequencing
NOTE: Step 6 and step 7 are performed following previously published methods20,21.
7. Processing of sequencing data
8. Statistical analysis
The results of the pathological section of the stomach wall are depicted in Figure 1. In comparison to Group C, Group M exhibited mild gastric wall atrophy and mild inflammation. However, when compared to Group M, Group T showed no evident inflammation, intestinal metaplasia, or atrophy. This suggests that D. caudatum decoction can effectively improve gastritis.
The serum gastrointestinal hormone assay results are presented in Figure 2. The content of malondialdehyde (MDA) was significantly higher in Group M than in Group C. After treatment with D. caudatum decoction, it was significantly reduced. Regarding the content of gastrin (GAS), Group M showed significantly lower levels than Group C, but Group T exhibited a significant increase. These results indicate that D. caudatum decoction may regulate the level of gastrointestinal hormones to treat gastritis.
Alpha diversity analysis, as shown in Table 1 and Figure 3, reveals a significant difference between the communities of Group M and Group T. The number of bacteria in Group C and Group T is higher than that in Group M, suggesting that the number and types of intestinal bacteria in rats gradually tend to a normal level after treatment.
Species composition analysis
According to Figure 4A, the community barplot illustrates that Lactobacillus and norank_f__Muribaculaceae account for the largest proportion in Group C. Group M contains a higher abundance of Clostridium_sensu_stricto_1 and some Helicobacter. The community composition of Group T is more similar to that of Group C, with important components being Lactobacillus and Romboutsia. Additionally, the Spearman correlation heatmap (Figure 4B) combined with the circos diagram (Figure 4C) reveals significant differences in flora composition between Group C and Group M, with distinct variations in dominant flora. After treatment, Group T tends to return to a normal flora state. Furthermore, Figure 5 indicates extreme differences in community composition between Group M and Group C, with significant changes occurring in the structure and composition of intestinal flora in rats with gastritis. After treatment, there are similarities in flora composition between Group C and Group T, as well as some similarities between Group T and Group M. These results indicate that D. caudatum decoction could restore the intestinal flora of rats with gastritis to a normal or close-to-normal state.
Species difference analysis
From the multi-species comparison column chart in Figure 6A, it can be observed that Norank_f_Muribaculaceae is abundant in Group C and significantly differs from Group M and Group T. After treatment, the number of Norank_f_Muribaculaceae in Group T shows an increasing trend. Additionally, Clostridium_sensu_stricto_1, abundant in Group M, exhibits resilience in harsh environments. After treatment, the number decreases significantly, suggesting that D. caudatum decoction improves the survival environment of intestinal flora to some extent. On the other hand, the LEfSe multi-level species hierarchy tree analysis in Figure 6B indicates 44 species with significant differences between groups. Norank_f_muribaculaceae, Clostridium_sensu_stricto_1, and Romboutsia were found to be abundant in Group C, Group M, and Group T, respectively.
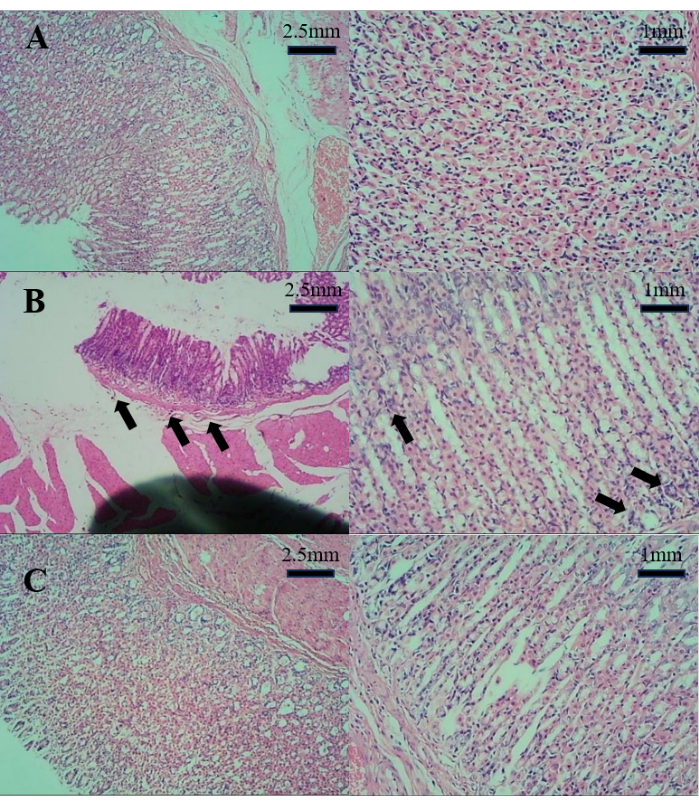
Figure 1: The results of the pathological section of the stomach wall. (A) Pathological section of the stomach in Group C. (B) Pathological section of the stomach in Group M. (C) Pathological section of the stomach in Group T. Please click here to view a larger version of this figure.
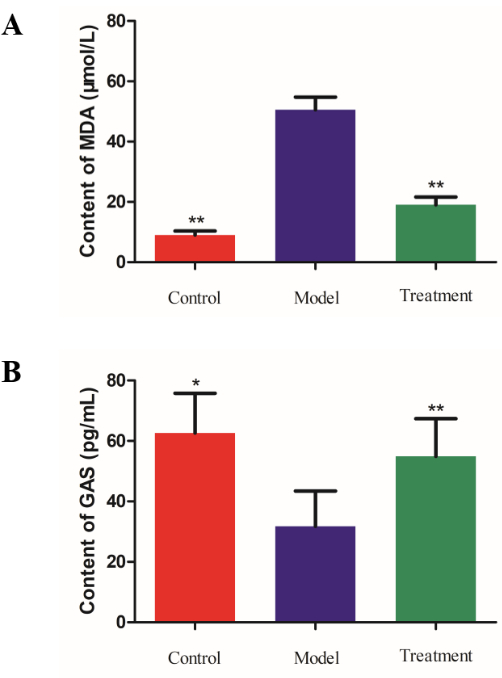
Figure 2: The contents of serum gastrointestinal hormones. (A) Bar analysis chart of MDA (malondialdehyde) determination results. (B) Bar analysis chart of GAS determination results. *P < 0.05, **P < 0.01. Please click here to view a larger version of this figure.
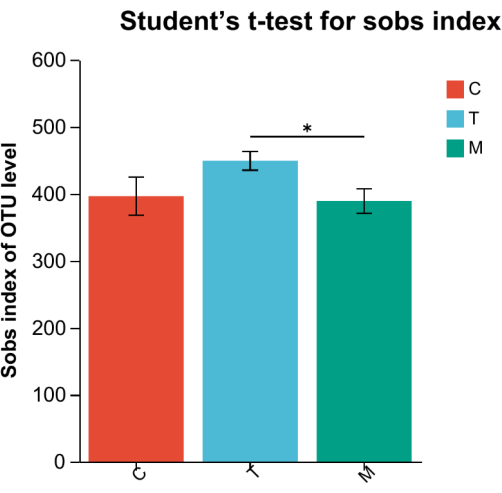
Figure 3: Column gram of diversity index T. Red bar represents Group C, blue represents Group T, while green represents Group M.*P < 0.05, **P < 0.01. Please click here to view a larger version of this figure.
Figure 4: Community composition analysis. (A) Community histogram analysis. (B) Community heatmap analysis on the level of Genus. (C) Circos diagram analysis of relationship between samples and species. Please click here to view a larger version of this figure.
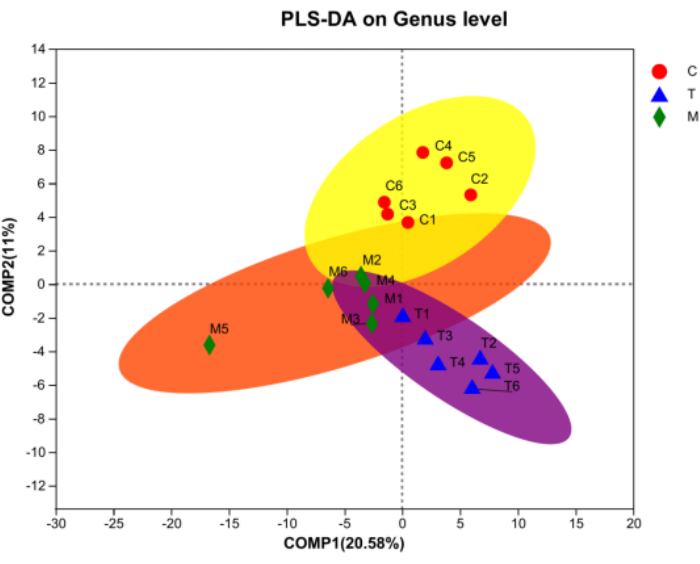
Figure 5: PLS-DA analysis on the level of Genus. Red represents Group C, blue represents Group T, and green represents Group M. Please click here to view a larger version of this figure.
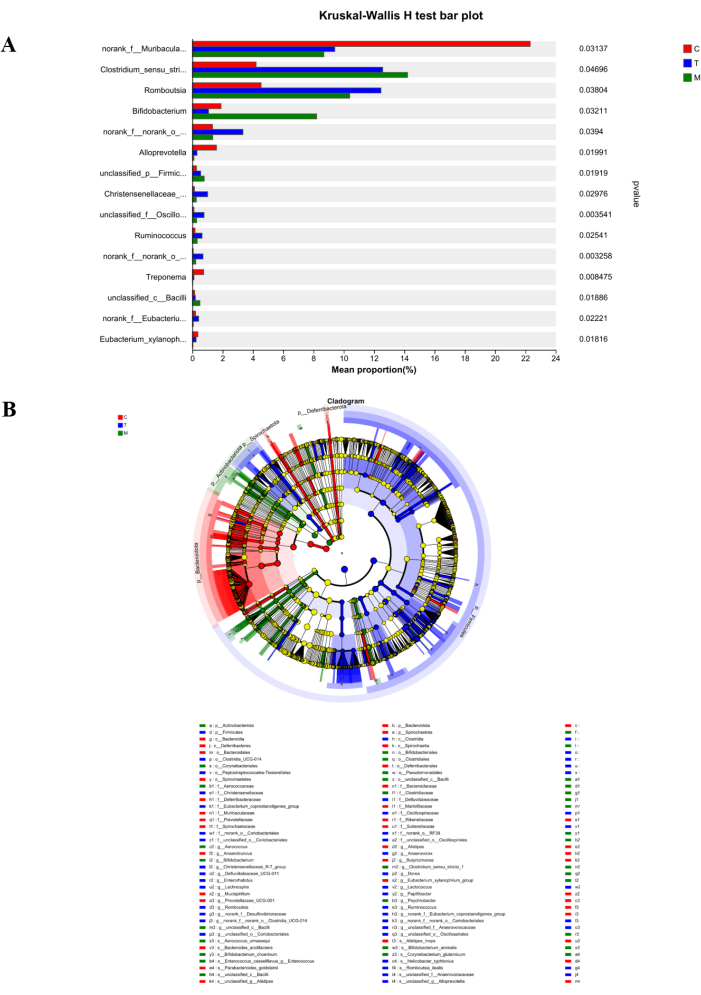
Figure 6: Species difference analysis. (A) Kruskal-Wallis H test bar plot. (B) Tree map of LefSe multi-level species. Red represents Group C, blue represents Group T, and green represents Group M. Please click here to view a larger version of this figure.
Group | Mean value | Standard deviation |
C | 3.5201 | 0.63641 |
M | 3.2755 | 0.28494 |
T | 3.5388 | 0.29945 |
Table 1: Alpha diversity index results.
Alpha diversity analysis | Mothur 1.30.2 | ||
AxyPrep deoxyribonucleic acid (DNA) gel extraction kit | Axygen Biosciences | AP-GX-50 | |
Beta diversity analysis | Qiime 1.9.1 | ||
Cryogenic refrigerator | Forma-86C ULT freezer | ||
Desmodium caudatum | The Traditional Chinese Medicine Hospital of Beichuan Qiang Autonomous County | ||
E.Z.N.A. soil kit | Omega Bio-tek | D5625-01 | |
Illumina MiSeq Platform | Illumina Miseq PE300/NovaSeq PE250 | ||
Multiskan Spectrum | spectraMax i3 | ||
OTU clustering | Uparse 7.0.1090 | ||
OTU statistics | Usearch 7.0 | ||
PCR instrument | TransGen AP221-02 | ||
PCR instrument | ABI GeneAmp 9700 | ||
QuantiFluor-ST double-stranded DNA (dsDNA) system | Promega Corp. | ||
Sequence classification annotation | RDP Classifier 2.11 | ||
Sodium salicylate | Sichuan Xilong Chemical Co., Ltd | 54-21-7 | |
SPF rats | Chengdu Dashuo Experimental Animal Co., Ltd | ||
SPSS 18.0 | IBM |
In order to preliminarily explore the effects of Desmodium caudatum on gastritis and intestinal flora in rats, a chronic gastritis rat model was established using the classic sodium salicylate method. Eighteen SPF rats were divided into three groups: the control group (Group C), the model group (Group M), and the treatment group (Group T). Pathological sections of the gastric wall were taken from rats in each group. Furthermore, the concentrations of gastrin and malondialdehyde in the serum of rats in each group were determined by ELISA. Additionally, the effects of D. caudatum on the intestinal flora of rats with gastritis were explored through a detailed comparison of gut bacterial communities in the three groups, employing Illumina-based 16S rRNA gene sequencing. The results indicated that D. caudatum decoction could reduce the malondialdehyde content and increase the gastrin content. Moreover, D. caudatum decoction was found to enhance the diversity and abundance of intestinal flora, exerting a positive impact on the treatment of gastritis by regulating and restoring the intestinal flora.