An Improved Mechanical Testing Method to Assess Bone-implant Anchorage
Summary
An improved method to mechanically test bone anchorage to candidate implant surfaces is presented. This method allows for alignment of the disruption force exactly perpendicular, or parallel, to the plane of the implant surface, and provides an accurate means to direct the disruption forces to an exact peri-implant region.
Abstract
Recent advances in material science have led to a substantial increase in the topographical complexity of implant surfaces, both on a micro- and a nano-scale. As such, traditional methods of describing implant surfaces - namely numerical determinants of surface roughness - are inadequate for predicting in vivo performance. Biomechanical testing provides an accurate and comparative platform to analyze the performance of biomaterial surfaces. An improved mechanical testing method to test the anchorage of bone to candidate implant surfaces is presented. The method is applicable to both early and later stages of healing and can be employed for any range of chemically or mechanically modified surfaces - but not smooth surfaces. Custom rectangular implants are placed bilaterally in the distal femora of male Wistar rats and collected with the surrounding bone. Test specimens are prepared and potted using a novel breakaway mold and the disruption test is conducted using a mechanical testing machine. This method allows for alignment of the disruption force exactly perpendicular, or parallel, to the plane of the implant surface, and provides an accurate and reproducible means for isolating an exact peri-implant region for testing.
Introduction
Assessing anchorage of bone to endosseous implant surfaces has been the focus of considerable attention, for which many mechanical testing methods have been described1,2. All such methods impose a force to disrupt the bone/implant model being employed, and can be broadly grouped into shear, generally presented as push-out or pull-out models3,4, reverse torque3,5, and tensile types6,7. Commonly in such tests, either bone8 or implant material (in the case of brittle glasses and ceramics9,10) is fractured and, assuming some form of anchorage has occurred, the bone/implant interface remains (at least partially) intact. Such experimental outcomes mean not only that the force required to cause the fracture (or disruption) of the model is not the force required to separate the bone/implant interface11,12, but also that the complex surface area of the created fracture plane can be refractory to accurate measurement. Nevertheless, such tests can be clinically relevant, since they provide a comparative gauge of the ability of implants of differing surface designs to be anchored in bone. However, it should also be noted that such comparisons are only valid within an experimental model, while comparisons between experimental models are fraught with difficulty since investigators use different animal species exhibiting either lamellar or woven bone; trabecular or cortical bone healing models, and different mechanical test geometries and conditions.
In an effort to derive a measurement of the tensile strength of the bone/implant interface, many investigators have used the nominal surface area of the implant to derive a "tensile strength" value, since tensile strength is measured as force per unit area. This is clearly an approximation given, as explained above, that the bone/implant interface remains intact in many of the disruption tests employed. In addition measuring the surface area of implants, particularly topographically complex surfaces, is limited by the resolution of the measurement technique as discussed by Ronald et al.13 However, as reviewed by Brunski et al.2, when the nominal surface area of an implant is taken into account, apparent differences in "tensile strength" associated with different implant surface designs are negated, suggesting that implant surfaces with higher surface area provide larger areas of bone/implant contact and thus require more force to fracture the model. The implication therefore is that more topographically complex surfaces can increase contact osteogenesis, which results in greater bone implant contact (BIC) and resultant higher disruption values in mechanical tests. Contact osteogenesis is the product of two distinct phenomena: osteoconduction and bone formation. Indeed, we have shown that increases in osteoconduction on topographically complex surfaces can be quantified by measuring the resultant BIC14, and that such surfaces also result in higher mechanical disruption values12.
However, it is salutary to note that peri-implant bone can form by two mechanisms. In contact osteogenesis cells of mesenchymal origin migrate to the implant surface (osteoconduction), differentiate into bone cells, and elaborate de novo bone matrix on the implant surface (bone formation). The first bony matrix elaborated is a mineralized cement line as seen in normal bone remodeling15 (there is much confusion in the literature concerning this mineralized biological structure that is sometimes thought to be un-mineralized1 or is syncretized with all interfaces in bone16 - for a full discussion on this topic see Davies and Hosseini17). Contact osteogenesis is an essential prerequisite for the phenomenon of bone-bonding, but is nonessential for bone ingrowth18. The mineralized cement line of bone is mechanically weaker than the mineralized collagen compartment of bone19. Thus, intuitively, if the interdigitation of cement line matrix with implant nano features is compared with bone tissue in growth into macro implant features then the mechanical force required to disrupt the former would, reasonably, be expected to be less than the latter, and we have recently demonstrated this experimentally12.
Peri-implant bone can also form by distance osteogenesis. In this case, bone is deposited on the old bone surface and gets progressively closer to the implant surface resulting in an interface comprising amorphous matrix and the remains of osteogenic cells20. In general, distance osteogenesis is associated with smooth, or machined, endosseous implant surfaces and is often seen in cortical bone healing, while microtopographically complex surfaces are associated with contact osteogenesis that is more typical of trabecular bone healing. Tensile test models using smooth implant surfaces and cortical bone healing have been able to test the adhesive properties of this amorphous biological matrix absent of the contact osteogenesis associated with topographically complex surfaces, and have shown that the so called “biochemical” bonding that occurs provides a minor component of the “tensile strength” values reported with topographically complex surfaces21. On the contrary, using a trabecular bone healing model, Wong et al.22 showed “an excellent correlation” between implant surface roughness and push-out failure load, and indicated that chemical bonding indeed played a negligible role in anchorage of bone to the implant surface. While it is probable that both contact and distance osteogenesis occur, to differing degrees, in all endosseous peri-implant healing compartments, microtopographically complex surfaces have shown themselves to be particularly advantageous in trabecular bony healing compartments23. The latter are classified as Class III or Class IV bone in the dental literature24.
Our purpose has been to focus on the mechanisms of contact osteogenesis and the resultant bone/implant anchorage that can ensue in a trabecular bone healing environment. This anchorage, which is dependent on the topography of the implant surface (see above), can occur at different scale-ranges. On the one hand, only submicron implant features are implicated in bone-bonding - as described by interdigitation of the bony cement line matrix with such surfaces, and seen on bioactive glasses, ceramics and reticulate metal oxides. On the other, bone tissue (sometimes complete with blood vasculature) can grow into multi-micron, or macro-scale, features of implant surfaces18. Both cases result in a form of bone anchorage to the implant surface, although the mechanisms are clearly different. However, a common failing of the majority of mechanical testing methods referenced above is to align the disruption force in an exactly perpendicular, or parallel plane to that of the implant surface (depending on whether tensile or shear mode is employed). We report herein a method that overcomes this limitation.
Protocol
1. Implant Design, Fabrication, and Surface Treatment
- Manufacture rectangular implants (dimensions 4 mm x 2.5 mm x 1.3 mm; length x width x height) from commercially pure titanium (cpTi). Drill a hole centrally down the long axis of the implant (diameter = 0.7 mm) to facilitate early implant stability within the surgical site and subsequent mechanical testing (Figure 1).
- Treat the upper and lower surfaces of the implant.
- To create two distinct surfaces, use a standard grit-blasting (GB) treatment to create a microtopographically complex surface. Further modify half of the implants by superimposing calcium phosphate (CaP) nanoparticles to create a nanotopographically complex surface.
Note: Various chemical or mechanical treatments can be applied to create a desired surface topography and/or chemistry, and these will depend upon the nature of the experimental question to be addressed. In the example provided herein, one group of commercially pure titanium (cpTi) implants was subjected to grit-blasting (GB) - a subtractive process - to create a complex microtopography. Half of the implants were then further modified by the addition of calcium phosphate (CaP) nanocrystals to create a super imposed nanotopography (GB-DCD).
Note: When viewing the grit-blasted micro-surface, compared to the modified nano-surface, at 10,000X magnification, there is no obvious difference in surface characteristics. However, when viewed at 100,000X magnification, differences become quite obvious (Figure 2). It has been previously shown that such surface changes have profound effects on osteoconduction14.
2. Animal Model and Surgical Procedure
- Use young male Wistar rats (200-250 g) for this model. All procedures must be approved by local animal care committees. Allow animals free access to water and rat chow.
Note: Wistar rats were selected for this procedure due to prior experience with this strain of rat, although other strains of rat could be employed. Access to food and water can be altered, depending on the nature of the experimental question being addressed. - Sedate rats using inhalation anesthesia administered through a nose cone: 4% isoflurane in 1 L O2/min for induction; 2% isoflurane in 1 L nitrous oxide and 0.6 L O2/min for maintenance. Conduct a standard toe-pinch test to ensure effective sedation before continuing with the procedure.
- Administer analgesic pre- and post-operatively through a subcutaneous injection of 0.01-0.05 mg/kg buprenorphine.
- Assign implants by partial randomization and place bilaterally in the distal metaphyses of rat femora. This allows a different implant, one each from a selection of different surface topographies to be compared, in contralateral femora, to optimize statistical analysis.
- Prepare the animals by shaving and cleaning the antero-lateral aspect of each hind leg with 10% Betadine. To prevent hypothermia, place a warm water circulation pad underneath the anesthetized rat.
- Using a #15 surgical scalpel, make an incision through the skin along the lateral aspect of the thigh to expose the muscle. Expose the distal femur using blunt dissection to deflect the muscle bodies in a minimally invasive manner.
- Scrape away the thin layer of periosteum overlying the femur, using a periosteal elevator, to fully expose the cortical bone for drilling. Care must be taken not to damage the growth plate or articular cartilage of the knee joint during blunt dissection and removal of periosteum.
- Once cleaned and inspected, rotate the femur laterally to expose the anterior aspect of the distal femur (Figure 3A).
- To prepare the surgical site, drill a bicortical rectangular slot down the middle of the bone through both cortices. To avoid overheating the tissue, saline irrigation must be maintained throughout drilling by a surgical assistant. Conduct the drilling in three stages:
- First, drill through the anterior cortex, exposed by dissection, using a 1.3 mm dental burr attached to a dental hand piece to create two holes 2.5 mm apart along the mid line of the femur.
- Next, use a second drill bit (twist 1.3 mm dental burr) to extend these holes through the opposing cortex, resulting in bicortical parallel holes.
- Finally, join the holes using a third custom side-cutting burr in a proximal-distal direction, forming the site for the implant (Figure 3B).
- Pass a biodegradable suture through the bone defect using the attached needle and return around the outer femoral cortex.
- Thread the implant over the free end of the suture and guide it into the defect, where it should be pressure-fitted. In this manner, the long axis of the implant should be oriented perpendicular to the long axis of the femur (Figure 3C).
- Tie the suture around the lateral aspect of the femur to provide implant stability during post-operative recovery and early stages of healing. Use the remaining suture to close the muscle tissue, and reoppose the cutaneous tissue using surgical staples (9 mm wound clips).
- Inspect surgical sites for signs of infection, and monitor animals daily for compromised ambulatory ability. Exclude the animals that do not fully recover ambulation, or those that have femoral fractures at sacrifice, from analysis.
3. Sample Harvesting
- Sacrifice animals at 9 days post-operative by cervical dislocation after CO2 exposure.
- Upon sacrifice, detach femora and clean of soft tissue. Store immediately in 15% sucrose buffer solution to maintain tissue hydration in preparation for mechanical testing (Figure 4A).
Note: Specimens are stored in the sucrose buffer solution to maintain tissue hydration during transport between facilities. Specimens will spend approximately 2-3 hr in solution during preparation for mechanical testing. - To prepare specimens for mechanical testing, trim the bone to the width of the implants using a cylindrical diamond burr attached to a high speed system. The final test specimens consist of two arches of bone attached to each face of the implant (Figure 4B). For arches that fall off during preparation or transportation, assign a mechanical testing value of 0 N.
Note: It is important to be very gentle and accurate when trimming the specimens, in order to avoid damaging or prestressing the interface. Bony reparative callus can grow around the long axis of the implant and even into the longitudinal hole. Such excess bone must be removed by trimming specimens to the exact dimensions of the rectangular implant, as it can skew mechanical testing results.
4. Mechanical Testing
A custom breakaway mold was designed to pot each specimen, creating a repeatable and accurate method of preparing samples for mechanical testing. The design allows for isolation of a 0.5 mm region of peri-implant bone for a consistent testing zone, while holding the specimen centered and completely horizontal during the potting process, allowing for the application of a force directly perpendicular to the implant surface. See Figure 5 for complete engineering drawings and Figure 6 for the final components.
Note: Conduct all testing using a mechanical testing apparatus, operating at a crosshead speed of 30 mm/min. For a qualitative assessment of residual bone following testing, a dissecting microscope can be used.
- Potting of the Specimens and Mechanical Testing
- Remove specimens from the sucrose buffer solution and gently blot dry.
- Position specimen in the custom mold. Slide the pin horizontally through holes in the walls of the mold and through the hole in the middle of the implant. Place the stabilizing plate on the posterior side of the mold to stabilize the implant (Figure 7).
- Fill the base of the mold with flowable dental composite and cure for 60 sec using a high intensity curing light.
Note: It is important to choose a composite that does not set with an exothermic reaction, as such heat generated may influence the tissue properties. - After curing, open the mold and remove the hardened specimen block. Draw a thin black line in permanent marker on the lateral arch for identification purposes.
- Fix a prefabricated replica of the test specimen in a vice, and center the unit on the base of the mechanical testing instrument.
- Secure the specimen into vice and pass a nylon line through the hole in the implant (Figure 8). Attach the loose ends to the center of the moving crosshead. For consistency, always label and test the lateral side first. Repeat the process with the medial arch.
Representative Results
All animals increased their ambulatory activity with time following their recovery from surgery. This is important because load has differential effects on topographies of different scale ranges, as we have recently reported12. A representative force/displacement curve for test specimens following mechanical testing is presented in Figure 9A, and the averaged data for each implant surface is presented in Figure 9B. The maximum force value achieved by each specimen was recorded and group values averaged for comparison (n = 28 per group). The GB-DCD surface, with submicron topographical features superimposed on the underlying microtopographically complex surface, had significantly higher disruption force values than the unmodified GB micro-surface (p < 0.0001) (Figure 9B).
Following mechanical testing, it could be observed that 92% of specimens fractured within the targeted peri-implant region (Figure 10).
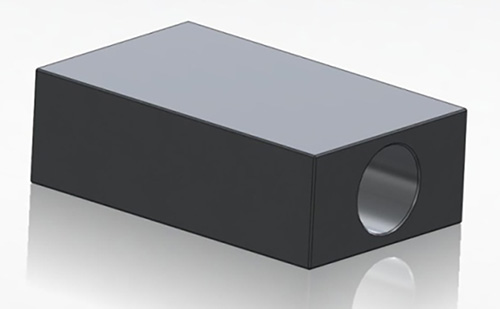
Figure 1. Custom designed rectangular implants. The top and bottom faces are the primary sites for growth and apposition. Dimensions: 4 mm x 2.5 mm x 1.3 mm (length x width x height) and hole diameter 0.7 mm.
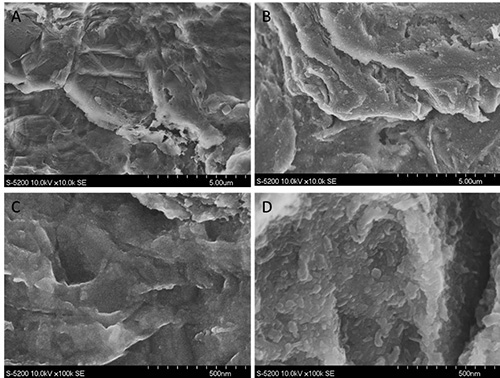
Figure 2. Field emission SEM micrographs of the implant surfaces used. Differences in topography are difficult to see at 10,000x magnification (top), but are very apparent at 100,000X (bottom). (A,C): GB and (B,D): GB-DCD samples.
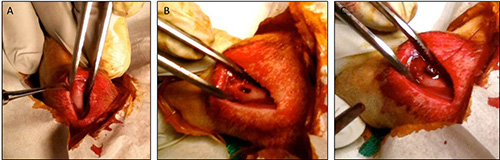
Figure 3. (A) After exposing the femur using blunt dissection and removing the periosteum, (B) a bicortical slot was created using a 3-stage drilling procedure, and (C) the implant was press-fitted into place and supported with a biodegradable suture.
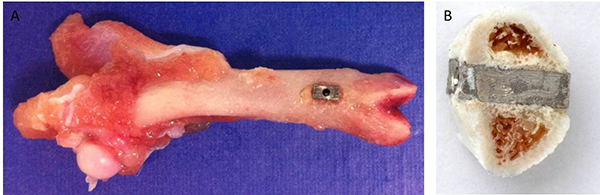
Figure 4. (A) Femora were harvested from sacrificed animals. The rectangular implant is visible in the distal femur. (B) Final test specimen with both a medial and a lateral arch on either side of the implant.
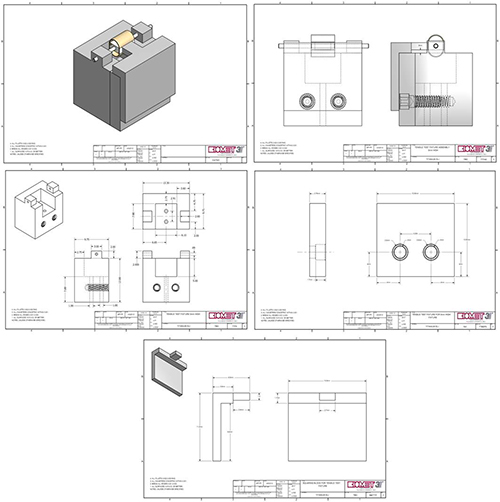
Figure 5. Technical drawings for custom breakaway mold used to pot mechanical testing specimens. Click here to view larger image.
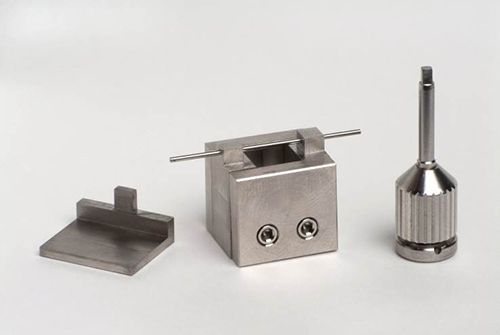
Figure 6. Custom breakaway mold design for mechanical testing.
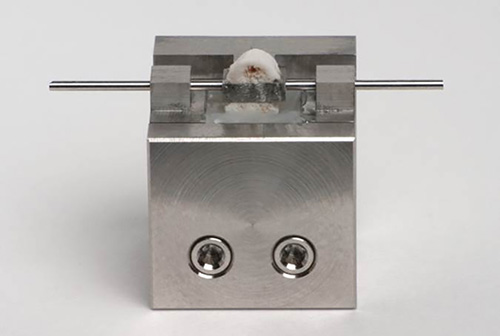
Figure 7. Specimen potted in custom mold.
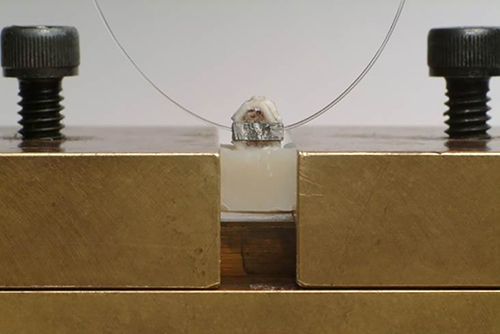
Figure 8. Specimen centered in mechanical testing instrument prior to mechanical testing.
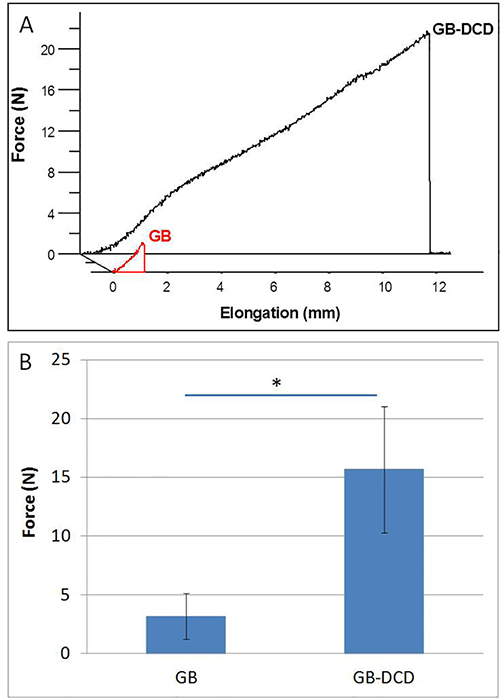
Figure 9. (A) Representative force/elongation curve generated after mechanical testing. (B) Average disruption force values (N) recorded at a crosshead speed of 30 mm/min at 9 days euthanasia time-point (n = 28 specimens per group). (*) = statistical significance.
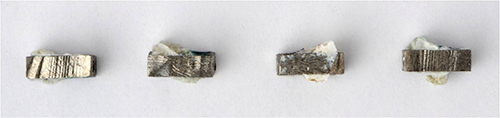
Figure 10. Breaking patterns of cortical arches around the implants following mechanical testing.
Discussion
The mechanical testing model presented here provides an improved method to assess the anchorage of bone to candidate implant surfaces, since it allows for accurate perpendicular, or parallel, alignment of the test sample with the axis of disruption force applied; and limits the fracture zone to within half a millimeter of the implant surface. The model is easily incorporated into studies comparing the effectiveness of any range of chemically, or mechanically, modified surfaces; but is not suitable for smooth surfaces as these are easily detached from bone during specimen manipulation. The implants can be manufactured from a wide range of biomaterials. Data are easily collected and, provided the mechanical testing apparatus is properly calibrated, require minimal filtering. Differing timelines can be used to assess mechanical performance at different stages of healing. Furthermore, the model can easily be employed in animal models of human disease that compromise bone healing including, for example, diabetes, radiation treatment, and autoimmune diseases.
The model has been designed for male Wistar rats, although other strains can easily be employed. The skeletal structure of rats, in particular the femur, while small, is capable of withstanding normal ambulatory loads after receiving the custom implant, and their post-operative recovery is swift. Due to the simple geometries used, the design is easy to scale up for larger animal models. While it is possible to conduct a similar operation in mice, the femora are significantly smaller, which requires the use of smaller implants and presents challenges in handling for the disruption test.
As we have previously employed a simpler version of this model in studies focused on biological mechanisms occurring during early healing points, and have employed a 9 day post-operative time-point, we used the same time-point herein. However, this time period can change depending on the study design, and multiple time points can show the progression of the anchorage phenomenon with time in vivo.
During development of the model, many fast-curing epoxies and cements were explored, many of which were inappropriate due to exothermic reactions, excessive expansion, "wicking" of the uncured solution through the trabecular bone, and highly variable curing times. The flowable dental composite chosen has minimal expansion (approximately 2%), cures quickly under the curing light, and exhibits minimal wicking. In addition, the composite exhibits no exothermic properties. This material can be changed in lieu of available materials, but it is of critical importance to rigorously test the potting agent before beginning the project.
This method yields valuable comparative biomechanical data as a function of candidate implant surface design. The main advantage of this improved method is in limiting the disruption (fracture) plane to the first 0.5 mm from the implant surface, where the reparative bone is formed. It differs from other methods where the fracture is not limited to the peri-implant zone. Thus, the method presented, as explained above, accurately isolates a defined peri-implant region - a region that is consistent throughout all specimens - while also aligning the specimen such that the applied force is exactly normal to the implant surface, eliminating any bias due to misalignment. This is particularly important if one wants to monitor the maturation of peri-implant bone with time. However, it should be emphasized that the test does not provide biomechanical information on the true bone/implant interface itself, since there is considerable bone remaining on the surface following testing.
Previously, we have used a simpler version of this method to define the ability of surface topography to render titanium surfaces bone-bonding14, as well as in recent work to delineate the biological relevance of varying grades of topographical complexity as a function of healing time12. While the simple test is faster than that presented herein, and requires no custom-designed potting device, there is considerable variance in the location of the fracture plane. In addition, the method also allows one to envision rotating the test specimen 90 degrees, such that the implant is aligned vertically on the mechanical testing instrument. In this configuration it is possible to conduct shear testing with the same experimental setup - an approach not possible with other methods.
Nevertheless, there are several practical drawbacks that represent limitations. As the test specimens are small, it can be time-consuming to align the specimen appropriately in the mold during potting relative to other methods. Furthermore, once the specimen is potted, it can be difficult to confirm, with the naked eye, the exact peri-implant region; thus it may be useful to use a magnifying glass, or jeweler’s loop to more accurately visualize the peri-implant region. Lastly, the method must be done in a manner that avoids wicking of the flowable composite through the exposed reparative trabeculae in the peri-implant region. Finally, we used a 1,000 N load cell since this is the equipment we have available, but a smaller load cell, in the 50-100 N range, would be more appropriate for future tests, allowing for greater resolution and accuracy in testing data.
Disclosures
The authors have nothing to disclose.
Acknowledgements
The authors would like to thank Biomet 3i for their continued financial support, and particularly Randy Goodman for help in the design and fabrication of the custom parts. Spencer Bell is a recipient of an Industrial Postgraduate Scholarship, provided by the National Sciences and Engineering Research Council of Canada (NSERC). We would also like to thank Dr. John Brunski for his very valuable feedback during manuscript preparation.
Materials
| Dulbecco’s Phosphate Buffer solution (DPBS) | Gibco Life Technologies, Burlington, ON, Canada | 14190-250 | |
| 10% neutral buffered formalin solution | Sigma-Aldrich Co. LLC., Canada | HT501128-4L | |
| Custom-designed rectangular implants (commercially pure titanium; dimensions: 4mm x 2.5mm x 1.3mm with a 0.7mm hole drilled centrally down the long axis) | Biomet 3i, FL, USA | N/A | |
| Custom-designed breakaway mould | Biomet 3i, FL, USA | N/A | |
| Isoflurane | Baxter Internationl Inc. | N/A | |
| Buprenorphine | Bedford Laboratories | N/A | |
| 10% betadine | Bruce Medical, MA, US | FR-2200-90 | |
| Scalpel | Almedic, Medstore, University of Toronto, Canada | 2586-M36-0100 | |
| Scalpel blade #15 (sterile) | Magna, Medstore, University of Toronto, Canada | 2586 | |
| Periosteal elevator #24G | Spectrum Surgical, OH, USA | EX7 | |
| Forceps | Almedic, Medstore, University of Toronto, Canada | 7747-A10-108 | |
| Tissue forceps | Almedic, Medstore, University of Toronto, Canada | 7722-A10-308 | |
| Scissors | Almedic, Medstore, University of Toronto | 7603-A8-240 | |
| Absorbant Fabric General Purpose Drape (sterile) | Vitality Medical | 1089 | |
| Gauze (non-sterile) | VWR | 89133-260 | |
| Needles 25G X 5/8" (disposable) | BD, Canada | 305122 | |
| Syringes (sterile) | VWR, Canada | CABD309653 | |
| Needle Driver | Almedic, Medstore, University of Toronto, Canada | A17-132 | |
| Dynarex Surgical gloves (sterile) | Amazon.com | 2475 | |
| Surgical masks | Fisherbrand, Medstore, University of Toronto, Canada | 296360759 | |
| 0.9% sterile saline | House brand, Medstore, University of Toronto, Canada | 1011-L8001 | |
| Hair clippers | Remington, US | N/A | |
| 4-0 Polysorb | Syneture | SL5627G | |
| 9mm Wound Clips | Becton Dickinson, MD, USA | 427631 | |
| ImplantMED DU 900 and WS-75 dental hand piece | W&H Dentalwerk, Austria | DU1000US | |
| 1.3 mm twist drill | Brasseler, GA, USA | 203.21.013 | |
| 1.3 mm dental burr | Biomet 3i, FL, USA | custom | |
| 1.2 mm cylindrical side-cutting burr | Biomet 3i, FL, USA | custom | |
| Cylindrical diamond burr | Brasseler, GA, USA | H1.21.014 | |
| High speed dental drilling system | Handpiece: KaVo Dental Corporation, IL, USA | N/A | |
| Handpiece Control: DCI International, OR, USA | |||
| 99.5% Ultra Pure sucrose | BioShop Canada Inc., Burlington, ON, Canada | 57-50-1 | |
| Flowable dental composite | Filtek Supreme Ultra Flowable Restorative, 3M ESPE, St Paul, Minnesota, USA | 6033XW | |
| Sapphire Plasma Arc high intensity curing light | Den-Mat Holdings, Santa Maria, CA, USA | N/A | |
| Instron 4301 with 1000 N load cell | Instron, Norwood, MA, USA | N/A | |
| Red Wolf 10lb nylon fishing line | Canadian Tire, Canada | 78-3610-6 | |
| Leica Wild M3Z Stereozoom dissecting microscope | Leica, Heerbrugg, Switzerland | N/A | |
| QImaging Micropublisher 5.0 RTV digital camera coupled with QCapture 2.90.1 acquisition software | QImaging, Surrey, BC, Canada | N/A | |
| Electronic digital caliper | Fred V. Fowler Company, Inc., Newton, MA, USA | N/A | |
| Mechanical testing instrument | Instron, Norwood, MA, USA | N/A |
References
- Brunski, J. B. In vivo bone response to biomechanical loading at the bone-dental implant interface. Adv. Dental Res. 13, 99-119 (1999).
- Brunski, J. B., Glantz, P. -. O., Helms, J. A., Nanci, A., Brånemark, P. I., Chien, S., Gröndahl, H. G., Robinson, K. . Transfer of mechanical load across the interface. In: The Osseointegration Book. , 209-249 (2005).
- Brånemark, R., Ohrnell, L. O., Nilsson, P., Thomsen, P. Biomechanical characterization of osseointegration during healing: an experimental in vivo study in the rat. Biomaterials. 18 (14), 969-978 (1997).
- Itälä, A., Koort, J., Ylänen, H. O., Hupa, M., Aro, H. T. Biologic significance of surface microroughing in bone incorporation of porous bioactive glass implants. J. Biomed. Mater. Res. A. 67 (2), 496-503 (2003).
- Brånemark, R., Emanuelsson, L., Palmquist, A., Thomsen, P. Bone response to laser-induced micro- and nano-size titanium surface features. Nanomedicine. 7 (2), 220-227 (2011).
- Kato, H., et al. Bonding of Alkali- and Heat-Treated Tantalum Implants to Bone. J. Biomed. Mater. Res. 53, 28-35 (2000).
- Hong, L., Xu, H. C., de Groot, K. Tensile strength of the interface between hydroxyapatite and bone. J. Biomed. Mater. 26 (1), 7-18 (1992).
- Currey, J. D. Mechanical properties of bone tissues with greatly different functions. J. Biomech. 9 (12), 313-319 (1979).
- Nakamura, T., Yamamuro, T., Higashi, S., Kokubo, T., Itoo, S. A new glass-ceramic for bone replacement: evaluation of its bonding to bone tissue. J. Biomed. Mater. Res. 19 (6), 685-698 (1985).
- Hench, L. L., Splinter, R. J., Allen, W. C., Greenlee, T. K. Bonding mechanisms at the interface of ceramic prosthetic materials. J. Biomed. Mater. Res. Symp. 1, 117-141 (1972).
- Edwards, J. T., Brunski, J. B., Higuchi, H. W. Mechanical and morphologic investigation of the tensile strength of a bone-hydroxyapatite interface. J. Biomed. Mater. Res. 36 (4), 454-468 (1997).
- Davies, J. E., Ajami, E., Moineddin, R., Mendes, V. C. The roles of different scale ranges of surface implant topography on the stability of the bone/implant interface. Biomaterials. 34, 3535-3546 (2013).
- Rønold, H. J., Lyngstadaasb, S. P., Ellingsen, J. E. Analysing the optimal value for titanium implant roughness in bone attachment using a tensile test. Biomaterials. 24, 4559-4564 (2003).
- Mendes, V. C., Moineddin, R., Davies, J. E. The effect of discrete calcium phosphate nanocrystals on bone-bonding to titanium surfaces. Biomaterials. 28 (32), 4748-4755 (2007).
- Skedros, J. G., Holmes, J. L., Vajda, E. G., Bloebaum, R. D. Cement lines of secondary osteons in human bone are not mineral deficient: new data in a historical perspective. Anat Rec. 286, 781-803 (2005).
- McKee, M. D., Nanci, A. Osteopontin and the bone remodelling sequence: colloidal-gold immunocytochemistry of an interfacial extracellular matrix protein. Ann. N.Y. Acad. Sci. 760, 177-189 (1995).
- Davies, J. E., Hosseini, M. M., Davies, J. E. . Histodynamics of endosseous wound healing In: Bone Engineering. , 1-14 (2000).
- Welsh, R. P., Pilliar, R. M., Macnab, I. Surgical implants. The role of surface porosity in fixation to bone and acrylic. J. Bone Joint Surg. Am. 53 (5), 963-977 (1971).
- O’Brien, F. J., Taylor, D., Clive, L. T. The effect of bone microstructure on the initiation and growth of microcracks. J. Orthop. Res. 23 (2), 475-480 (2005).
- Steflik, , et al. Ultrastructural analyses of the attachment (bonding) zone between bone and implanted biomaterials. J. Biomed. Mater. Res. 39 (4), 611-620 (1998).
- Sul, Y. -. T., Johansson, C., Albrektsson, T. A novel in vivo method for quantifying the interfacial biochemical bond strength of bone implants. J. Royal Soc. 7 (42), 81-90 (2010).
- Wong, M., et al. Effect of surface topography on the osseointegration of implant materials in trabecular bone. J. Biomed. Mater. Res. 29 (12), 1567-1575 (1995).
- Gotfredsen, K., et al. Anchorage of titanium implants with different surface characteristics: an experimental study in rabbits. Clin. Implant Dent. Relat. Res. 2 (3), 120-128 (2000).
- Lekholm, U., Zarb, G. A., Albrektsson, T. . Patient selection and preparation. In: Tissue integrated prostheses. , 199-209 (1985).
