Allergen challenge:
- C57BL/6 mice, 4-8 weeks of age, are anesthetized in an airtight plexiglass chamber purged with a 3.2% isoflurane in oxygen vapor mixture for 10 minutes to achieve deep general anesthesia.
- Intranasal allergen challenges (45μL OVA (22.5 μg) and 7μL A. Oryzae (7 μg), in PBS) are administered, every Tuesday, Thursday and Sunday, for a total of seven consecutive applications.
Anesthesia:
- Prior to each allergen challenge, and following the 7th challenge, mice are administered an intraperitoneal injection of 48 mg/kg etomidate (2 mg/ml), prior to placement in a light-excluding receptacle.
- Subject remains in receptacle until a lack of observable neurological response is detected upon application of pressure to hind paws (5-10 min).
Intubation:
- A radiant heat lamp, maintained at a distance to ensure maintenance of ~37°C body core temperature, should be focused on the subject throughout the procedure to prevent hypothermia. A rectal thermometer should be used at least initially to confirm euthermia regardless of the heat source used.
CRITICAL STEPS All fluids and instruments received by experimental animals should be sterile; procedures should be performed under strict aseptic conditions. Prolonged hypothermia while under anesthesia will lead to aberrant data and/or death of animals. Competence with all invasive procedures should be developed using cadaveric animals before attempting work on live animals. Ophthalmic lubricant should be used to prevent corneal abrasions of animals under general anesthesia. - Anesthetized mice are removed from receptacle and placed in the recumbent position (ventral side up), on plethysmograph table, adjusted to a 45° angle.
- A rubber band encircling the table is inserted behind the top row of incisors so to secure the subject into place. With tweezers in right hand, grip, extend, and lift the tongue from the mouth before securing it in place with a metal depressor in left hand; thus allowing an unimpeded airway for intubation.
- A 0.8 mm diameter fiberoptic thread, connected to a light source, is inserted through the angiocatheter and extended 10 mm beyond the tip. As the depressor is steadied with left hand, the illuminated end of the fiberoptic thread is guided through the oral cavity and pharynx by the right hand until the vocal chords are visualized. The thread is then passed under direct visualization through the moving vocal cords and into the trachea, timed to occur when the cords are maximally open.
- The angiocatheter is then passed over the fiberoptic thread into the trachea until the catheter tip lies within the mid-portion of the trachea. For 17-22 gram mice, this corresponds to a 10 mm catheter segment remaining visible between the connector and the cranial extreme of the subject s lower jaw. The actual amount by which the catheter is passed should be determined by direct inspection of the trachea of 2-3 catheterized mice of the relevant size and genetic background.
- The fiberoptic thread is removed and successful intubation is confirmed by observing regular deep breaths (rhythmic excursions of the thorax and abdomen) which immediately terminate following occlusion of the connector with the thumb. A choking response, regardless of thumb-occlusion, irregular breaths, or other signs of difficulty breathing are indicative of angiocatheter malpositioning and usually indicate esophageal intubation.
CRITICAL STEP Failure to quickly reverse an esophageal intubation can be lethal. If esophageal intubation is suspected, the catheter should be quickly removed and reinserted once the animal has resumed a normal breathing pattern. Etomidate is the anesthetic of choice as, of all available rodent anesthetics, this agent provokes the least cardiovascular toxicity (hypotension, arrhythmia, cardiac arrest). - Lower plethysmograph table until parallel with the work bench and turn subject 180° until facing air ventilator port. Turn animal on its side before connecting to the ventilator.
- A successful intubation is further confirmed when, after securing an air-tight connection and activating the ventilator (functioning at 150 breaths/minute, 9 ml/g tidal volume, 100% oxygen), thoracoabdominal excursion is seen to pace with the ventilator.
Intravenous line:
- A 10 mm, 27ga needle is removed from its syringe-connector by way of melting it free, and bending the needle 90° at the midpoint using sterile forceps and hemostat so that the bevel faces into the angle. The non-beveled end is connected to the PE10 tubing leading to the IV injection port.
- To prevent potentially fatal air embolization, the tubing and needle are purged with 37°C, 0.9% NaCl via the 1 ml syringe. The injection port consists of a 27ga needle, pushed through a hole drilled into the cap of a 15ml centrifuge tube. The cap is filled with saline such that the end of the needle is constantly submerged, thus reducing the likelihood that air will be entrained in the needle and injected intravenously.
- With the mouse remaining under the heat lamp, the needle is aligned at the caudal extreme of the tail parallel to and over the lateral vein. The needle is run slightly beneath the skin, while directed cranially along the vein s length and pushed subcutaneously to the bend. Successful IV placement is confirmed by observing blood backflow into the IV tubing with slight pulling of the syringe plunger. Furthermore, there should be unimpeded flow through the IV line upon injection of 50-100 μl saline into the tail vein. Occasional tail veins cannot be stably cannulated. In these instances, the mouse can be rotated 180 degrees to the other side and the other tail IV usually accessed without difficulty.
- After removing the heat lamp from the setup, the subject is enclosed in the plethysmograph, thereafter secured as air-tight with the application of 4 clamps.
CRITICAL STEP Allowing the heat lamp to remain on will heat the air in the plethysmograph chamber and potentially alter subsequent measurements of RRS Sterility of i.v. needles and solutions must be maintained. Sterilization of needles is accomplished by immersing and flushing with 70% ethanol followed by rinsing and flushing with sterile saline solution prior to i.v. insertion. Moreover, the tail should be cleaned with 70% ethanol or isopropyl alcohol prior to i.v. insertion.
Airway resistance measurements:
- Peak resistance is determined by continuous quantitation of the quotient DPt/V (where DPt is the change in the tracheal pressure and V is air flow) at points of equal lung volume (70% tidal volume). DPt is determined by using a pressure transducer connected to the tracheal angiocatheter. To determine V, plethysmograph pressure variations are calibrated to changes in volume over the physiologic ranges studied. The differential of plethysmograph volume over time, as computed by the preamp module, is V. After establishing a stable baseline RRS (<5% variation over 3 minutes), five successive doses (volume = 2 μl/g body weight) of increasing concentrations of acetylcholine chloride (0.058, 0.18, 0.59, 1.58 and 5.8 mg/kg of body weight, in 0.9% saline at pH 7.4, maintained on ice and hand-warmed prior to each injection) are injected over one second via the i.v., with each subsequent dose administered upon return of RRS to baseline, until a tripling of baseline resistance (approximately 12 cm H2O x ml-1 x sec, i.e., a 200% increase in airway resistance above the typical baseline of approximately 4 cm H2O x ml-1 x sec) is achieved. The provocative concentration of Ach, in mg/g of body weight, that causes a 200% increase in RRS from baseline values (termed PC200), is computed by mathematical interpolation of the Ach-RRS dose-response curves.
- Once PC200 values have been reached, release fasteners, and dismantle the plethysmograph. A maximum of 5 increasing doses of Ach is given. The Ach concentration range given above is suitable for achieving PC200 values for most naive mouse strains.
CRITICAL STEP When a baseline of approximately 4 cm H2O x ml-1 x sec is established on the resistance monitor for 30 seconds, a 60 μL of normal saline can be injected i.v. to confirm that the appropriate plane of anesthesia has been achieved. With complete anesthesia, there will be no significant change in resistance; an increase in resistance or movement of limbs or tail represents a sign of physical distress and indicates the need for additional anesthetic. - Remove IV from the tail vein and then disconnect the animal from the ventilator, maintaining a patent airway by keeping the tracheal cannula in place. Occasional animals fail to resume spontaneous breathing immediately. In these instances, respiration can be encouraged by gently massaging the thorax.
CRITICAL STEP Spontaneous breathing must be established prior to transfer to the recovery chamber; otherwise deaths will occur. - Upon resumption of spontaneous breathing, mice are transferred with tracheal cannulae in place, to a chamber purged with 100% O2 and maintaining at 37°C using a heat lamp. Within 15-20 min, mice are breathing strongly and beginning to move their extremities, at which point the tracheal catheter can be removed and animals safely transferred to their regular cages.
CRITICAL STEP The airway is readily obstructed in the unconscious mouse due to acetylcholine-induced hyper-salivation and is the major reason for asphyxiation-related death in anesthetized mice following airway physiologic measurements. For this reason, the tracheal cannula must remain in place, even in mice not undergoing bronchoalveolar lavage, until they are arousable and should not be removed until hyper-salivaton has ceased.
Bronchoalveolar lavage:
- Collection of bronchoalveolar lavage fluid is safe when mice recover sufficiently their gag reflex (~20 min after placement in recovery chamber). The gag reflex is assessed by gently sliding the angiocatheter inward and outward; obvious coughing or struggling indicate that the gag reflex has returned.
CRITICAL STEP Allowing too prolonged a recovery time will greatly decrease the efficiency of BAL return from individual mice; thus, the gag reflex must be monitored every few minutes, following the suggested 20 min resting period. If mice are unable to tolerate the lavage procedure due to partial awakening, 3.2% isoflurane vapor anesthesia can be used. - A metallic intubation guide wire (0.5mm O.D.), with a continuous bend of ~30° directed to the left lobe of the lung, is inserted into the angiocatheter. The guide wire and angiocatheter are advanced together into the left lobe of the lung, such that the catheter (hub excluded) extends beyond the front teeth by only 1mm.
CRITICAL STEP Failure to isolate left lung will greatly reduce yield, while enhancing the likelihood of animal death. Care must be taken to ensure that the tip of the guide wire does not pass through the open end of the angiocatheter. Advancing the angiocathether with the metallic tip protruding could lead a tracheal laceration and death due to tracheal rupture. - Keeping the angiocatheter in place, the guidewire is removed and 300 μL of PBS (pH 7.4, sterile) is flushed into the left lung via a 1 ml syringe. Immediately after, while drawing up the syringe plunger to create negative pressure, the angiocatheter is slowly (3 s) removed while intensely massaging the lung. A BAL return of 100-200 μL is expected.
- Immediately return lavaged mice to the 37°C, 100% O2 chamber while continuously massaging the thorax. Place mice on their left side until fully recovered (~20 min). The animals are then placed back into their cages.
TIMING:
Per mouse, the entire procedure should take no longer than 1 hour to accomplish: Step 3-4, 5-10 min.; Steps 5-21, 10 min.; Step 22, 20-30 min.; Steps 23-24, 10 min. With increased proficiency and by staggering subjects in the protocol, up to 3 mice/hour may be processed.
Representative Results:
Airway hyperreactivity in mice, as determined by measures of PC200 values, is a consequence of activation and recruitment to the lungs of T cells and secretion of the cytokine IL-135-7. Thus, airway hyperreactivity is not the inevitable consequence of airway challenge with allergen, but rather depends on an intact T cell immune compartment and the time required for T cell responses to develop in the setting of repeated allergen exposure. As shown in Fig. 2a, airway hyperreactivity, defined as PC200 values that are significantly lower compared to baseline values, developed after 5 allergen challenges with no further significant increase after the sixth challenge. For reasons that are not fully understood, airway reactivity decreased (PC200 values increased) after the first allergen challenge (Fig. 2a). Similar trends are apparent by comparing Ach dose response curves for the same mice (Fig. 2b). However, it is apparent here that full airway hyperreactivity develops abruptly after the fifth allergen challenge, such that mice become more than 30-fold more sensitive to Ach between the fourth and sixth challenges. Together, these findings indicate that the most reliable measurements of AHR are obtained after six allergen challenges (12 days); measurements at earlier timepoints are likely to yield highly variable data. Mice repeatedly challenged with vehicle intranasally (saline) do not develop airway hyperreactivity, and, at all doses of Ach given, RRS measurements do not significantly vary from baseline values (Fig. 3 and data not shown).
Prior to the emergence of robust AHR, the dominant cell type of the airway induced by allergen was the neutrophil (Fig. 4). Similar to the trend for AHR, however, eosinophilia gradually strengthened with repeated allergen challenge and the eosinophil became the numerically dominant cell type in BAL fluid after the sixth challenge, coincident with a marked decline in neutrophis numbers (Fig. 4). Macrophages initially increased in number with the first few allergen challenges and fluctuated in abundance thereafter. Lymphocyte abundance did not change significantly regardless of the number of allergen challenges and, paradoxically given their primary importance to the model, are typically the least numerous cell in the BAL fluid.
Airway resistance measurements in mice receiving neither allergen challenge nor BAL sampling did not vary over the 17 days of experimentation. Repeated BAL fluid sampling in the absence of airway physiology measurements or allergen challenge were also performed, and showed only an enhanced neutrophil and macrophage recruitment to the airways that did not persist beyond 5 days (data not shown). These findings demonstrate that the prominent neutrophilia observed in allergen challenged mice is largely the result of the procedure and not the antigen.
In control, PBS-challenged mice, airway resistance measurements also did not vary significantly over time. Enhanced macrophage and neutrophil, but not eosinophil, recruitment to BAL fluid was also seen in these mice, similar to those changes observed in mice receiving only repeated BAL fluid sampling (Fig. 4 b, d). Together, these data underscore the importance of the allergen, and not the different manipulations of the airway, to the induction of both allergic (eosinophilic) airway inflammation and AHR.
Similar results can be expected using intranasal allergens analogous to the proteinase that we have used here. However, many investigators use ovalbumin to induce allergic lung disease. After an appropriate period of intradermal or intraperitoneal priming (1-2 weeks) with ovalbumin precipitated in an aluminum salt, a robust asthma phenotype, including airway hyperreactivity, can be expected within 24 hours after a single intranasal challenge with soluble ovalbumin.
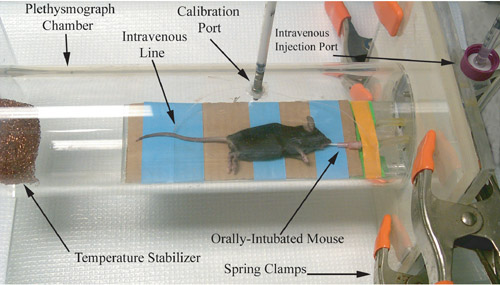
Figure 1. Photographic representation of a rodent plethysmograph, immediately prior to airway physiology measurement recording.
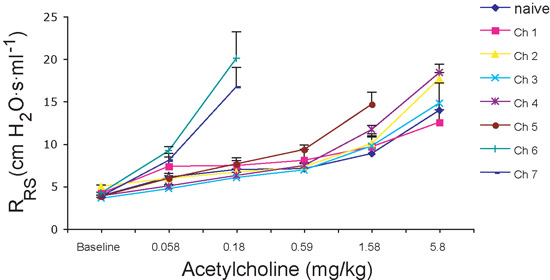
Figure 2. Airway resistance measurements. A) For statistical purposes, antilog PC200 values are reported. Note the large increase in the antilog PC200 after first challenge and subsequent decrease following further challenges. B) Respiratory system resistance (RRS): Note the steepness of the Ach-RRS dose-response curves after sixth and seventh challenges. Error bars represent SEM.
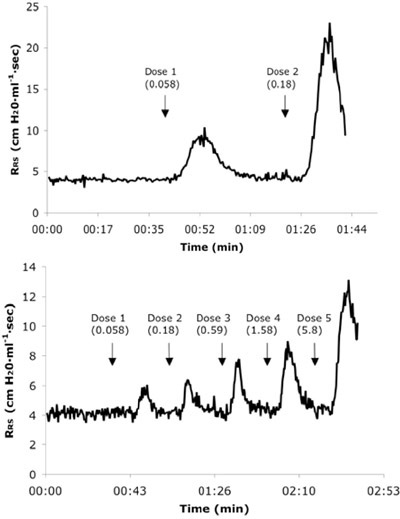
Figure 3. Representative real-time respiratory system resistance (RRS) tracings from a naïve (A) and 6X allergen challenged mouse (B) receiving consecutive IV doses of Ach. Dose values are presented in mg/kg units.
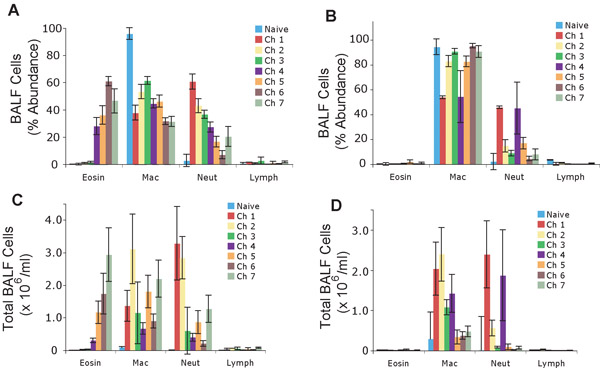
Figure 4. Differential immune cell counts in the bronchoalveolar lavage samples derived from the left lungs of mice treated with 7 consecutive intranasal challenges. Percent (%) abundance of immune cells in mice treated with allergen (A) or PBS (B). Total number of immune cells from mice treated with allergen (C) or PBS (D). Values represented as mean +/- sem.
