1. RBCs isolation from the whole blood
- Prepare EAS-45 solutions. Weigh up all ingredients from Table I and dissolve in 100-200ml of DI water. Add water to make 1000ml solution and adjust pH to 8.0. Filter and aliquot by 50ml. Freeze at -20°C for storage.
Note: Step 1.2 should be performed by a trained medical professional such as a nurse, with an Institutional Review Board approved protocol.
- Draw 3-5ml of blood from the median cubital vein into a 10ml tube containing EDTA and gently mix the blood with EDTA immediately and thoroughly to avoid clotting.
- Process blood sample as soon as possible. All the following steps except centrifugation should be done under the hood to keep the preparation sterile. Transfer the blood to a 50ml centrifuge tube, add 10ml of cold and sterile Histopaque 1077 and centrifuge for 5min @ 1000rpm, 4°C. Repeat twice.
- Add 10ml cold and sterile PBS, centrifuge for 5min @ 1000rpm, 4°C. Remove the supernatant. Repeat 4 times (Total of 5 times).
- Wash with sterile EAS-45 (5min @ 1000rpm, 4°C) twice. During last washing move RBCs into a new sterile 15ml tube.
- Resuspend RBCs in10ml EAS-45.
2. RBCs biotinylation
- Take the tube with RBCs from step 1. Remove all supernatant after centrifuging for 5min @ 1000rpm, 4°C. Put 10μl of RBCs pellet to each of several vials and add corresponding amount of PBS to each vial (see Table II for example of preparation of six different RBCs biotinylation concentrations).
- Make fresh Biotin-X-NHS/DMF 1:10, 1:100 dilutions according to Table II.
- Add 10μl of 0.1M borate buffer to each vial.
- Add calculated amount of biotin solution to each vial (see Table II as example) and vortex immediately.
- Place each RBC vial inside a 50ml conical tube and incubate on rotator for 30min at room temperature.
- Wash each vial 3 times with 800μl of EAS-45 for 2min @ 2000rpm.
- Add 100μl of EAS-45 to each vial and store at 4°C. In each 1μl of the final solution now should be ˜1mln of RBCs.
3. Functionalizing the biotin-linked ligands* on RBCs
- Prepare 2mg/ml streptavidin solution according to manufacturer’s instructions. Aliqouted solution may be stored at -20°C.
- Mix an equal amount of RBCs from step 2.7 (10μl) with streptavidin solution, vortex immediately and incubate on rotator for 30min at 4°C.
- Wash 3 times with 500μl of EAS-45 for 2min @ 2000rpm. Add 15μl EAS-45/ 1% BSA for storage.
- Mix equal amount of RBCs from step 3.3 (10μl) with 20μg/ml ligand solution, vortex immediately and incubate on rotator for 30min at room temperature.
- Wash two times with 500μl of EAS-45/ 1% BSA for 2min @ 2000rpm. Add 15μl of EAS-45/1% BSA for storage.
*If your protein has no biotin link you can use one of the commercially available kits for protein biotinylation (for example, Thermo Scientific # 21955 EZ-Link Micro NHS-PEG4-Biotinylation Kit) or use biotinylated capturing antibodies as an intermediate step as shown in the video.
4. Quantification of receptor and ligand densities
- Incubate ligand-coated RBCs from step 3 and, in a different vial, receptor-bearing cells with saturating concentrations of respective mAbs for 30min at room temperature. Incubate in separate vials cells with irrelevant isotype-matched antibodies for control. If the primary antibodies are not fluorescently labeled, incubate with fluorescently-conjugated secondary antibodies according to manufacturer’s instructions.
- Analyze samples prepared in step 4.1 by flow cytometery with corresponding fluorescent calibration beads. Calculate the densities as shown in Fig. 1.
5. Preparation for micropipette and cell chamber
- Pull micropipettes from capillary tubes using PN-30 Narishige’ Magnetic Glass Microelectrode Horizontal Puller or Sutter Instruments Micropipette Puller.
- Use micromanipulator with microforge to adjust the tip of the pulled micropipette to a desired size (usually the required diameter ranges from 1-5μm depending on the size of the cells to be used in the study).
- Prepare the cell chamber by cutting Microscope Cover Glass to the desired size. Seal the chamber using Mineral Oil from both sides to avoid medium evaporation to change the osmolarity during the experiment.
- Add the receptor- and ligand-bearing cells to the chamber.
6. Micropipette adhesion frequency assay
- Aspirate the interacting cells by respective pipettes and use computer-programmed piezoelectric translator to drive the RBC in and out of contact with the other cell with controlled contact area and time. Detect adhesion events by observing RBC elongation upon cell separation.
- Repeat the contact-retraction cycle 50-100 times for a given contact time. Record the observed adhesion events by adding “1” for adhesion or “0” for no adhesion in a column of Excel spreadsheet. You may use a recording device, e.g., digital media or videotape, for the microscopic images.
- Record the adhesion frequency versus contact time curve using at least three different cell pairs for each contact time to obtain a mean and SEM.
- Record the nonspecific binding curve for control by using RBCs coated with irrelevant ligands (e.g. BSA) and/or blocking the ligands or receptors using their specific functional blockade mAbs. Specific adhesion frequency at each contact time point can be calculated by removal of the nonspecific adhesion frequency1.
7. Data analysis
- Fit the specific adhesion frequency Pa versus contact time t data by a probabilistic model (Equation 1) that describes a second-order forward and first-order reverse, single-step interaction between a single species of receptors and a single species of ligands1:

where Ka is the 2D effective binding affinity, koff is the off-rate, mr and ml are the respective receptor and ligand densities measured in step 4, and Ac is the contact area. The curve-fit has two parameters, AcKa and koff, as Ac and Ka are lumped together and called collectively as effective 2D affinity. Its product with the off-rate is the effective 2D on-rate: Ackon = AcKa x koff.
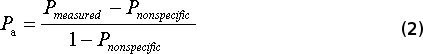
The specific adhesion frequency Pa is calculated by subtraction of the nonspecific adhesion fraction (Pnonspecific) from the total measured adhesion (Pmeasured)1,21:
8. Representative Results:
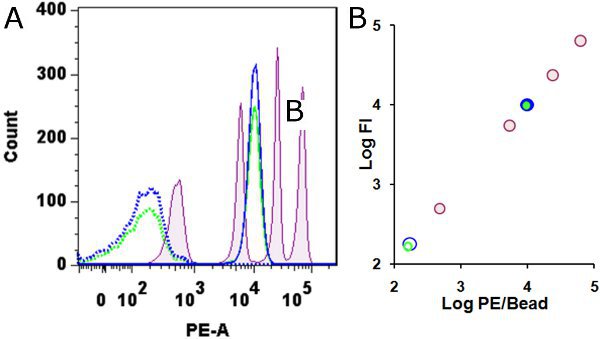
Figure 1 Determination of integrin αLβ2 site density on neutrophils. Neutrophils were first incubated with 1μg/ml of E-selectin-Ig for 10min to match the experimental condition used in Figures 3,4 or without E-selectin-Ig, and then with saturating concentrations (10μg/ml) of PE-conjugated anti-human CD11a mAb (Clone HI111, see Table of specific reagents and equipment) or irrelevant mouse IgG1 for control, washed, and analyzed immediately. Samples were read on BD LSR flow cytometer with standard QuantiBRITE PE calibration beads. Panel A shows fluorescence histograms of calibration beads (pink) together with those of E-selectin-Ig treated (blue color) or untreated cells (green color). Specific CD11a mAb staining is shown in solid curves and irrelevant isotype-matched control antibody staining is shown in dotted curves. Cells treated with E-selectin-Ig (presence in all washing steps and in FACS buffer) did not affect the CD11a density as seen from the comparison with untreated cells. Panel B shows the process of density quantification. Log10 was calculated for the mean fluorescent intensity (FI) of each peak value of four calibration bead histograms from Panel A (pink circles) and for the lot-specific PE molecules per bead (from the manufacturer). A linear regression of Log10 PE molecules per bead against Log10 fluorescence was plotted. For E-selectin treated cells the Log10 FI (y) values equal 3.99 (blue solid circle) and 2.23 (blue open circle) for specific mAb and control antibody, respectivly. We solved the linear equation for x (values are plotted as green and blue circles on Panel B). x = Log10 PE/cell and, as PE:mAb ratio was 1:1, the total number of αLβ2 on neutrophils was calculated as 9587. Surface density was calculated to be 43 molecules/μm2, using 8.4μm as the neutrophil diameter22. Density of ICAM-1 was similarly measured by flow cytometery using PE-anti-human CD54 mAb, which equaled 65 mol/μm2.
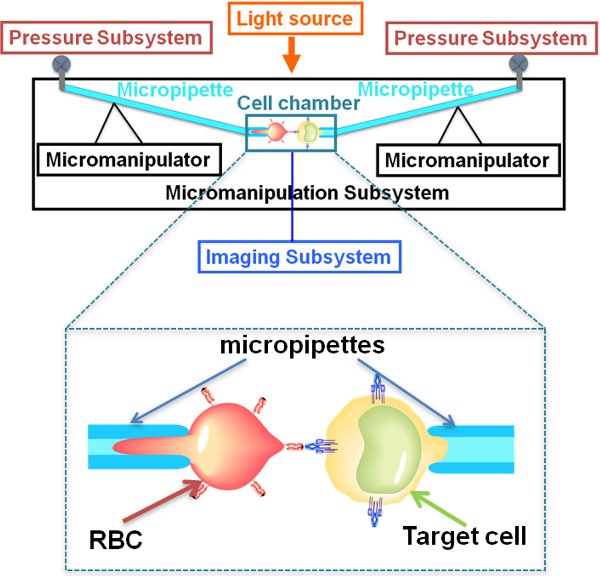
Figure 2 Micropipette system schematics. Our micropipette system was assembled in house and consists of three subsystems: an imaging subsystem to allow one to observe, record and analyze movements of the micropipette-aspirated cell; a micromanipulation subsystem to enable one to select the cells from the cell chamber, and a pressure subsystem to allow one to aspirate the cells into micropipettes. The central piece of the imaging subsystem is inverted microscope (Olympus IMT-2 IMT2) with a 100x oil immersion 1.25 N.A. objective. The image is sent to a video cassette recorder through a charge couple device (CCD) camera. A video timer is coupled to the system to keep track of time. Each micropipette can be manipulated by a mechanical drive mounted on the microscope and finely positioned with a three-axis hydraulic micromanipulator. Mechanical manipulators from Newport could be used as well. One of the micropipette holders is mounted on a piezoelectric translator, the driver of which is controlled by a computer LabView code (available upon request) and the signal translates through a DAQ board via a voltage amplifier (homemade) to the piezo actuator. This allows one to move the pipette precisely and repeatably in an adhesion test cycle. The pressure regulation subsystem is used to control suction during the experiment. A hydraulic line connects the micropipette holder to a fluid reservoir. A fine mechanical positioner allows the height of the reservoir to be precisely manipulated.
Micropipettes are generated using KIMAX melting point borosilicate glass capillary tubes (with outside diameter of 1.0±0.07 mm and an inside diameter of 0.7±0.07 mm. First, the micropipettes from capillary tubes are pulled using PN-30 Narishige’ Magnetic Glass Microelectrode Horizontal Puller (Sutter Instruments Micropipette Puller is another puller option). Second, Microforge system (built in house) is used to cut the micropipettes to desired size opening. Commercial models of Microforge systems are available as well.
To avoid vibration of the micropipettes during the experiment, the microscope, along with the micromanipulators, is placed on an air suspension table.
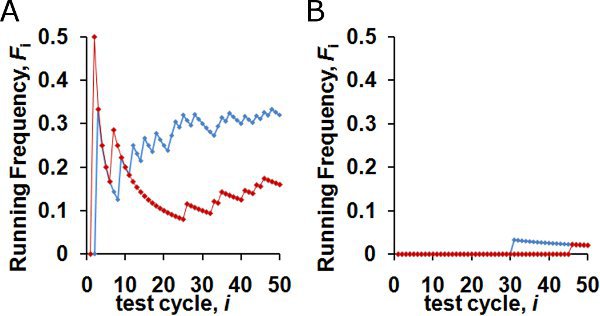
Figure 3 Running adhesion frequency Fi for specific (A) and nonspecific (B) binding at 1s (red) and 10s (blue) contact times measured from repeated adhesion test cycles between RBCs coated with ICAM-1 (A) or hIgG (B) with human neutrophils expressing integrin αLβ2. Fi = (X1 + X2 +…+ Xi)/i (1 ≤i ≤ n), where i is the test cycle index, Xi equals “1” (adhesion) or “0” (no adhesion). Fn (n=50) was used as the best estimate for adhesion probability.
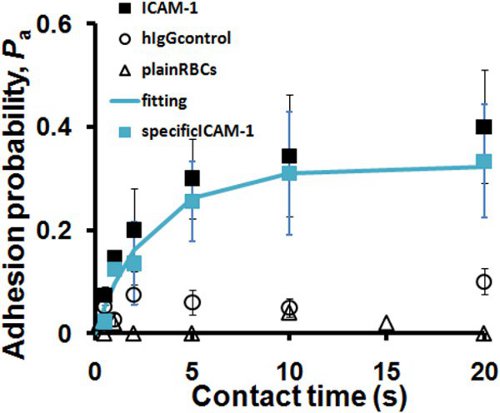
Figure 4 Kinetics of ICAM-1 binding to neutrophil integrin αLβ2 ( ). Adhesion probability measured as shown in Figure 3 for three cell pairs at each contact time is averaged and plotted versus contact time. The chamber medium was HBSS with 1mM each of Ca2+ and Mg2+ plus 1μg/ml of dimeric E-selectin-Ig to upregulate αLβ2 binding. To capture ICAM-1-Ig on RBCs, an intermediate step was added to incubate RBCs with 10μg/ml capture antibody (biotinylated goat-anti-human Fc antibody, eBioscience) after the streptavidin incubation step. To control for nonspecific binding two different conditions were used: 1) RBCs coated with the anti-human-Fc capture antibody and incubated with human IgG instead of ICAM-1-Ig (O) and 2) neutrophils binding to RBCs not coated with the capture antibody (Δ). 10μg/ml human IgG was added to the medium to minimize binding of E-selectin-Ig in solution to the capture antibody on the RBC surface. Nonspecific binding recorded as human IgG control curve was used to obtain a specific adhesion probability curve (
 ) using Eq. 2. Fitting specific adhesion probability curve with Eq. 1 (solid line) returned effective binding affinity AcKa = 1.4•10-4 μm4 and koff = 0.3 s-1.
| Reagent | MW (g/mol) | Concentration (mM) | Amount (g) |
|---|---|---|---|
| Adenine | 135.13 | 2 | 0.27 |
| D-glucose (dextrose) | 180.16 | 110 | 19.82 |
| D-Mannitol | 182.17 | 55 | 10.02 |
| Sodium Chloride (NaCl) | 58.44 | 50 | 2.92 |
| Sodium Phosphate, Dibasic (Na HPO ) | 141.95 | 20 | 2.84 |
| L-glutamine | 146.15 | 10 | 1.46 |
Table 1. EAS-45 buffer preparation (1L).
| 25 mg biotin-XHS in 550 μl of DMF | 0.1M biotin solution |
| 1:10 dilution of 0.1 biotin w/DMF | 0.01M biotin solution |
| 1:100 dilution of 0.1 biotin w/ DMF | 0.001M biotin solution |
Table 2. Preparation of the biotin solution.
| biotin final concentration (μM) | 4 | 10 | 20 | 50 | 100 | 160 |
|---|---|---|---|---|---|---|
| RBCs pellet stock (μl) | 10 | 10 | 10 | 10 | 10 | 10 |
| 1x PBS (μl) | 179.2 | 178 | 176 | 179 | 178 | 176.8 |
| 0.1M borate buffer (μl) | 10 | 10 | 10 | 10 | 10 | 10 |
| 0.01M biotin solution (μl) | 1 | 2 | 3.2 | |||
| 0.001M biotin solution (μl) | 0.8 | 2 | 4 |
Table 3. Biotinylation of RBCs.
To successfully use the micropipette adhesion frequency assay one should consider several critical steps. First, make sure to record the specific interaction for the receptor-ligand system of interest. Nonspecific control measurements (cf. Fig. 3, 4) ensure the specificity. Ideally, nonspecific adhesion probabilities should be below 0.05 for all contact time durations and to have a significant difference between the specific and nonspecific adhesion probabilities for each time point. Different methods could be used to couple the ligands to the RBCs surface. It was shown that chromium chloride coupling method17 gave a higher level of nonspecific binding than biotin-streptavidin coupling.
Second, an adhesion probability for specific interaction should be in the middle range. This requirement may be met by varying the densities of receptors and ligands (or only ligands on RBCs if receptors are constitutively expressed on cells the density of which is hard to change). For this purpose, when testing a new system with unknown receptor-ligand binding affinity, prepare a range of biotinylated RBCs (see Table III as an example) to test a variety of ligand densities. The steady-state adhesion probability should be no more than 0.8 on average as cell-to-cell receptor density variation usually brings the adhesion level of some cells to 1 if the average ligand density is too high. During initial testing for specificity, if some cells have adhesion levels of 0 or 1, the ligand density needs to be adjusted. Nonspecific control measurements usually follow the specific measurements and here one would like to have adhesion probability as close to zero as possible.
Third, find the correct range for the contact times. If the contact time is long enough the exp(- kofft) term in Eq. 1 goes to zero and the effective 2D affinity can be calculated from the plateau level of the adhesion curve1:

The off-rate koff determines the transition phase or how quickly the adhesion curve reaches to a plateau level. To estimate the off-rate accurately requires measurements of several points at a plateau level as well as enough time points in the transition phase. Accounting for the three critical steps described above one will obtain binding curves similar to Fig. 4.
The remaining task is to use a receptor-ligand binding kinetics model to interpret the experimentally measured binding curve and to estimate of 2D kinetic parameters from fitting the model prediction to the data. It should be noted that Eq. 1 represents a simplest model of second-order forward, first-order reverse, single-step, reversible kinetics between a single receptor-ligand species1. More complex kinetic processes have been described, including the cases of dual receptor-ligand species3,4, two-stage binding without14 or with19 trimolecular interactions, and adhesion kinetics limited by active site formation instead of bond kinetics10. In these cases, more involved mathematical models are required to relate the adhesion probability vs. contact time curve and the receptor-ligand binding kinetics.
The sustained interest in the kinetics of receptor-ligand interaction stems from the fundamental hypothesis that kinetics parameters play a role in determining the downstream signaling events inside the cell. The micropipette adhesion frequency assay presented here is one of the very few methods that allow in situ measurements of the two-dimensional (2D) binding kinetics. Two-dimensional means that both receptors and ligands are on the cell surfaces, as naturally occurs in many cell-cell interactions inside the organism. The 2D kinetic rate constants of receptor-ligand binding provide information for how rapidly cells bind to each other or to the extracellular matrix, how long they remain bound, and how many bonds will form. By comparison, in the Surface Plasmon Resonance (SPR) method23 one of the interacting molecules is in the fluid phase, hence called three-dimensional (3D) binding. Because both interacting molecules are purified and isolated from the cellular environment, the kinetic parameters obtained in 3D measurement could be drastically different from those obtained in 2D measurements even for the same receptor-ligand pair17.
The adhesion frequency method analyzes 2D kinetics on living cell membrane and thus provides an opportunity for one to analyze the biophysical and biochemical regulations of the cellular environment. These include the membrane microtopology5, membrane anchor2, molecular orientation and length6, carrier stiffness9 and curvature20, impingement force20, and modulators of the cytoskeleton and membrane organization where the interacting molecules reside15,17.
Because cross-junctional receptor-ligand interaction requires direct physical contact between two cells and results in physical linkage between two cells, the chemical reaction kinetics of molecular interaction can be analyzed by a mechanical assay that puts the cells in contact and detects binding by the effect of force. Although we exemplified the adhesion frequency assay using a micropipette-aspirated RBC as an adhesion sensor, other force techniques can be used, including atomic force microscopy24, biomembrane force probe8,17, optical tweezers25, and the integrated micropipette and cantilever26.
Other mechanically-based 2D assays have been developed. These include the thermal fluctuation assay8, centrifugation assay27,28, rosetting assay29, and flow chamber assay30,31.
The limitation of the adhesion frequency assay is the slow and labor-intensive nature of the assay due to the repeated serial cycles with a single pair of cells tested one contact at a time. It becomes difficult for receptor-ligand interactions with slow off-rates because long contact times would be required for the binding curve to reach steady-state, making the experiment inhibitively long.
The force transducer constructed by a micropipette-aspirated RBC is capable fo detecting piconewton-level forces, which is an order of magnitude lower than the typical strength of a noncovalent receptor-ligand bond1,32. However, receptor-ligand dissociation could occur even at zero forces. Any weak adhesion that goes undetected leads to an underestimation of the binding affinity and on-rate1.
The adhesion frequency method assumes that each adhesion test is identical and independent from the others. This requirement could be violated as was shown for some systems33, where current adhesion increased or decreased the probability of the next adhesion. The Matlab code for checking if the requirement is met for the recorded sequence of adhesion events is available upon request.
