Intravital microscopy can be used in animals to visualize and measure retinal vascular diameters, bloodstream velocities, and total retinal blood flow.
Alterations in retinal blood flow can contribute to, or be a consequence of, ocular disease and visual dysfunction. Therefore, quantitation of altered perfusion can aid research into the mechanisms of retinal pathologies. Intravital video microscopy of fluorescent tracers can be used to measure vascular diameters and bloodstream velocities of the retinal vasculature, specifically the arterioles branching from the central retinal artery and of the venules leading into the central retinal vein. Blood flow rates can be calculated from the diameters and velocities, with the summation of arteriolar flow, and separately venular flow, providing values of total retinal blood flow. This paper and associated video describe the methods for applying this technique to mice, which includes 1) the preparation of the eye for intravital microscopy of the anesthetized animal, 2) the intravenous infusion of fluorescent microspheres to measure bloodstream velocity, 3) the intravenous infusion of a high molecular weight fluorescent dextran, to aid the microscopic visualization of the retinal microvasculature, 4) the use of a digital microscope camera to obtain videos of the perfused retina, and 5) the use of image processing software to analyze the video. The same techniques can be used for measuring retinal blood flow rates in rats.
The retina is one of the most metabolically active tissues in the body, and consequently requires a generous blood supply. Two separate circulations meet this demand: the choroidal circulation for the outer portion of the retina, and the retinal circulation for the inner portion of the retina. Investigations of retinal perfusion are imperative for understanding the pathological mechanisms and consequences of diabetic retinopathy, oxygen-induced retinopathy, retinal artery or vein occlusion, and stroke. Several methods have been employed to quantify retinal blood flow, with each technique having its advantages, disadvantages, limitations, and assumptions. Among these techniques are infusion of 7-8 μm diameter microspheres that lodge in precapillary arterioles1,2, quantitative autoradiography3,4, optical microangiopathy-optical coherence tomography5,6, magnetic resonance imaging7,8, and intravital video microscopy9-16. Advantages of the latter include direct live visualization of retinal vessels and flow, a dependence on only a few minor assumptions, and affordability for labs having a fluorescence microscope with an attached video camera. In previous studies of intravital video microscopy9-16, fluorescent dextran has been used as a plasma marker, and fluorescently labeled red blood cells (from a donor animal) have been used as velocity markers. In the current protocol, 1.9-μm diameter fluorescently labeled microspheres, instead of red blood cells, are used to measure velocity, with this alteration negating the need for a blood cell donor.
The procedures involving the use of animals were reviewed and approved by the Institutional Animal Care and Use Committee of LSUHSC-S and performed according to the criteria outlined by the National Institutes of Health.
1. Preparation of Perfusion Solutions
2. Animal Anesthesia and Vascular Cannulation
3. Preparation for Intravital Microscopy
4. Infusion of Fluorescent Microspheres to Measure Velocities
5. Infusion of a Fluorescent Plasma Marker to Measure Diameters
6. Video Analysis
Figure 1 shows single frames of video from an experiment, with panels A-D and F-I showing fluorescent microsphere streaks captured with a 4X objective and 8 msec exposure time (and binning 2 x 2 pixels to reduce the video file size). Figure 1E shows the orientation of the retinal vessels in the other panels of the figure. Not every frame of video will have a fluorescent streak in focus; however, some frames may have multiple streaks for use in the analysis (e.g. panels C, D, G, H, and I). In this experiment, most of the fluorescent streaks (captured during an 8 msec exposure time) were in the range of 120-170 µm in length, which corresponds to velocities of 1.5-2.1 cm/sec.
Figure 2 shows nine frames of video from the bolus infusion of 2 x 10⁶ molecular weight fluorescein isothiocyanate-labeled dextran, with 0.071 sec (twice the frame capture rate) between the selected frames. The length of time between the first and final panels of Figure 2 is ~0.57 sec. The vessels filling first with the fluorescent dextran (shown in panels A-D) are arterioles, in this case corresponding to “clock” positions of ~1:30, 4:30, 7:00, and 10:00. After a short delay, the venules (in positions of ~12:00, 3:30, 5:30, and 9:00) are filled after the dye makes its transit through the capillary beds.
Figure 3 shows a 10X view of two of the vessels (in the 9:00 and 10:00 positions), with this and similar pictures of the other vessels used to measure diameters. In this experiment, the arteriolar diameters were measured to be in the range of 47-55 µm, and the venules measured to be 50-65 µm in diameter.
The velocities and diameters are inserted into a volumetric flow calculation, flow = mean velocity × π × diameter2/4. For example, 2.0 cm/sec × π × (55×10-4 cm)2/4 = 4.8×10⁻⁵ cm3/sec = 48 nl/sec. Summing the 4 arterioles (or the 4 venules) together provides a calculation of the total retinal blood flow rate. In the mouse eye of this example experiment, the sum of arteriolar flow was 138 nl/sec and the sum of venular flow was 172 nl/sec.
Figure 4 shows flow measurements from an experiment in which both fluorescent microspheres and fluorescent red blood cells (as described in our previous studies9-16) were injected into the same mouse, to determine if similar vessel velocities and flows would be found. In this experiment, the mouse retina had 6 arterioles and 6 venules, with measured velocities and flows very similar (p=0.75 for arterioles; p=0.38 for venules).
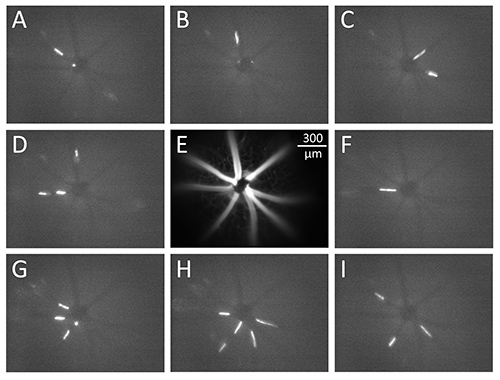
Figure 1. Video frames captured during an intravital microscopy experiment. Fluorescent microspheres 1.9 µm in diameter flow through retinal vessels (panels A-D and F-I), with the appearance of the microspheres as streaks during the camera exposure time of 8 msec. Panel E shows the orientation of the blood vessels in the superficial layer of the retina. The scale bar in panel E corresponds to all images in Figure 1.
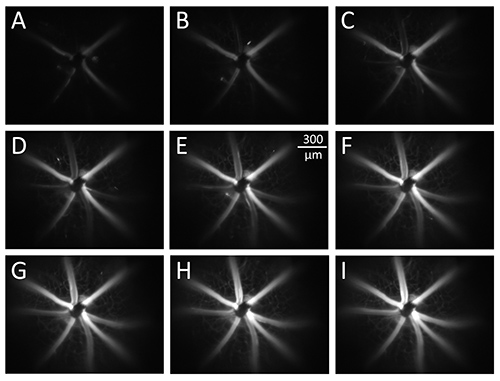
Figure 2. Infusion of high molecular weight dextran through the retinal circulation. Bolus infusion of fluorescent dextran, with 0.071 sec between the selected frames. The vessels filling first with the fluorescent dextran (panels A-D) are arterioles, with the venules filled after the dye makes its transit through the capillary beds. The scale bar in panel E corresponds to all images in Figure 2.
Click here to view larger image.
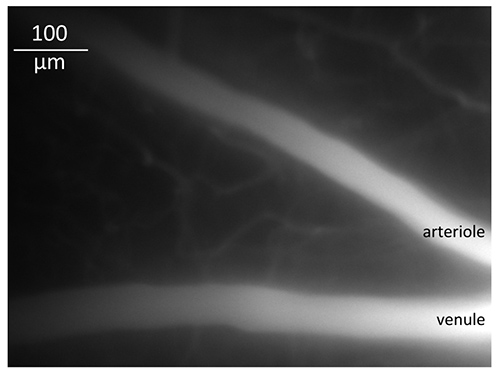
Figure 3. A retinal arteriole and venule at higher magnification. A 10X objective was used to capture images of the superficial retinal vessels for measurements of diameter.
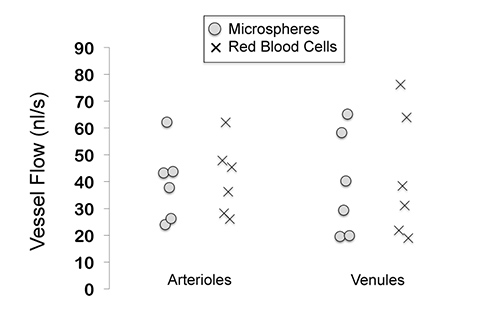
Figure 4. Retinal microvessel flows measured with the use of fluorescent microspheres and fluorescent red blood cells. No statistical differences between the two techniques were found (using a paired t-test). In this experiment, the flows were measured in 6 arterioles and 6 venules of a mouse retina.
Click here to view larger image.
This technique of intravital video microscopy can be applied not only to mice, but also to rats. This protocol relies on only several assumptions, but is limited to use under anesthesia and with pupil dilation as we have described it. The other assumptions and limitations are as follows:
1. Assumption of minimal optical magnification error resulting from the refractive nature of the eye. As described by others18-20, the method of filling the space between the cornea and coverslip with an ophthalmic solution fluid layer counteracts the refractive power of the cornea. Any unaccounted magnification would affect measurements of length and diameter.
2. Limitation of optical resolution. We typically use a 10X objective (working distance = 1.05 cm) for our diameter measurements, with this objective having a numerical aperture of 0.25 and a nominal resolution of ~1.2 µm (approximately the uncertainty in the measurement). The overall resolution is not limited by the camera/image processor resolution at this magnification, equal to 0.47 µm/pixel with no pixel binning and equal to 0.94 µm/pixel with 2 x 2 binning. Higher numerical aperture objectives can be used for this protocol to improve resolution, as long as the working distances are sufficient: the axial lengths of the mouse and rat eyes are ~3.4 mm and ~6.3 mm, respectively21-23.
3. Assumption of dextran filling the entire vascular lumen. The endothelial glycocalyx may largely exclude the 2 x 10⁶ molecular weight dextran over the short time frame involved in the measurement protocol. Therefore, this technique likely defines the inner vessel diameter as beginning at the lumen edge of the glycocalyx, which is typically estimated to extend 0.1-0.5 µm from the endothelial cell membrane24. This thickness is smaller than the optical resolution of the video collection system, but contributes to an uncertainty in the diameter measurement.
4. Assumption of right circular cylindrical vessels. Previous measurements of retinal blood flow using intravital video microscopy have found slightly higher values of venular flow compared to arteriolar flow11-13,15, with this discrepancy likely due to an elliptical shape of the venular diameter. The venular diameter may have its longer radius perpendicular to the optical axis, and therefore calculations of venular flow may be slightly overestimated. We have previously documented similar geometrical effects on intravital microscopic measurements of flow in intestinal submucosal venules of mice25.
5. Assumption that the sampled velocities represent the mean. The microspheres flowing closer to the vessel wall will travel more slowly that those in the centerline. Our assumption in past studies (using fluorescently labeled RBCs) is that 10 velocity measurements are sufficient to obtain a reasonably accurate distribution of velocities whose mean approximates the true average red blood cell velocity. However, measuring more than 10 velocities per vessel is likely to provide even more precision in the average.
This protocol was written specifically for use in the retina; however, the procedures can be applied to other tissues that are accessible via intravital microscopy. The protocol requires minimal troubleshooting, with the main step that requires some practice being the alignment of the mouse's head in the correct position to allow a direct optical path through the objective to the center of the optic disk. If the retina is not easily seen through the iris, visually confirm that the pupil has been sufficiently dilated by the tropicamide solution. In addition, the arteriolar and venular microspheres will not always be in focus simultaneously, as the arterioles and venules are slightly offset from each other: therefore, collecting the video requires some adjustments up and down in the focus. Several steps in the procedure can be modified to variations in the available equipment. For example, a digital camera (although helpful) is not required: we have used a similar protocol with a nondigital camera that used standard frame rates, and with our previous method of using fluorescently labeled red blood cells or platelets from donor animals instead of microspheres10,16. The critical steps are simply to be able to record the diameters of the fluorescently filled blood vessels and to record the velocity of fluorescently labeled bloodstream markers.
The authors have nothing to disclose.
Funded by NIH EY017599 (NRH).
Name of the Reagent/Equipment | Company | Catalog Number or Product | Comments/Description |
Fluorescent microspheres | Bangs Laboratories | FS04F/10584 (green) | |
High molecular weight fluorescent dextran | Molecular Probes | D-7137 (green); D-7139 (red) | |
Microscope system | Nikon | Eclipse E600FN + attachments | |
4X objective | Nikon | Plan Fluor 4X | numerical aperture 0.13; working distance 17.2 mm |
10X objective | Nikon | Plan 10X | numerical aperture 0.25; working distance 10.5 mm |
Tropicamide ophthalmic solution | Bausch & Lomb | 1% Tropicamide | |
Hypromellose ophthalmic solution | HUB Pharmaceuticals | 2.5% Goniovisc | |
Image processing software | University of California San Francisco Vale Lab | Micro-Manager | |
Digital video camera for microscopy | Photometrics | CoolSnap ES | 1392 x 1040 pixel resolution; pixel size 6.45 x 6.45 μm |