1. Cell Line Revival and Maintenance
- Revive CHO cells in 9 ml CD-CHO medium supplemented with 8 mM L-Glutamine and 10 ml/L 100x hypoxanthine/thymidine supplement (complete growth medium).
- Centrifuge at 100 x g for 5 min.
- Resuspend the cells in 10 ml of fresh complete growth medium.
- Remove a 1 ml sample and determine the viable cell concentration by light microscopy using the trypan blue dye exclusion method in a hemocytometer.
- Initiate a culture at a seeding density of 3 x 10⁵ cells/ml in 125 ml shake flasks.
- Maintain the culture in an incubator at 37 °C, a humidified atmosphere of 5% CO2, on an orbital shaking platform rotating at 120 rpm.
- Subculture every 3-4 days in the complete growth medium at a seeding density of 2 x 10⁵ cells/ml.
2. Transfection of the Cell Line with the Plasmid Containing the Biosensor Gene
- Prepare plasmid DNA using a large-scale plasmid purification kit.
- Maintain cells at the appropriate conditions (37 °C, 5% CO2) 12-24 hr prior to transfection to ensure the cells are actively dividing at the time of transfection.
- Count the cells using the trypan blue dye exclusion method, then prepare a working volume of 20 ml of cell culture in a 125 ml shake flask at a concentration of 1 x 10⁶ cells/ml.
- Use a suitable transfection kit for the cell line in use. The plasmid DNA to transfection reagents ratio will be dependent on the cell line and vector. It is recommended that this is optimized by testing a range of ratios within the range specified by the manufacturer prior to conducting the final transfections. Also maintain at least one negative control culture containing the cells but no DNA.
- Incubate for 4 days in static mode and then transfer to a shaking platform rotating at 125 rpm.
- Add the appropriate antibiotic for plasmid selection to a suitable concentration as determined by a kill curve. In this study, zeocin was added to a final concentration of 400 μg/ml for selection of transfected cells.
- Change media at an appropriate time interval for the cell line, adding antibiotic each time, until cells in control well have died.
- Use the most confluent wells to progress to shaking cultures.
- Establish a cell bank by freezing the cells in cryogenic vials containing 107 viable cells in 1 ml of freeze mix. In this work, this consists of 92.5% growth medium and 7.5% dimethyl sulfoxide.
3. Batch and Fed-batch Cell Growth Curve
- Follow instructions for cell maintenance above to establish triplicate cell cultures of the transfected CHO cells in 250 ml shake flasks with a working volume of 50 ml.
- Maintain the cultures in a humidified cell incubator at 37 °C, with 5% CO2, on an orbital shaking platform rotating at 125 rpm, and remove 4.1 ml samples from each growing culture at 24 hr intervals.
- Use 100 μl of the sample to determine the viable cell concentration and cell viability with the trypan blue dye exclusion method.
- Repeat until the viable cell concentration is reduced to zero.
- Repeat for the fed-batch cell cultures supplementing with the appropriate amount of glucose or glutamine on day 6 to restore their concentrations to their initial values of 36 mM and 4 mM, respectively. It is recommended that additional control cultures are also maintained, which are to be fed with the same volume (12 ml in this case) of pure water.
4. FRET Ratio Measurements
- Take 2 ml of the daily samples removed in step 3.2 above and centrifuge at 100 x g for 5 min at 4 °C.
- Resuspended the cell pellet in 2 ml of ice cold phosphate buffered saline (PBS). Transfer this into a 6-well plate and add a blank sample containing no cells to one well.
- Measure the levels of blue and yellow fluorescence immediately at an excitation wavelength of 430/435 nm and emission wavelengths of 465/435 nm (blue) and 520/510 nm (yellow).
- Calculate the FRET ratios (ratio of yellow fluorescence detected over blue fluorescence detected).
5. Metabolite Assays
- Take 2 ml of the daily samples removed in step 3.2 above and centrifuge at 100 x g for 5 min at 4 °C. Remove the supernatant.
- Resuspend the cell pellet in 3 ml ice cold PBS and centrifuge again at 100 x g for 5 min.
- Remove the supernatant and resuspend the cell pellet in 3 ml ice cold PBS as above. Sonicate the sample 5x for 3 min each at a pulse of 15 sec on and 15 sec off. At this point, the cell extracts may be frozen if desired.
- Use an appropriate glucose assay kit as per the manufacturer’s instructions on samples of cell extracts to determine the intracellular glucose concentration (see table of materials).
Note: Use appropriate standards to construct a standard curve. In this work, the concentration of standards ranged between 0-100 mM. - Using the readings for the standards, construct the standard curve and find the linear equation of best fit (in this case: y = 1310.51x – 723.43 where y is the absorbance reading and x is the glucose concentration).
- Calculate the glucose concentrations using the standard curve and taking the dilution into account. The intracellular glucose concentration can then be calculated using this equation:

For CHO cells, the single cell volume was calculated using a cell diameter of 12 μM 12. - Use an appropriate glutamine assay kit as per the manufacturer’s instructions on samples of cell extracts to determine the intracellular glutamine concentration (see table of materials).
Note: Use appropriate standards to construct a standard curve. In this work, the concentration of standards ranged between 0-2 mM. - As in 5.5 above, construct the calibration curve (in this case y = 203.1x + 17.1 where y is the absorbance reading and x is the glucose concentration)
- Using the standard curve, calculate the glutamine concentration of the samples, taking the dilution into account. The intracellular glutamine concentration can be calculated using Equation 1 above.
An overview of the methodology is presented in Figure 2. In the work presented herein, CHO cells were transfected with the FIBS vector and stable cell lines were selected at an antibiotic pressure of 400 μg/ml zeocin. Two separate stable cell lines constitutively expressing the glucose and glutamine sensors were therefore created. Figure 1 depicts the configurations of the two biosensors used in this study. The glucose sensor is based on the Apo-Max principle and the corresponding plasmid is pRSET-FLIPglu600μΔ11Aphrodite. This is a fusion of the enhanced cyan fluorescent protein (ECFP) and the Aphrodite variant of the enhanced yellow fluorescent protein (EYFP) to the F16A mutant of the E. coli glucose/galactose periplasmic binding protein. 11 amino acid residues were removed from the linker region to improve FRET efficiency13. This vector was cloned into the pCDNA4/TO vector using the unique EcoRI and PstI restriction sites, which uses a Cytomegalovirus promoter and a SV40 enhancer.
The glutamine sensor is based on the Apo-Min principle (Figure 1) and the corresponding plasmid was derived from an insertion of the yellow fluorescent protein citrine into the E. coli glutamine periplasmic binding protein between amino acids 98 and 99 with an ECFP attached to the C-terminus. The structure has been rigidified by deletion of residues in the linking region, while the amino acid substitution D157N has been made to the QBP to increase affinity for glutamine, followed by several mutations to optimize FRET efficiency8. The glutamine FRET construct was supplied in the pUTKan plant expression vector and was digested with BamHI and SalI to release the insert. The latter was cloned into the corresponding restriction sites in the vector pET41a in frame with the N-terminal purification tags. The same insert was ligated into the pCDNA4/TO vector, after it had been digested with BamHI and XhoI using the compatible sticky ends produced by SalI and XhoI, to produce the mammalian expression vector.
Plasmid expression was confirmed by quantifying the mRNA levels of the biosensors using qRT-PCR. Both FIBS were found to be actively transcribed at 25-44 mRNA copies per cell assuming β-actin at 3,000 transcripts per cell at the mid-exponential level14.
Batch overgrow cultures of each cell line were maintained taking daily samples for the in vivo calibration of each FIBS. The viable cell growth profile of the two cell lines is shown in Figure 3 and the corresponding FRET measurements and intracellular metabolite concentrations determined by enzymatic assays are presented in Table 1. A fluorescence plate reader was used to measure fluorescence of samples at an excitation wavelength of 430/35 nm and emission wavelengths of 465/435 nm for cyan and 520/510 nm for yellow. It was found that low cell numbers present in the first 4 days of culture led to unreliable FRET signal. Similarly, the high level of cell lysated present after day 8 of culture produced a high amount of light scattering. Only data for days 4-8 is therefore used to construct the calibration curves for the glucose and glutamine FIBS, the equations for which are shown in Table 1. The results show that the FIBS signal produces a reliable correlation with the intracellular concentrations between 1-5 mM for glucose and 0.3-2 mM for glutamine.
Following this and to validate the above findings, fed-batch overgrow cultures of the two cell lines were performed. A feed containing high substrate concentration (glucose in the case of the glucose FIBS and glutamine in the case of the glutamine FIBS) was supplemented on day 6 of the cell culture to elevate the extracellular concentrations of the substrate. In the case of the glucose-fed culture the extracellular glucose concentration was increased back up to 36 mM, while for the glutamine-fed culture, the glutamine concentration was increased to 4 mM. Figure 4 shows representative results from this study. Figures 4A and 4C depict the FRET ratios on each day, which clearly respond to feeding by reversing the trend they followed up to day 6. Specifically, in Figure 4A, the FRET ratio for the glucose FIBS CHO cell line decreases on day 7 in response to glucose addition, since the glucose FIBS follows the APO-On configuration. Similarly, in Figure 4C, the FRET ratio for the glutamine FIBS CHO cell line increases in response to glutamine addition, in line with the principle of Apo-Off sensors.
These FRET measurements were finally used to calculate the corresponding intracellular glucose and glutamine concentrations based on the aforementioned calibration curves and the results are shown in Figure 4B for glucose and Figure 4D for glutamine. They are compared to the actual intracellular concentrations of these substrates as determined with the glucose and glutamine enzymatic assays and show adequate agreement.
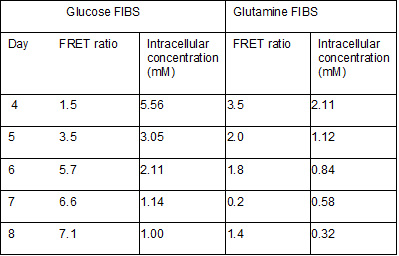
Table 1. Results for in vivo calibration of FRET ratio for glucose and glutamine FIBS. The calibration curves are described by the following equations that can be used to make predictions: y= -1.232x + 8.034 for glucose (R2=0.961), and y= 1.892x + 0.332 for glutamine (R2=0.879), where y is the FRET ratio and x is the concentration in mM.
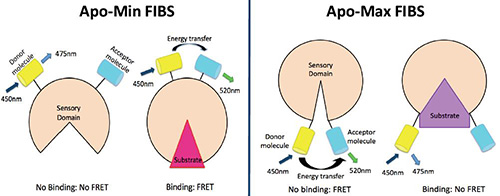
Figure 1. Principles of the FIBS used in this study. The glutamine FIBS (left) follows the Apo-Min principle, by which glutamine binds to the sensing domains and generates a conformational shift that brings both fluorescent proteins closer together, thus increasing FRET. The glucose FIBS (right) follows the Apo-Max principle, by which glucose binds to the sensing domain and generates a conformational change that separates the fluorescent proteins, thus decreasing FRET.
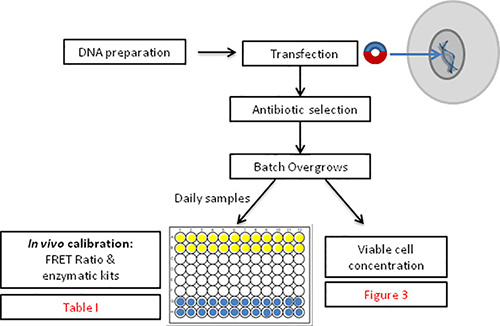
Figure 2. Overview of the methodology for FIBS calibration and subsequent noninvasive quantification of intracellular glucose and glutamine concentrations.
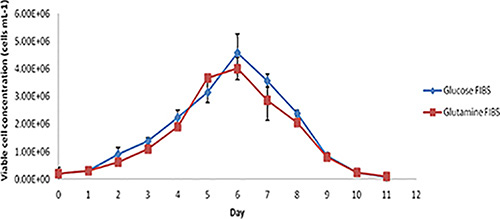
Figure 3. Viable cell concentration profile for batch overgrow cultures of glucose FIBS- and glutamine FIBS-expressing CHO cell lines (n=2 biological repeats with three measurements per cell line).
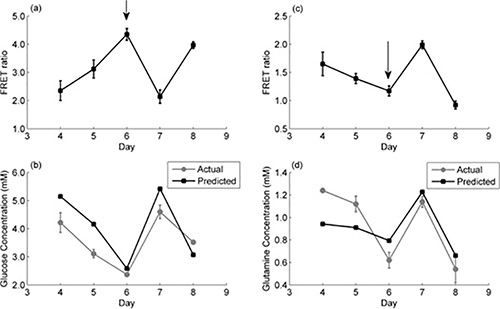
Figure 4. Fed batch culture of FIBS-producing CHO cells and corresponding FRET measurements. (a) Daily measurements of FRET ratio of fed-batch CHO cell cultures expressing glucose FIBS. The arrow indicates the addition of glucose to the cell culture. (b) Actual intracellular glucose concentration profile measured using a glucose assay kit against values predicted based on in vivo glucose calibration curve (Table 1). (c) Daily measurements of FRET ratio of fed-batch CHO cell cultures expressing glutamine FIBS. The arrow indicates the addition of glutamine to the cell culture. (d) Actual intracellular glutamine concentration profile measured using a glutamine assay kit against values predicted based on in vivo glutamine calibration curve (Table 1). In all cases, n=2 biological repeats with three measurements per cell line.
