Here we describe a robust biological assay for quantifying the relative rate of proteolysis by the ubiquitin-proteasome system. The assay readout is yeast growth rate in liquid culture, which is dependent on the cellular levels of a reporter protein comprising a degradation signal fused to an essential metabolic marker.
Protein degradation by the ubiquitin-proteasome system (UPS) is a major regulatory mechanism for protein homeostasis in all eukaryotes. The standard approach to determining intracellular protein degradation relies on biochemical assays for following the kinetics of protein decline. Such methods are often laborious and time consuming and therefore not amenable to experiments aimed at assessing multiple substrates and degradation conditions. As an alternative, cell growth-based assays have been developed, that are, in their conventional format, end-point assays that cannot quantitatively determine relative changes in protein levels.
Here we describe a method that faithfully determines changes in protein degradation rates by coupling them to yeast cell-growth kinetics. The method is based on an established selection system where uracil auxotrophy of URA3-deleted yeast cells is rescued by an exogenously expressed reporter protein, comprised of a fusion between the essential URA3 gene and a degradation determinant (degron). The reporter protein is designed so that its synthesis rate is constant whilst its degradation rate is determined by the degron. As cell growth in uracil-deficient medium is proportional to the relative levels of Ura3, growth kinetics are entirely dependent on the reporter protein degradation.
This method accurately measures changes in intracellular protein degradation kinetics. It was applied to: (a) Assessing the relative contribution of known ubiquitin-conjugating factors to proteolysis (b) E2 conjugating enzyme structure-function analyses (c) Identification and characterization of novel degrons. Application of the degron-URA3-based system transcends the protein degradation field, as it can also be adapted to monitoring changes of protein levels associated with functions of other cellular pathways.
The ubiquitin-proteasome degradation system is a major regulatory machine, which has been implicated in the maintenance of protein homeostasis in all eukaryotes. The UPS initially conjugates multiple ubiquitin molecules to a target protein after which the poly-ubiquitin-tagged protein is degraded by the 26S proteasome. In most cases, the rate limiting step for ubiquitin mediated degradation is substrate ubiquitylation, mediated by E2 conjugating enzymes and E3 ligating enzymes (E3 Ligases)1. Consequently, intracellular stability of specific proteins reflects their susceptibility to ubiquitin-conjugation and the activity of their cognate ubiquitylation enzymes.
E3 ligases are the principal substrate recognition components of the UPS. As such, these enzymes recognize degrons within their substrates that are either absent or not exposed in their stable counterparts 2. For example, many regulators of the cell cycle must be synthesized and degraded in a temporally specific manner in order to keep cell cycle progression in order. The degradation of these proteins is often controlled by phosphorylation, mediated by cell-signaling regulated kinases 3,4. On the other hand, aberrantly-folded proteins are recognized through cryptic degrons. These are regions that are normally hidden in the native structure and are exposed upon structure perturbation. Such degrons include hydrophobic domains 5-7 and intrinsically disordered segments8.
Since the seminal discovery of the ubiquitin-system for protein degradation and characterization of its fundamentals in reticulocyte lysates9, yeast genetics was instrumental in discovering many of the components of the ubiquitin system10. The success of yeast as a model organism for systematic analysis of protein degradation by the UPS is mainly due to the fact that the UPS is highly conserved in all eukaryotes4, coupled with their amenability as an experimental system. Indeed, yeast-based systems are commonly employed to decipher the mechanisms of action of the ubiquitylation machinery.
Studying protein degradation by biochemical means usually requires preparation of cell extracts. While animal cell proteins can be extracted under relatively mild conditions that preserve protein interactions and function, the presence of a robust cell wall in yeast11 requires considerably harsher disruption conditions which may affect protein recovery. Indeed, different procedures for yeast cell disruption vary considerably in their capacity to recover intact proteins in amounts that correctly represent their relative cellular abundance. Further inaccuracy is inherent in the different methods employed for determining degradation rates of specific proteins: Metabolic labeling-based 'pulse-chase' experiments followed by immunoprecipitation, to isolate specific proteins12, is often not strictly quantitative. Thus, when protein degradation is compared by this method, extra caution should be exercised in interpreting the results. To circumvent this drawback, an alternative cycloheximide (CHX) chase assay can be employed12. In this assay, the translation inhibitor is added to cell cultures and temporal changes in protein steady-state levels are subsequently monitored. Nevertheless, the usage of CHX is limited to proteins with relatively short half-lives (< 90 min), as long-term inhibition of protein synthesis is cytotoxic. Notably, both of the above-mentioned assays require the use of protein-specific antibodies, which are not always available.
To overcome these technical limitations, researchers have developed several approaches that do not require cell extraction and direct protein handling. One approach is based on the establishment of auxotrophic yeast strains, obtained by the deletion of genes encoding essential metabolic enzymes. Such genes include HIS3, LEU2, LYS2 and TRP1, encoding for enzymes required for amino acid biosynthesis, as well as URA3 that encodes OMP decarboxylase (Ura3), an essential enzyme of pyrimidine ribonucleotide biosynthesis. Ura3 has been widely used in protein degradation studies. In these assays, constitutive expression of Ura3 rescues growth of ura3 cells in uracil-deficient medium13. Consequently, destabilizing Ura3 through the fusion of a degron can diminish cell growth on minimal medium lacking uracil. This method has been used in various protein degradation studies, including the identification of degradation determinants5, E3 ligases14 and auxiliary ubiquitylation factors15 and the discovery of novel UPS degrons16. All of these methods employed cell growth on agar plates as assay readout. However, the growth criterion (positive/negative growth), while robust and efficient, is mostly qualitative and does not provide quantitative information that is important for evaluating a degron's potency or the relative contribution of various auxiliary degradation factors.
We have therefore developed and utilized yeast vectors and screening methods enabling systematic and quantitative analysis of protein degradation by the URA3-degron fusion system. The protocol is based on an easy-to-handle assay that measures Growth kinetics in Liquid culture under Selective conditions (GiLS) and on the generation of standard growth curves. Yeast growth kinetics are characterized by three main phases — the lag, the exponential (log) and the stationary phase. Calculation of yeast replication kinetics during the log phase under selective conditions, which is determined by the levels of expression of the Ura3-degron, provides an unbiased quantitative measurement of protein degradation. This method can be applied to measuring and comparing degradation rates of multiple UPS substrates simultaneously in multiple strains and under various conditions.
1. Cell Culture
2. Cell Preparation for Analysis
3. Growth Kinetics in Liquid Culture Under Selective Conditions (GiLS)
4. Calculation of Minimal Doubling Time (MDT): Principles of the MDTcalc Algorithm
NOTE: Principles of the MDTcalc algorithm, using a representative sample of Try467 yeast cells (Table 2) grown in SD complete media, are illustrated in Table 1 and Figure 1, showing a data spreadsheet and growth plots, respectively.
5. Using MDTcalc
Investigating the role of enzymes of the Doa10 pathway in the degradation of a reporter substrate
To test the validity of the GiLS method it was compared to a traditional degradation assay. This experiment assesses the relative contribution of components of the ER-membrane localized Doa10 E3-ligase complex20,21 to the degradation of the protein quality control reporter substrate Deg1-VU (Figure 3A). The Deg1-VU plasmid was integrated into wild type cells or into cells lacking the gene for the E2 conjugating enzyme, UBC7 (ubc7) and protein stability was subsequently determined by a CHX chase assay6. Anti-FLAG immunoblotting revealed a stable Deg1-VU protein band in ubc7 cells that was absent in wild type cells (Figure 3B). The absence of Deg1-VU in wild type cells is attributed to its continuous degradation that was abolished in ubc7 cells, indicating that Deg1-VU stability is strongly dependent on Ubc7.
Obviously, the degradation of Deg1-VU is rapid. However, the relative rate of degradation cannot be determined by a CHX assay since the protein is undetectable in wild type cells from the outset. Consequently, the newly-developed GiLS assay method was employed, in order to compare the relative differences in the kinetics of protein degradation between wild-type and various mutant strains (Figure 3C). Initially, wild type, ubc6, ubc7 or doa10 cells expressing Deg1-VU were grown on SD complete medium. To measure GiLS, cells were washed and incubated in SD-URA. MDT calculation was executed as exemplified in the protocol. Figures 3C, 3D show similar growth curves and calculated MDT (~2.5 hr) for all strains grown in SD complete, excluding the possibility that the deletion of any of the examined genes affects cell growth. In contrast, incubation in SD-URA resulted in poor growth of wild-type cells (MDT=6.34), whereas only a minor growth defect was observed in the mutant strains (MDT ~3 hr).
Examining the effect of different mutants of the E2 conjugating enzyme Ubc7 on the degradation of Deg1-VU
The fact that Ubc7 is absolutely required for Deg1-VU degradation enables accurate assessment of even partial effects of various E2 mutants, since the experimental range of the system is very wide. Accordingly, plasmids containing wild type or mutant UBC7 were integrated into Ubc7 cells expressing Deg1-VU and their contribution to degradation was determined by GiLS. As expected, fast growth kinetics were observed in cells expressing Ubc7 with the active-site mutants C89S and N81A22 (Figure 4). In addition, two mutants predicted to indirectly hinder Deg1-VU degradation (V25G and H94K) were tested. These mutations also enhanced cell growth, compared to wild-type Ubc7, albeit to a lesser degree than the active-site mutants (average MDTs of 3.4 hr for V25G and H94K compared to average MDTs of 2.7 hr for C89S and N81K) (Figure 4). Thus, the GiLS method can be used for accurate measurement of the relative contribution of various degradation factors to the stability of a reporter substrate.
Isolation and evaluation of novel degrons
The GiLS system was also employed in a high throughput screen format to identify novel degrons and quantify their relative potency, i.e., the degree by which they induce degradation (Figure 5). To optimize the identification of bona fide degrons, an additional selection step, which is growth in the presence of Fluoroorotic Acid (5-FOA), was added. Ura3 efficiently converts 5-FOA into a toxic compound (5-fluorouracil) that can serve as a positive selection for the isolation of yeast strains where Ura3 is destabilized16,23. To identify novel degrons, a library of reporter plasmids was generated by fusing random fragments derived from a yeast cDNA library to Ura3-GFP plasmid24 (Figure 5A). The GFP moiety was added in order to enable a secondary screen and provide information about the localization of the fusion degron (see discussion). The library was transformed into yeast, then selected in the presence of 5-FOA (Figure 5B) and positive clones were isolated and re-seeded on agar plates in a 96-well plate format. Each colony was transferred into 96-well plate, incubated O/N, and diluted in a new 96-well plate as described in section 2.2. It is expected that growth of cells in SD-URA medium will correlate with the degree of Ura3 expression, which is the outcome of the degron's potency to induce degradation. This was subsequently confirmed by applying GiLS (Figure 5C). We confirmed that all randomly-picked colonies that were pre-selected with 5-FOA showed similar MDT values, on SD-LEU medium (Figure 5C, empty bars). In contrast, all clones showed variable growth rates on SD-URA, which were significantly slower than cells expressing control Ura3-GFP (Data not shown). As indicated, there is an inverse relationship between growth rate on SD-URA and MDT. Thus, the higher the MDT, the more potent is the degron. Indeed, all MDTs derived from positively selected clones were higher than that of the control (above the red line) (Figure 5C, filled bars).
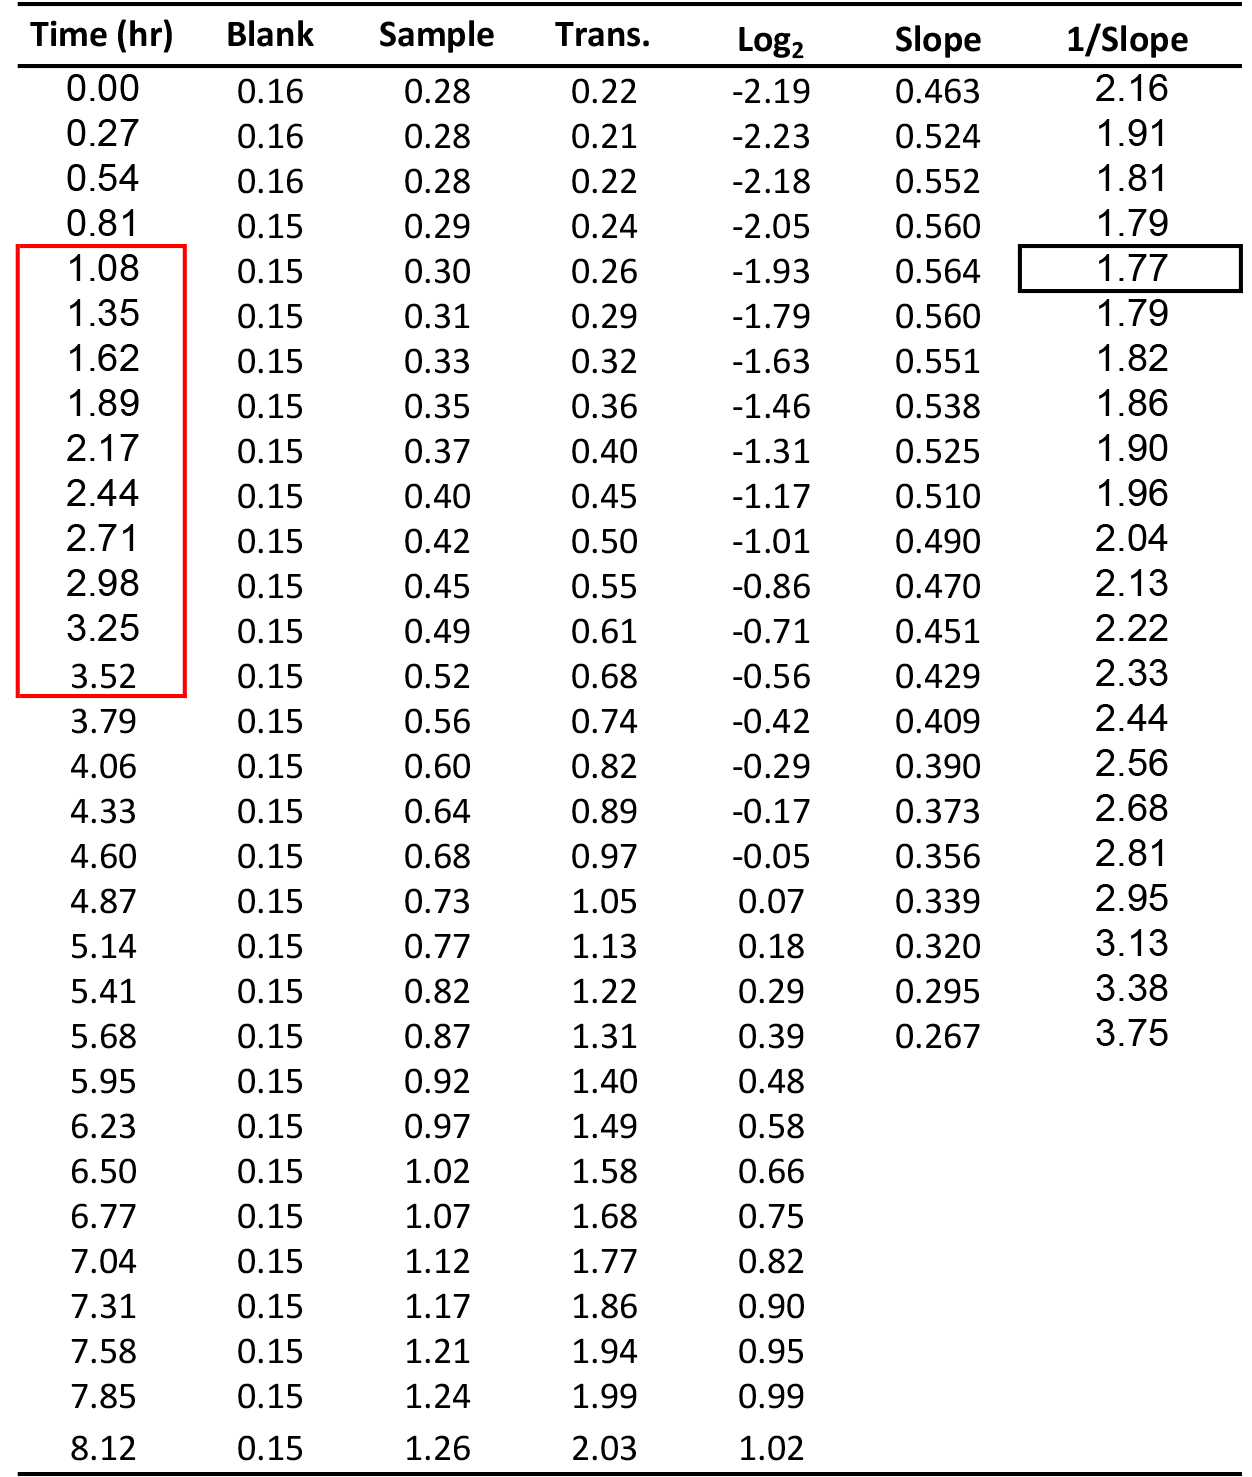
Table 1. Illustration of the calculation of yeast MDT. Time units are hours (hr). Blank and sample are from OD600 reads. Transformation (Trans.) is the OD600 value after blank subtraction and path-length correction. Log2 is calculated from the transformed data. Slope is the Log2 (OD600) values within consecutive of intervals of 10 time points divided by time. 1/Slope is the time required for the cell population to duplicate itself. Black rectangle marks the MDT value. Red rectangle marks the time interval from which the MDT was calculated.
Yeast | Genotype | Source |
TRy467 | α, his3∆1, lys2∆0, ura3∆0, leu2∆0 | Euroscarf |
TRy508 | α, his3-∆200::pRS303/Ubc7prom-Ubc7-3HA::HIS, leu2-3,112, ura3-5, lys2-801::Met25-Deg1-Flag-Vma12-Ura3::LYS, trp1-1, ubc7∆::LEU2 | This study |
TRy528 | α, his3-∆200::pRS303/Ubc7prom-Ubc7[N81A]-3HA::HIS, leu2-3,112, ura3-5, lys2-801::Met25-Deg1-Flag-Vma12-Ura3::LYS, trp1-1, ubc7∆::LEU2 | This study |
TRy530 | α, his3-∆200::pRS303/Ubc7prom-Ubc7[C89S]-3HA::HIS, leu2-3,112, ura3-5, lys2-801::Met25-Deg1-Flag-Vma12-Ura3::LYS, trp1-1, ubc7∆::LEU2 | This study |
TRy532 | α, his3-∆200::pRS303/Ubc7prom-Ubc7[H94K]-3HA::HIS, leu2-3,112, ura3-5, lys2-801::Met25-Deg1-Flag-Vma12-Ura3::LYS, trp1-1, ubc7∆::LEU2 | This study |
TRy556 | α, his3-∆200::pRS303::HIS, leu2-3,112, ura3-5, lys2-801::Met25-Deg1-Flag-Vma12-Ura3::LYS, trp1-1, ubc7∆::LEU2 | This study |
TRy563 | α, his3-∆200::pRS303/Ubc7prom-Ubc7-3HA::HIS, leu2-3,112, ura3-5, lys2-801::Met25-Deg1-Flag-Vma12-Ura3::LYS, trp1-1, ubc7∆::LEU2, ubc6∆::KanMX | This study |
TRy633 | α, his3-∆200::pRS303/Ubc7prom-Ubc7[V25A]-3HA::HIS, leu2-3,112, ura3-5, lys2-801::Met25-Deg1-Flag-Vma12-Ura3::LYS, trp1-1, ubc7∆::LEU2 | This study |
TRy786 | α, his3-∆200::pRS303/Ubc7prom-Ubc7-3HA::HIS, leu2-3,112, ura3-5, lys2-801::Met25-Deg1-Flag-Vma12-Ura3::LYS, trp1-1, ubc7::LEU, doa10∆::HIS3 | This study |
Table 2. List of yeast strains used in this study.
Plasmids used in this study | ||
Plasmid | Relevant markers | Source |
pTR717 | YDpK-MET25p-Deg1-Flag-Vma12-Ura3 (integrative plasmid containing LYS1) | This study |
pTR1412 | pRS315-CUP1p-URA3-HA-GFP (LEU) | This study |
Additional suitable reporter plasmids | ||
Plasmid | Relevant markers | Source |
pOC9-CL1 | pOC9-CUP1p-HA-URA3 (TRP1) | (17) |
URA3-2(GFP) | pPS414-TRP1p-MYC-ura3-2-GFP | Lewis and Pelham |
Table 3. List of plasmids used in this study. Reference: Lewis, M. J. & Pelham, H. R. Inefficient quality control of thermosensitive proteins on the plasma membrane. PLoS One 4, e5038, doi:10.1371/journal.pone.0005038 (2009).
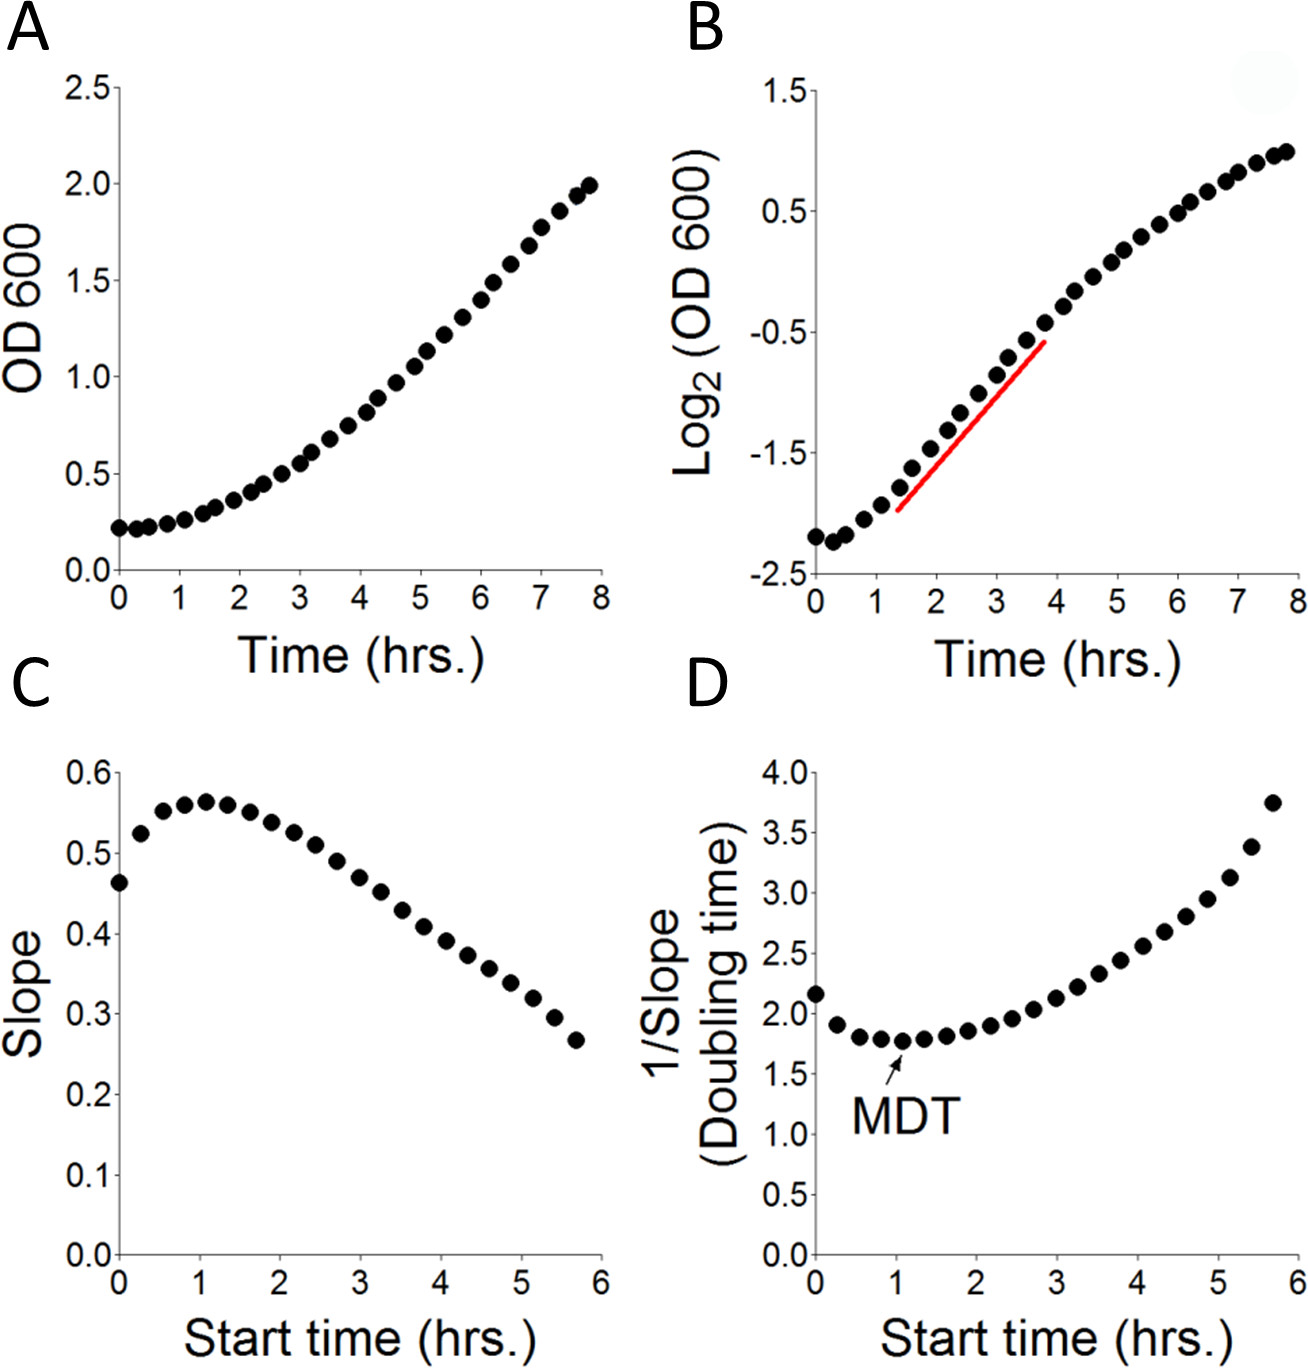
Figure 1. Principles of calculation of MDT. Try467 yeast cells at OD600 0.22, were incubated in SD complete media for the indicated time period. OD600 measurements were taken every ~15 min and the data was collected in a spreadsheet. (A) Transformed OD600 values from Table 1 plotted against time. (B) Log2 of OD600 plotted against time. Red line: Marks the time interval from which the MDT was calculated (D). (C) Yeast growth rate (slope) was calculated by measuring changes in OD600 of consecutive 10 time points (assuming linearity) over time. Start time: The time from which calculation was initiated. (D) The time required for yeast to double is the inverse of the slope from (C) (1/Slope). MDT: The calculated Minimal Doubling time (in hr).
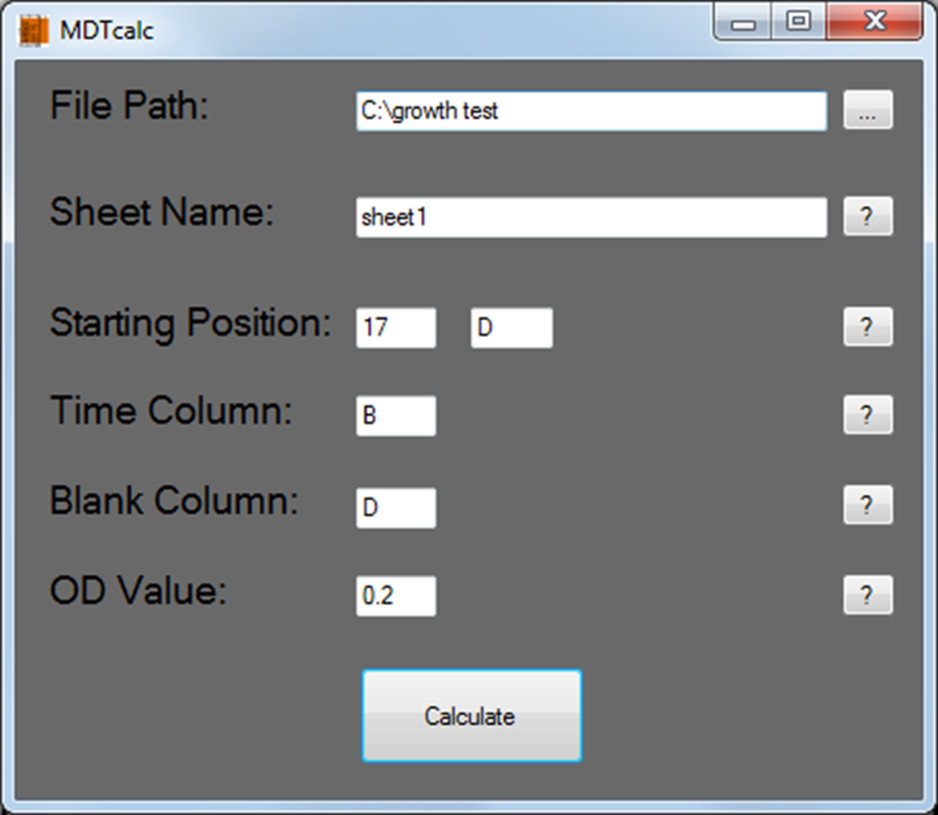
Figure 2. MDTcalc start screen: Protocol section 5.1. Typical input values to be entered are shown.
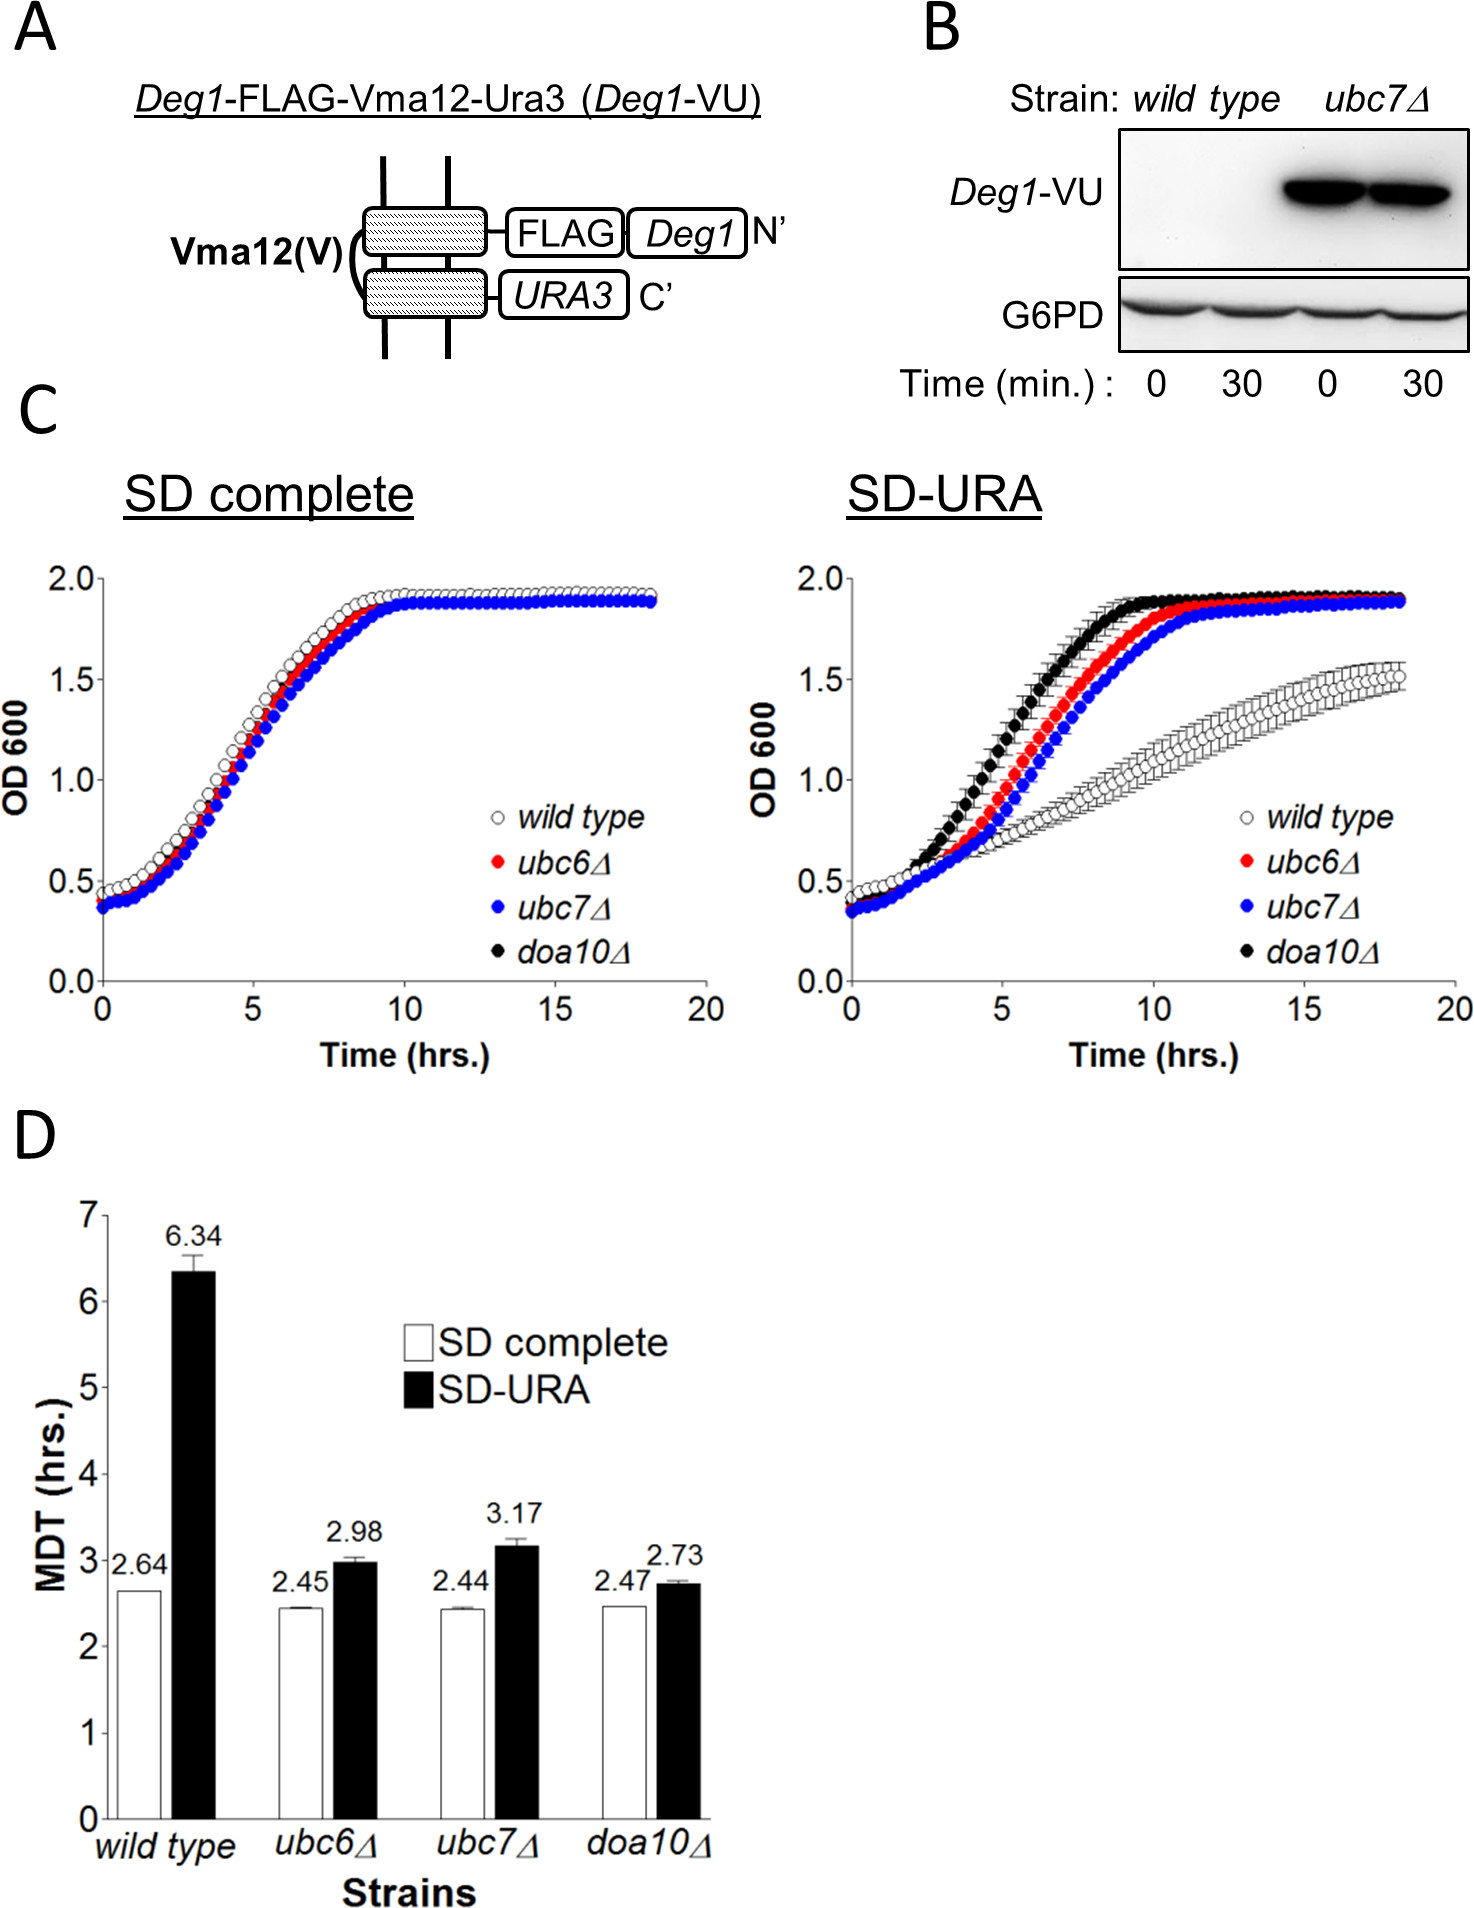
Figure 3. Measuring the degradation of Deg1-VU. (A) Schematic presentation of the different protein elements of Deg1-VU and its organization at the ER membrane.(B) Determination of the degradation of Deg1-VU by the CHX assay in wild type and ubc7 cells. Cells collected at time zero or after 30 min with CHX were lysed and proteins were separated by 5-15% SDS PAGE. Deg1-VU was visualized by immunoblotting using anti FLAG antibodies. G6PD staining served as a loading control. (C) The indicated strains, expressing Deg1-VU were incubated in SD-complete or SD-URA media for 20 hr and OD600 was measured every 15 min. OD600 are the transformed values. (D) The MDT for each strain was calculated using MDTcalc.
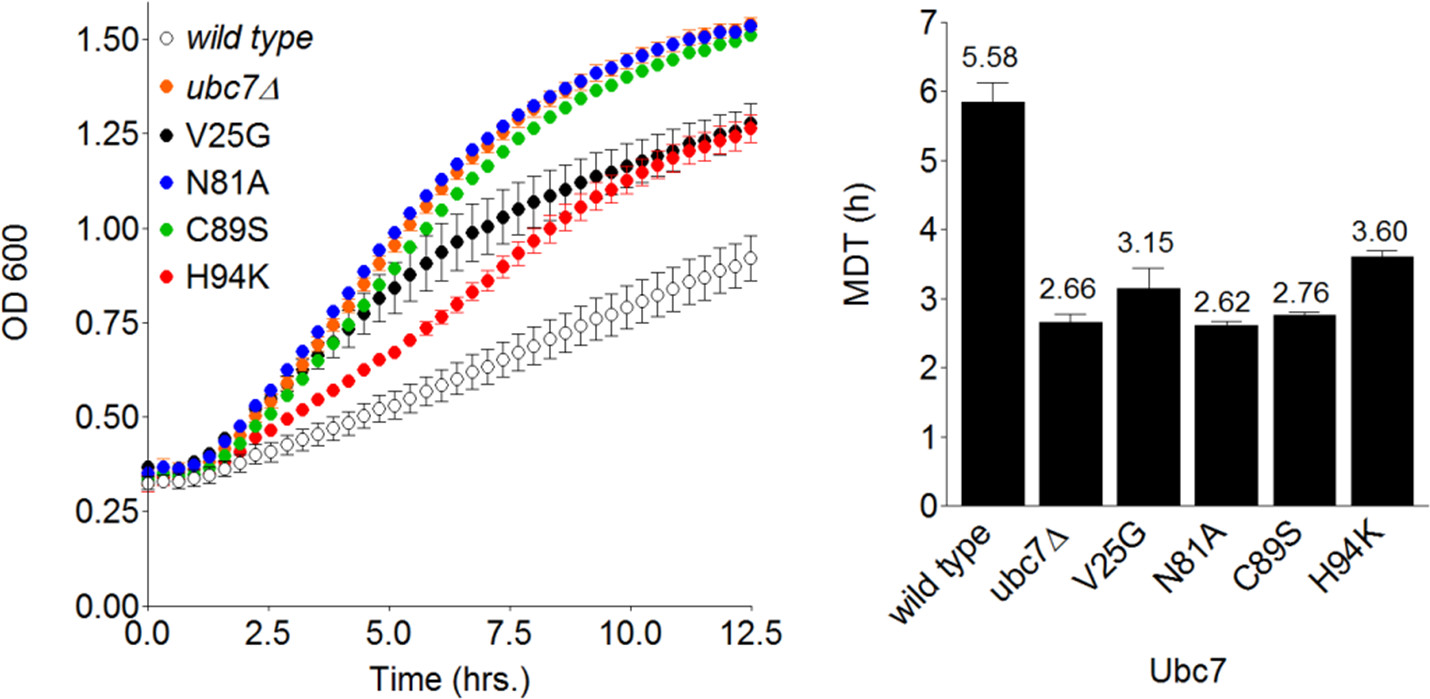
Figure 4. Measuring relative degradation rates of Deg1-VU in Ubc7 mutant strains. Left: Plot of the transformed OD600 values, measured during the replication of wild-type, ubc7Δ and the indicated Ubc7 mutants, versus time. Cells expressing Deg1-VU were grown on SD-URA medium and OD600 was measured every ~15 min. Right: The MDT for each strain was calculated using MDTcalc.
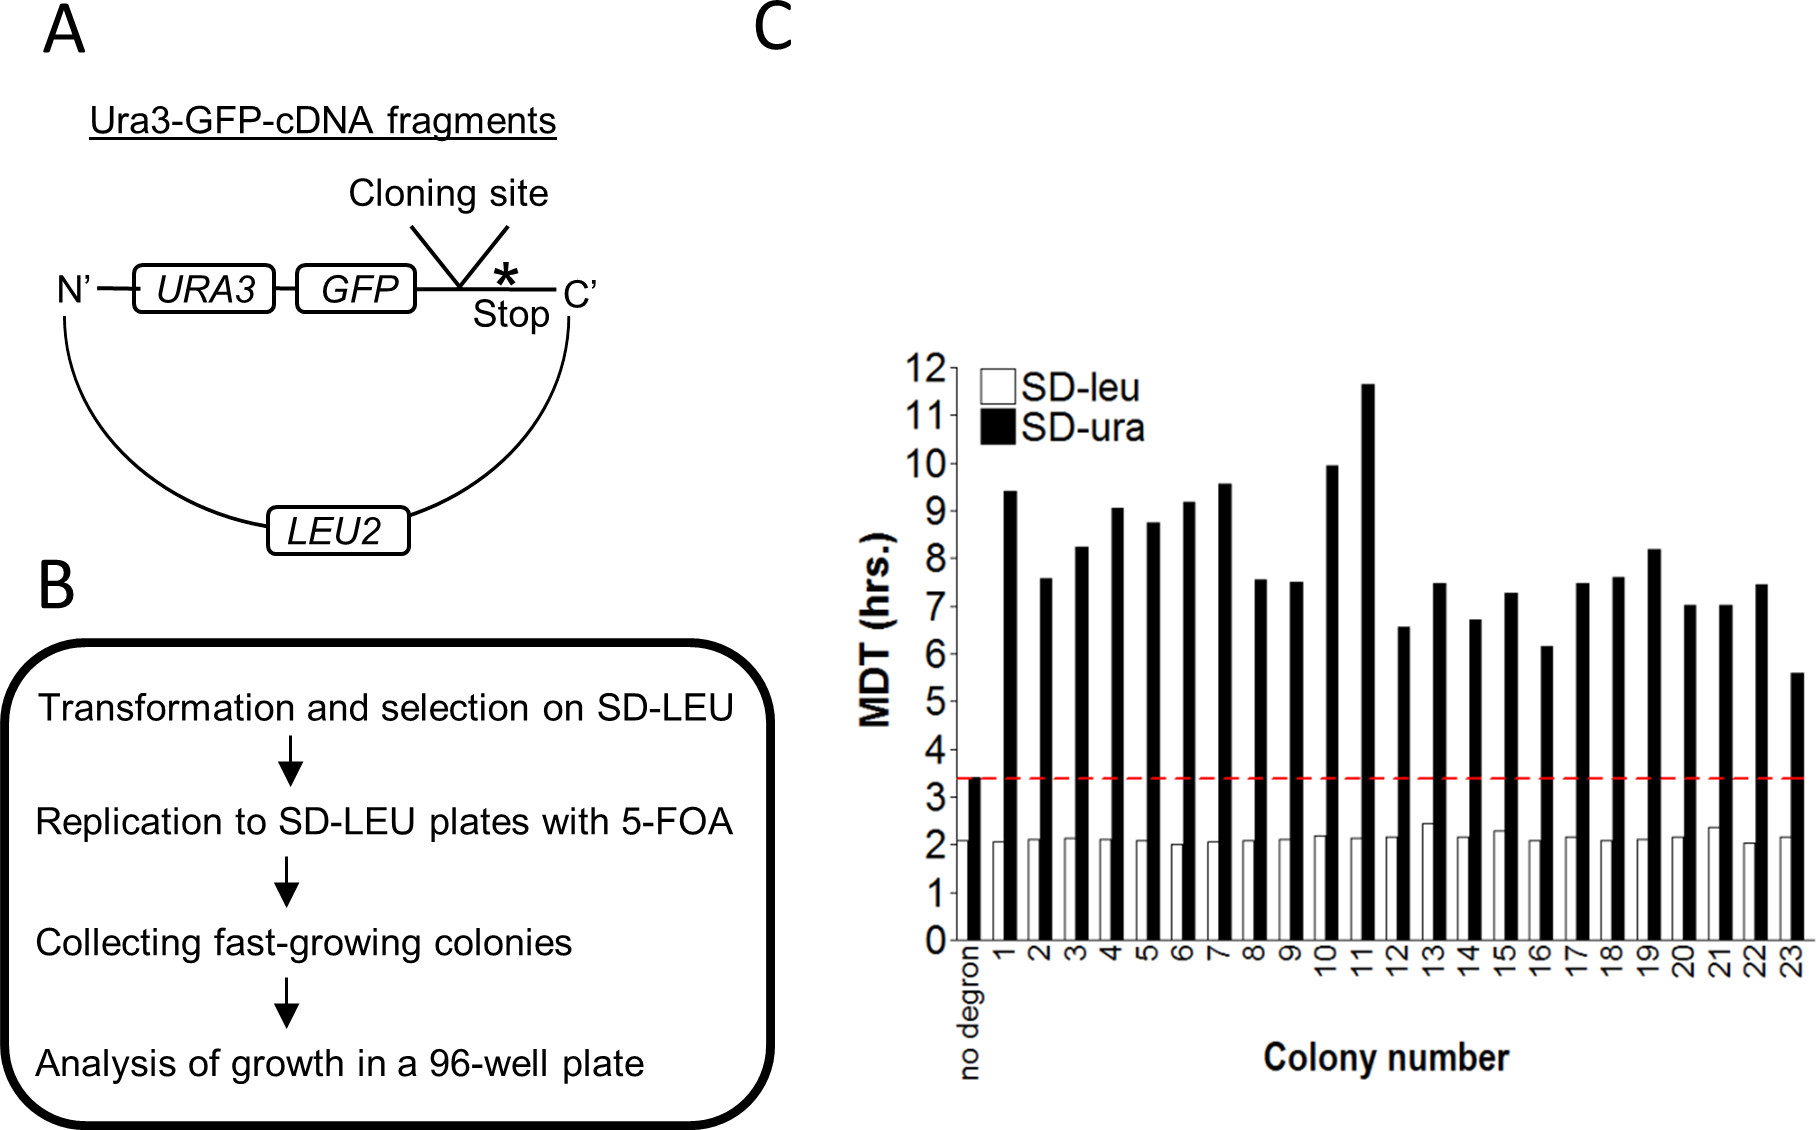
Figure 5. A high throughput assay for identification and isolation of novel degrons. (A) Schematic presentation of the features of the Ura3-GFP-cDNA reporter. (B) A flow chart describing the experimental steps for the isolation of yeast strains carrying a degron. The plasmid library described in A was transformed into Try467 cells, followed by selection on SD-LEU plates. Colonies were replicated to SD-LEU plates containing 5-FOA and fast-growing colonies were collected and organized on plates in an ordered array. (C) Colonies expressing Ura3-GFP-cDNA that grew on plates containing 5-FOA were incubated in either SD-LEU or SD-URA media for 20 hr. OD600 was measured every ~15 min and the minimal yeast doubling time (MDT) was calculated using the MDTcalc software. No degron: a plasmid expressing Ura3-GFP without a degron, serves as a positive control for growth. Red line: threshold determined by the MDT value of the control.
Here we describe an assay based on cell growth for determining relative protein degradation rates, termed 'Growth kinetics in Liquid culture under Selective conditions' (GiLS). The GiLS assay has several advantages: It is simple to set up, data acquisition and analysis is straightforward and it is extremely modular. Consequently, GiLS can be applied simultaneously to multiple samples in a user friendly multi-well plate format that can be adapted to automation for high throughput applications. Most importantly, GiLS provides highly reproducible, quantitative and robust data and is more flexible than agar-plate based-growth assays that select for positive/negative growth. In addition, GiLS is highly sensitive in that it can detect small variations in protein degradation rates or steady-state levels, reflecting the activity of relevant UPS components or degrons. Finally, GiLS assays require significantly shorter growth periods (<12 hr) compared to growth assays on agar plates (typically 2-4 days).
While the GiLS assay is very useful for studying protein degradation, several important considerations should be taken into account. For example, it is essential to use an isogenic yeast strain background due to strain-specific growth characteristics. Furthermore, to ascertain assay validity, each assay should be repeated at least three times under identical conditions, most importantly, the initial cell density (OD600), growth temperature, and cell culture shaking intensity should not be altered. It is therefore recommended that the specific assay protocol is stored in the microplate reader's software for repeated uses. An additional variable that should be considered is where the degron is positioned within Ura3. As the degron position may determine its function, positioning at either the C' or N' regions must be empirically tested.
Calibration of reporter protein expression level is also critical for successful application of GiLS. An optimal reporter is one that is efficiently degraded by the system under investigation and thus confers uracil auxotrophy. However, variations in auxotrophy should also faithfully mirror the reporter stability. This can be determined empirically by prior testing of the correlation between reporter protein degradation rates, determined by additional biochemical methods, and MDT values, determined by GiLS (Figure 3B). One common problem arises when the basal steady-state expression of a reporter does not reach a threshold level and is thus too low to enable growth on SD-URA even when it is completely stabilized. Such a problem can be overcome by placing the reporter expression under the control of an inducible promoter that increases basal protein expression without affecting degradation. Promoter activity in such systems should be finely calibrated to avoid permanent growth on SD-URA due to high protein levels and reporter enzyme activity even when it is partially degraded. The promoters and expression conditions described in this study were chosen because they allow sensitive regulation of protein expression: MET25p and CUP1p are metabolite-induced promoters the activity of which can be finely tuned through control of methionine and copper, respectively (Table 3).
Quality control reporter substrates (as those described in this study) can form intracellular aggregates that might sequester Ura3 and prevent its function. In such a case uracil auxotrophy can be mistakenly interpreted as the result of protein degradation. To test the tendency of different degrons to aggregate, an additional reporter should be employed. For example, the Ura3-GFP reporter designed for the degron screen (Figure 5A), enables visualization of intracellular aggregates by fluorescent microscopy of cells growing in the presence of 5-FOA. These aggregates appear as dense GFP foci that are clearly distinguishable from the diffuse appearance of the soluble protein (data not shown). The Ura3-GFP-degron reporter can be similarly used to determine the effect of the degron on protein co-localization and subcellular distribution. It can also be used for following the degradation of selected substrates by flow cytometry, as a secondary screen25.
A most significant advantage of the GiLS method is that it is sufficiently flexible and thus can easily be adapted to a variety of applications in addition to those described in herein. For example, the method can also be used for examining the fitness of the proteasome under various conditions. In this case, a non-ubiquitylated proteasome substrate such as ornithine decarboxylase (ODC) is fused to Ura3. The method can also test protein degradation in distinct intracellular compartments when a specific localization signal is employed. In this study Vma12 anchored the reporter to the ER-membrane (Figures 3, 4). Similarly, a nuclear localization signal (NLS), ER retention signal (KDEL) or cytosol (absence of a specific signal) can be employed. A system enabling simultaneous analysis of protein degradation in various intracellular compartments could have profound impact on our understanding of how protein degradation networks operate. Finally, the principles of the selection method can be applied to research of protein degradation in other model cell-based systems, from bacteria to human cells, all of which require the URA3 gene product for survival.
The authors have nothing to disclose.
We thank Dr. Yuval Reiss and Dr. William Breuer for critically reviewing the manuscript and Omri Alfassy for helping in the development of the Ura3-GFP screen assay. We also thank Dr. M. Hochstrasser and Dr. R. Kulka for plasmids and strains. This work was funded by the Israeli Academy of Sciences (grant 786/08) and by the United States-Israel Binational Scientific foundation (grant 2011253).
Name of Material/ Equipment | Company | Catalog Number | Comments/Description |
Difco yeast nitrogen base w/o amino acids and ammonium sulfate | BD Biosciences | 233520 | For yeast growth on SD minimal media. Amino acids to be supplied are: Arginine, Histidine, Isoleucine, Leucine, Lysine, Methionine, Phenylalanine, Threonine, Tryptophan |
Ammonium sulfate | Sigma – Aldrich | A4418 | |
Glucose | Sigma – Aldrich | 16325 | |
Adenine | Sigma – Aldrich | A8626 | |
Uracil | Sigma – Aldrich | U0750 | |
Amino acids | Highest purity available | ||
96 well plates | Nunc | 167008 | Any other compatible brand can be used |
Cyclohexamide | Sigma – Aldrich | C7698 | Working conc. 0.5 mg/ml |
Infinite 200 PRO series | Tecan | For yeast incubation and OD 600 measurements. Any other compatible temp-controled reader can be used | |
MDTcalc | Experimental software |