Determining The Electromyographic Fatigue Threshold Following a Single Visit Exercise Test
Summary
This protocol describes the electromyographic fatigue threshold which demarcates between nonfatiguing and fatiguing exercise workloads. This information could be used to develop a more individualized training program.
Abstract
Theoretically, the electromyographic (EMG) fatigue threshold is the exercise intensity an individual can maintain indefinitely without the need to recruit more motor units which is associated with an increase in the EMG amplitude. Although different protocols have been used to estimate the EMG fatigue threshold they require multiple visits which are impractical for a clinical setting. Here, we present a protocol for estimating the EMG fatigue threshold for cycle ergometry which requires a single visit. This protocol is simple, convenient, and completed within 15-20 min, therefore, has the potential to be translated into a tool that clinicians can use in exercise prescription.
Introduction
Surface electromyography (EMG) is a noninvasive approach of studying motor unit recruitment during isometric1-3, isokinetic4-6, or continuous7-10 muscle action. The amplitude of the EMG signal represents muscle activation which consists of the number of motor units activated, the firing rate of the motor units, or both11. The concept of the EMG fatigue threshold is used to indicate the highest workload in which an individual can exercise indefinitely without an increase in EMG amplitude8.
It is important to briefly discussion the origin of the EMG fatigue threshold. The original study by deVries et al.12 involved a protocol that consisted of multiple (usually 3 to 4) discontinuous work bouts, where the EMG amplitude was plotted versus time for each work bout. The power output was then plotted versus the slope coefficients from the EMG amplitude versus time relationship, and then extrapolated to zero slope (the y-intercept)12. The authors12 originally termed that protocol the physical working capacity at the fatigue threshold (PWCFT). In a another study, deVries et al.13 used discontinuous work bouts, but used linear regression to find the first power output that resulted in a significant slope for the EMG amplitude versus time relationship. The authors13 also termed that protocol the PWCFT, creating some confusion in the literature. In a subsequent article, deVries et al.14 modified their earlier protocol13 and developed a continuous incremental protocol. The EMG amplitude was plotted against time for each power output and the PWCFT was defined as the average of the highest power output that resulted in no change in EMG amplitude over time and the lowest power output that resulted in an increase in EMG amplitude over time14.
It should be noted that the term PWC was originally introduced in the late 1950s15,16 and is synonymous with a plethora of literature (past, present, and across different countries) examining aerobic capacity at a given workload17. Moreover, the term is used in the ergonomic and industrial literature which focus on day-to-day productivity of workers performing repetitive action during 8 hour work days such as individuals in an assembly plant18.
The term EMG fatigue threshold was initially used by Matsumoto and colleagues19 after they modified the deVries12 protocol where the power output versus slope coefficients of the EMG amplitude versus time relationship are plotted and extrapolated to the point of zero slope. More recently, Guffey et al.20 and Briscoe et al.8 used the method of deVries et al.14 and the terminology of Matsumoto et al.19 to operationally define the EMG fatigue threshold. Moving forward, we recommend that the term EMG fatigue threshold be used. Thus, the EMG amplitude versus time relationship is plotted for each power output and then analyzed using linear regression analyses (Figure 1). To estimate the EMG fatigue threshold, the highest power output with a non-significant (p >0.05) slope and the lowest power output with a significant (p <0.05) slope is identified and then the average is calculated14. This protocol is simple, convenient, and completed within 15-20 min. Moreover, the incremental rate can be modulated based on the individual’s level of habitual physical activity, and therefore has potential applications in clinical settings.
Protocol
All procedures were approved by the University Institutional Review Board for Human Subjects.
1. Preparation of the Participant’s Leg
- Have the participant neatly roll up their shorts for the desired leg. Then tape the shorts so that the quadriceps femoris muscle group is exposed and draw a line around the area the participant needs to shave.
- IMPORTANT: Have the participant shave their leg before the test rather than the previous day as this ensures that there are no stubbles which may interfere with the EMG signal.
- Once the participant has finished shaving the desired area of the leg, clean the shaved area with rubbing alcohol to ensure there are no remnants of the shaving gel (or cream) which can interfere with the EMG signal.
2. Measurement of Leg for Electrode Placement
- In order to place the EMG electrode on the vastus lateralis muscle, make the following measurements
- Have the participant stand straight facing the researcher.
- Locate the anterior spina iliaca superior (ASIS) and the lateral side of the patella. The ASIS is the hip bone; palpate it by placing the hand on either side of the abdomen below the umbilicus.
- With a tape measure, measure the distance between the two locations identified above and take 2/3 of that value on the line from the ASIS to the lateral side of the patella. Note: Further information regarding placement of EMG electrodes can be found on the SENIAM (Surface Electromyography for the Non-Invasive Assessment of Muscles) URL: http://www.seniam.org/
3. Placement of the EMG Electrodes
- After the location of the vastus lateralis has been identified, take the EMG electrodes (most researchers use commercially available disposable Ag-Ag Cl electrodes) and place over the vastus lateralis without removing the adhesive shield. Then with a pen mark the area where the gel portion of the electrode makes contact with the muscle. Ensure that the interelectrode distance is 20 mm center-to-center.
- Use a piece of sandpaper (60 coarse) to gently abrade these two areas to remove the superficial layer of the skin. During this time, ask the participant their level of discomfort. Stop abrading when the participant indicates the area is warm.
- Clean the abraded areas with a towel that is dampened with rubbing alcohol or an alcohol swab. Allow the area on the leg to dry before placing the EMG electrodes.
- Place the EMG electrodes on the sites that were abraded (Figure 2). Take care not to place the electrodes on the iliotibial band (IT band). Ask the participant to contract the quadriceps femoris muscles in order to palpate the vastus lateralis. Place the electrodes on the muscle to ensure it is not on the IT band. Note: If the electrodes on the IT band, the EMG signal would be dampened when the participant is asked to maximally contract.
- Place the reference electrode (3rd electrode) on a boney attachment site such as the ASIS thus not interfering with movement of the lower limbs during the exercise bout.
4. Checking the EMG Signal
- Prior to starting the exercise test, check the interelectrode impedance.
Note: This step is critical because if the signal has too much noise then the EMG data collected during the exercise test will be invalid.- Have the participant sit in a chair and connect the EMG leads to their respective electrodes attached to the participant’s leg.
- At this point, have the participant relax their leg, having no tension in the muscle. Then after about 30 sec of relaxation, have the participant maximally contract their quadriceps femoris muscles for 5 sec and then go back to being completely relaxed.
- When performing the task above (step 4.1.2), record the participants EMG signal on the computer.
- Ensure that the interelectrode impedance is <2,000 ohms. Moreover, if a voltmeter is available in the laboratory, then check the baseline noise and keep below 5 µV. In addition, set the sampling frequency at 1,000 Hz.
5. Setting-up the Cycle Ergometer
- After checking the interelectrode impedance, have the participant move from the chair to the cycle ergometer.
- Have the participant stand next to the cycle ergometer and raise their knee until the thigh is parallel with the ground. Then have the participant hold this position and adjust the seat height to match the same height as the participant’s thigh.
- Thereafter, have the participant sit on the cycle ergometer seat and then pedal a couple times while asking them if they are comfortable with the seat height. If needed, adjust the seat height.
- Ensure that the participant’s legs are near full extension with a slight bend (~5°) in the knees during each pedal revolution.
- Before starting the test, have the participant wear a polar heart rate monitor so that heart rate can be documented throughout the exercise test.
6. Performing the EMG Fatigue Threshold Protocol
- Have the participant start cycling and gradually increase their cadence to 70 revolutions/min. Then increase the power output on the cycle ergometer to 50 W.
- Have the participant cycle at this power output for approximately 2-3 min.
Note: This is a low intensity exercise and will serve as the warm-up. - After the warm-up period, increase the power output by 25 W every 2 min until the participant is no longer able to maintain the 70 revolutions/min cadence or requests that the test be stopped.
Note: It should be noted that during the exercise test, the EMG signal is recorded for 10 sec epochs during each 2 min stage for sec 10–20, 30–40, 50–60, 70–80, 90–100, and 110-12021. Most EMG systems will have an option to set the automatic recording at the desired interval. Thus, for each stage there should be 6 data files. - Once the incremental test has concluded, have the participant perform a cool down at 50 W. Check that the length of the cool down corresponds with having the participant’s heart rate return to the value during the warm-up phase. Monitor this by checking the participant’s heart rate using the polar heart rate monitor.
- Once the cool down is completed, remove the EMG leads and have the participant step off the cycle ergometer and return to the chair. Then carefully remove the EMG electrodes and wipe the areas with a clean towel dampened with rubbing alcohol or an alcohol swab.
7. Processing the EMG Signal
- After the test is completed, process the raw EMG data files that were collected during the exercise test so that the data can be used to determine the EMG fatigue threshold.
- Perform processing of the EMG signal with either the software used to collect the EMG signal or custom written software using various platforms such as MATLAB or LabVIEW.
- Filter the collected EMG signals using a band-pass filter. Use a setting of 10 to 500 Hz. Note: This alters the frequency of the signal so that low frequency artifacts due to movement of the EMG leads (<10 Hz), and high frequency artifacts from the environment (>500 Hz), are removed. Use a notch filter of 60 Hz if there is any interference from the power supply of the computer or EMG system.
- Once the signal has been filtered, determine the signal amplitude by calculating the root mean square value of the signal: Square each of the data points, sum them, divide by the number of data points, then take the square root of the resulting value. Perform these calculations using the aforementioned software.
8. Determining the EMG Fatigue Threshold for Each Participant
- Perform the following steps for each participant.
- After the EMG signal has been processed; use a statistical program (e.g.: GraphPad Prism) and label the first column “Time” and the subsequent columns with the power outputs used for the test.
- For each power output, fill-in the corresponding EMG amplitude value for each 20 sec interval.
- For each power output, analyze the time (x-axis) vs EMG amplitude (y-axis) relationship with linear regression to determine if the slope of the regression line is significantly (p <0.05) different from zero.
- After performing the linear regression analyses for all power outputs, identify the highest power output with a non-significant (p >0.05) slope.
- Then identify the lowest power output with a significant (p <0.05) slope.
- Once these two power outputs have been identified, add them and divide by 2; the resultant power output is the estimated EMG fatigue threshold.
Representative Results
As shown in Figure 1, for a single participant, each power output that is completed has six data points that represent the EMG amplitude for the vastus lateralis muscle. Therefore, in this example, the highest power output with a non-significant (p >0.05) slope is 200 watts, whereas the lowest power output with a significant (p <0.05) slope is 225 W. Therefore, for this participant the EMG fatigue threshold is 213 W. Once the EMG fatigue threshold is determined for each participant then inferential statistics can be performed.
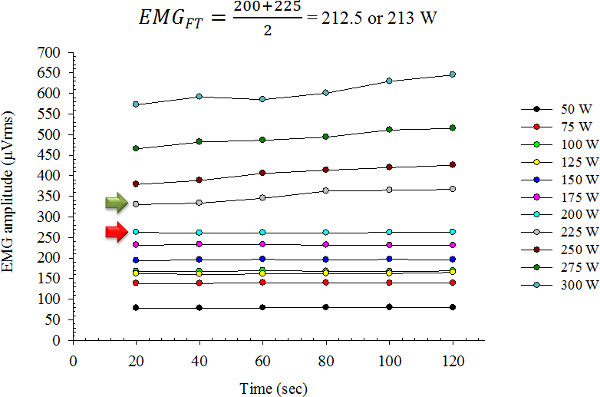
Figure 1: Representative results for a single participant. Linear regression was performed for the EMG amplitude versus time relationship for each power output. The power output indicated by the red arrow (200 W) is the highest power output with a non-significant (p >0.05) slope, whereas the power output indicated by the green arrow (225 W) is the lowest power output with a significant (p <0.05) slope. The average of these two power outputs equal 213 W, which is the EMGFT.
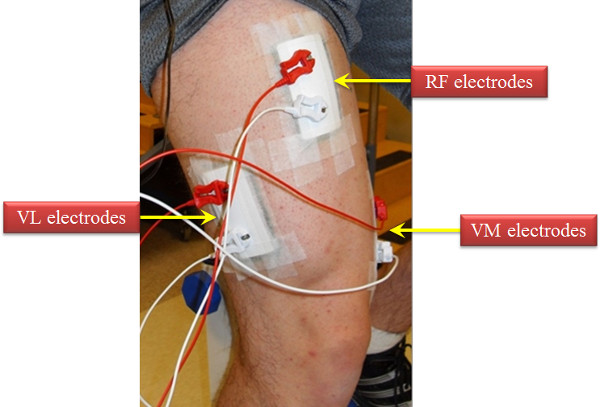
Figure 2: Depiction of the electrode arrangement for the vastus lateralis muscle. In addition, we have provided a visual of where the EMG electrodes are placed for the rectus femoris and vastus medialis muscles. Specific directions for EMG electrode placed can be found on the following website: http://www.seniam.org.
Discussion
We here present a method for determining neuromuscular fatigue in the quadriceps femoris muscles for dynamic exercise. This method provides a straightforward and non-invasive approach to using surface EMG. Moreover, the versatility of this method is that researchers can adapt it to other modes of exercise such as the treadmill20.
Theoretically, for intensities at or below the EMG fatigue threshold the participant should be able to sustain the exercise workbout indefinitely12,13. Briscoe et al.8 validated the EMG fatigue threshold for cycle ergometry. On separate occasions each participant exercised at 70%, 100%, and 130% of their EMG fatigue threshold. The authors found that for 70% and 100% of the EMG fatigue threshold participants did not have increased EMG amplitude during the exercise workload8. For the workload at 130% of EMG fatigue threshold, however, participants exhibited a significant increase in EMG amplitude8. Briscoe et al.8 concluded that the EMG fatigue threshold for cycle ergometry was a valid protocol to determine neuromuscular fatigue during continuous exercise.
With regard to critical steps in the protocol and troubleshooting consider the following. If there is too much noise in the EMG signal when performing step 4.1.2 then first check the connection between the EMG electrodes and the device recording the signal. Oftentimes, the EMG leads may not be connected properly to the EMG electrode. Second, the areas where the electrodes are placed need to be free of any hair and feel smooth to the touch rather than rough (i.e., shaving stubbles). Therefore, ensure that all hair is thoroughly removed in locations where the EMG electrode will be placed. Also, it is important to clean the area once the abrading is completed. Again, the goal is to have a clean and smooth surface. Third, the center area of the EMG electrode should not be dry and if so use conductance gel (such as those used for ultrasound) as a supplement. Make sure to use the gel sparingly, because excess gel may interfere with the adhesiveness of the EMG electrode. Taken together, these items are common culprits which increase the noise in the EMG signal and thus contaminating the data.
Although the EMGFT protocol is versatile there are potential limitations to its application in a clinical setting. For example, certain clinical populations may not tolerate the testing protocol. That is, while the increase in workload can be modified (i.e., 5 W instead of 25 W per stage) patients with severe respiratory and/or cardiac illnesses may prematurely fatigue during the initial stages of the test. Another potential limitation is that the quadriceps femoris muscles are all activated during cycle ergometry; however, the EMG signal is being recorded from only one of these muscles. To date, no studies have determined the EMGFT across the three superficial quadriceps femoris muscles for cycle ergometry to identify whether there are differences between muscles.
In summary, the method of estimating the EMG fatigue threshold from a single incremental exercise test is a useful tool for assessing neuromuscular fatigue during dynamic exercise. Moreover, this test provides an objective method of determine of the efficacy of various interventions that attenuate muscle fatigue.
Disclosures
The authors have nothing to disclose.
Acknowledgements
This project was funded by, in part, by start-up funds from Wayne State University to M.H. Malek.
Materials
| 839 E Monark cycle ergometer | Monark Exercise AB | 839 E | |
| Heart rate monitor | Polar | Polar H1 | |
| Laptop | Dell Inspiron | varies | any laptop computer with USB slots should work. |
| EMG amplifiers | BioPac Systems, Inc. | 100B | 100C are the latest version |
| Disposable EMG electrodes | BioPac Systems, Inc. | EL-500 | |
| Sandpaper | Home Depot | 9 in. x 11 in. 60 Grit course no-slip grip Advanced Sandpaper (3-Pack) |
References
- Hendrix, C. R., et al. Comparison of critical force to EMG fatigue thresholds during isometric leg extension. Medicine and science in sports and exercise. 41, 956-964 (2009).
- Herda, T. J., et al. Quantifying the effects of electrode distance from the innervation zone on the electromyographic amplitude versus torque relationships. Physiological measurement. 34, 315-324 (2013).
- Ryan, E. D., et al. Inter-individual variability among the mechanomyographic and electromyographic amplitude and mean power frequency responses during isometric ramp muscle actions. Electromyography and clinical neurophysiology. 47, 161-173 (2007).
- Beck, T. W., et al. The influence of electrode placement over the innervation zone on electromyographic amplitude and mean power frequency versus isokinetic torque relationships. Journal of neuroscience. 162, 72-83 (2007).
- Beck, T. W., Stock, M. S., DeFreitas, J. M. Time-frequency analysis of surface electromyographic signals during fatiguing isokinetic muscle actions. Journal of strength and conditioning research / National Strength, & Conditioning Association. 26, 1904-1914 (2012).
- Evetovich, T. K., et al. Mean power frequency and amplitude of the mechanomyographic signal during maximal eccentric isokinetic muscle actions. Electromyography and clinical neurophysiology. 39, 123-127 (1999).
- Blaesser, R. J., Couls, L. M., Lee, C. F., Zuniga, J. M., Malek, M. H. Comparing EMG amplitude patterns of responses during dynamic exercise: polynomial versus log-transformed regression. Scandinavian journal of medicine, & science in sports. In press, (2015).
- Briscoe, M. J., Forgach, M. S., Trifan, E., Malek, M. H. Validating the EMGFT from a single incremental cycling testing. International journal of sports medicine. 35, 566-570 (2014).
- Zuniga, J. M., et al. Neuromuscular and metabolic comparisons between ramp and step incremental cycle ergometer tests. Muscle. 47, 555-560 (2013).
- Mastalerz, A., Gwarek, L., Sadowski, J., Szczepanski, T. The influence of the run intensity on bioelectrical activity of selected human leg muscles. Acta of bioengineering and biomechanics / Wroclaw University of Technology. 14, 101-107 (2012).
- Basmajian, J. V., De Luca, C. J. . Muscles alive, their functions revealed by electromyography. , (1985).
- Vries, H. A., Moritani, T., Nagata, A., Magnussen, K. The relation between critical power and neuromuscular fatigue as estimated from electromyographic data. Ergonomics. 25, 783-791 (1982).
- Vries, H. A., et al. A method for estimating physical working capacity at the fatigue threshold (PWCFT). Ergonomics. 30, 1195-1204 (1987).
- Vries, H. A., et al. Factors affecting the estimation of physical working capacity at the fatigue threshold. Ergonomics. 33, 25-33 (1990).
- Astrand, I. The physical work capacity of workers 50-64 years old. Acta physiologica Scandinavica. 42, 73-86 (1958).
- Hettinger, T., Birkhead, N. C., Horvath, S. M., Issekutz, B., Rodahl, K. Assessment of physical work capacity. Journal of Applied Physiology. 16, 153-156 (1961).
- Smith, J. L., Karwowsk, W. . International encyclopedia of ergonomics and human factors. , (2006).
- Kenny, G. P., Yardley, J. E., Martineau, L., Jay, O. Physical work capacity in older adults: implications for the aging worker. American journal of industrial medicine. 51, 610-625 (2008).
- Matsumoto, T., Ito, K., Moritani, T. The relationship between anaerobic threshold and electromyographic fatigue threshold in college women. European journal of applied physiology. 63, 1-5 (1991).
- Guffey, D. R., Gervasi, B. J., Maes, A. A., Malek, M. H. Estimating electromygraphic and heart rate fatigue threshold from a single treadmill test. Muscle. 46, 577-581 (2012).
- Camic, C. L., et al. The influence of the muscle fiber pennation angle and innervation zone on the identification of neuromuscular fatigue during cycle ergometry. Journal of electromyography and kinesiology : official journal of the International Society of Electrophysiological Kinesiology. 21, 33-40 (2011).
