Drug-Induced Sleep Endoscopy (DISE) with Target Controlled Infusion (TCI) and Bispectral Analysis in Obstructive Sleep Apnea
Summary
The aim of this study was to establish a standardized protocol for sleep endoscopy to differentiate obstruction patterns in obstructive sleep apnea (OSA). Target-controlled infusion (TCI) of the sedative was combined with real-time monitoring of the depth of sedation using bispectral analysis.
Abstract
The aim of this study was to establish a standardized protocol for drug-induced sleep endoscopy (DISE) to differentiate obstruction patterns in obstructive sleep apnea (OSA). Target-controlled infusion (TCI) of the sedative propofol was combined with real-time monitoring of the depth of sedation using bispectral analysis.
In an observational study 57 patients (mean age 44.8 years, ± SD 10.5; mean apnea hypopnea Index (AHI) 30.8/hr, ± SD 21.6, mean BMI 28.2 kg/m2, ± SD 5.3) underwent cardiorespiratory polysomnography followed by DISE with TCI and bispectral analysis. Sleep was induced solely by the intravenous infusion of propofol with a TCI-pump, with an initial target plasma level of 2.0 µg/ml. Under continuous monitoring of the patient's respiration, state of consciousness and value of the bispectral analysis, the target plasma propofol level was raised in steps of 0.2 µg/ml/2 min until the desired depth of sedation was reached. The mean value of the bispectral analysis at the target depth of sedation was determined and the obstruction patterns during DISE-TCI-bispectral analysis then classified according to the VOTE-system. Subsequently the results were analyzed according to polysomnographic and anthropometric data. The occurrence of multilevel obstruction sites across all degrees of severity of OSA clarifies the need for sleep endoscopy prior to upper airway surgery.
The advantage of this technique is the reproducibility of the protocol even for heterogeneous groups of patients. In addition, the gradual controlled and standardized increase of the plasma level of propofol with real-time control of the bispectral index leads to a precisely controllable depth of sedation. The DISE-TCI-bispectral analysis procedure is a step towards a required reproducible protocol of sleep endoscopy — capable of standardization. However it is not yet known whether these observed obstruction patterns also correspond to findings in natural sleep.
Introduction
Obstructive sleep apnea (OSA) is characterized by repetitive phases of complete (apnea) or partial (hypopnea) collapse of the upper airways during sleep. These phases are often associated with arterial oxygen desaturation and a fragmentation of sleep caused by arousals. The reported prevalence of OSA with accompanying daytime symptoms in the general population is 3 – 7% in men and 2 – 5% in women1. The gold standard in the treatment of moderate to severe OSA is nasal continuous positive airway pressure (nCPAP), for which compliance is internationally reported as about 40 – 60%2. This treatment is used by 29 – 83% of OSA patients on a regular basis for less than 4 hr3. Both positive and negative predictors regarding long-term compliance of CPAP-use are well known nowadays4. In addition, emotional and clinical side effects often considerably reduce compliance. Alternative treatment options such as upper airway surgery therefore play an important role in OSA therapy. However, the fact that the success rate of surgery (responder rate) is relatively low in comparison with ventilation therapy is problematic 5,6.
It was hoped that the introduction of sleep endoscopy by Croft and Pringle in 1991 would not only provide further insights into the pathophysiology of OSA but also might improve the responder rate through individualized surgical treatment7. As early as 2011, studies by De Vito et al. demonstrated the advantage of using investigative techniques based on target-controlled infusion (TCI) and bispectral analysis with respect to safety, stability and accuracy8. In the meantime, the validity and reliability of sleep endoscopy have been established and, ever since the 2014 European Position Paper, it is on the road to standardization9-11. The aim of the present study is to establish a standardized protocol for sleep endoscopy by target-controlled infusion of the sedative propofol, combined with real-time monitoring of the depth of sedation using bispectral analysis, in order to differentiate obstruction patterns according to OSA-severity.
CASE PRESENTATION:
Study Design:
The retrospective study was conducted in the Department of Otorhinolaryngology, Head & Neck Surgery of the Friedrich-Alexander University Erlangen-Nürnberg between September 2012 and November 2014, following approval by the local Ethics Committee. All 57 participating patients, aged 20 to 73 years, were recruited by the Department of Otorhinolaryngology, Head and Neck Surgery. 52 patients were men and 5 women. In addition to a standardized interview, they were examined by an otorhinolaryngologist and underwent an awake endoscopy to assess the upper airways. Cardiorespiratory polysomnography was then undertaken in the Department's sleep laboratory to enable an exact classification of their sleep-related breathing disorder. The OSA severity was classified as mild (AHI 5 – 15/hr), moderate (AHI > 15 < 30/hr) or severe (AHI > 30/hr), according to the criteria of the American Academy of Sleep Medicine Task Force12. The indication for sleep endoscopy was established in the context of a planned surgical intervention of the upper airways (primary indication) or in the case of nCPAP non-compliance (secondary or adjuvant indication).
Inclusion criteria for this study were men and women aged 18 – 75 years with mild, moderate or severe OSA diagnosed by polysomnography. Exclusion criteria were an American Society of Anesthesiologists Classification (ASA) IV/V, central sleep apnea, positive history of misuse of sedatives, alcohol or addictive drugs, allergy to propofol, pregnant women.
Diagnosis, Assessment, and Plan:
Cardiorespiratory polysomnography (PSG):
Polysomnography was carried out with a 33-channel cardiorespiratory diagnostic system. The technical procedure for the polysomnographic diagnostics followed the recommendations of the American Academy of Sleep Medicine (AASM) in the standardized technique using an electroencephalogram (EEG; F4-M1, C4-M1, O2-M1), right and left electro-oculogram, electromyogram of the mentalis and tibialis muscles, nasal pressure cannula, thoracic and abdominal respiratory effort sensors (inductive plethysmographs), body position sensors, pulse oximetry, snoring microphone, a one-channel ECG and an infrared video recording13. The evaluation was performed according to the AASM Criteria (Version 2.0, 2012) and was undertaken by an accredited medical sleep specialist of the German Sleep Society (DGSM)13, 14. After polysomnography had confirmed OSA, all 57 patients underwent a standardized propofol-based Drug-Induced Sleep Endoscopy (DISE) with TCI and bispectral analysis (DISE-TCI-bispectral analysis).
Preoperative preparations:
Due to the muscle relaxant effect, no premedication with benzodiazepines was given in the case of sleep endoscopies undertaken solely for diagnostic purposes. If the sleep endoscopy was performed during a planned surgical procedure, clonidine was used for premedication as an alternative for benzodiazepines, taking the corresponding contraindications into account.
Classification of the obstruction:
The VOTE system was used for classification purposes15. The following sites of obstruction were considered: velum, oropharynx (lateral oropharyngeal walls, tonsils), tongue base and epiglottis. Obstruction severity was divided into three grades (no obstruction; partial and complete obstruction). The configuration of the obstruction was divided into anterior-posterior, lateral and concentric.
Target-controlled infusion (TCI):
Target-Controlled Infusion (TCI) describes the infusion of drugs using microchip-controlled infusion pumps to achieve a target concentration in the blood. The aim of this method is the rapid achievement and maintenance of a certain effect (e.g., sedation) based on a specified (defined) plasma level or an effect level in the case of effect-site TCI. Calculation of the plasma level or effect-site level is based on pharmacokinetic 3-compartment models (according to Marsh or Schnider) that use the pharmacological half-life values and distribution coefficients determined in a volunteer population16-18. The infusion rates needed to rapidly achieve and maintain the specified target level of propofol in plasma are then automatically calculated and controlled by the infusion pump. The present study used a system consisting of an infusion pump and a data manager together with the pre-programmed pharmacokinetic model of Marsh. The objective depth of sedation was simultaneously monitored by bispectral analysis.
Bispectral analysis:
The bispectral analysis/index is correlated with electrical activity in the brain. The monitor of bispectral analysis records frontal EEG signals and, with the help of various proprietary algorithms, analyzes the distribution of the EEG power spectrum. The bispectral index is a dimensionless number between 0 and 100 19. In general, a value around 90 reflects a preponderance of high-frequency beta-waves and indicates that the patient is awake. Bispectral analysis values below 10 are indicative of EEG suppression 20, 21. This scale therefore provides an indirect measurement of the effect of sedatives on the brain. In order to maintain an adequate depth of anesthesia and avoid an undesirable intraoperative awakeness of the patient, a bispectral index of < 60 is recommended. On the other hand, values of the bispectral index of < 40 should be avoided, in order to prevent unnecessarily deep anesthesia.
All sleep endoscopies were performed by two experienced otorhinolaryngology consultants with additional qualifications in sleep medicine (T. M. 59.6% (34/57), A. F. 40.4% (23/57).
Protocol
The protocol follows the guidelines of the local ethics committee of the Friedrich-Alexander University Erlangen-Nürnberg (FAU).
1. DISE-TCI-Bispectral Analysis Procedure
- Perform venipuncture and place an IV catheter in the patients left back of the hand or median cubital vein to obtain intravenous access to administer the sedative.
- Carry out the investigation at room temperature (22 °C).
- Bring the awake patient into the operating theater. Place the patient in the supine position on the operating table.
- Following this, have the anesthesiologist connect the monitoring system of vital signs. Monitor the patient during the whole procedure by peripheral pulse oximetry, 3-channel ECG and non-invasive blood pressure measurement at 3-min intervals.
- Ensure that both the anesthesiologist and the anesthetic equipment are on the left side of the patient.
- Have the anesthesiologist place and fix the single-use sensor for bispectral analysis.
- To do this, wipe skin with disinfectant and let it dry.
- Position sensor (4 interconnected and adhesive electrodes) diagonally on the patient's forehead: one electrode (number 1) at center of forehead, electrodes 2 and 3 directly above eyebrow and electrode 4 on temple between corner of eye and hairline.
- Connect sensor via interface cable to the bispectral analysis-monitor. Press electrodes firmly and ensure that the automatic sensor test is passed.
- Have the anesthesiologist enter patients' individual sex, age, height, weight and plasma target concentration of propofol into the data manager with the pre-programmed pharmacokinetic model of Marsh17.
NOTE: According to this model, the TCI-data manager calculates the infusion rates of propofol and operates the connected TCI-infusion pump to establish and automatically maintain the set target plasma concentration. - Dim the light in the operating room.
- Induce sleep solely by the intravenous infusion of propofol with the TCI-infusion pump with an initial target plasma level of 2.0 µg/ml.
- Under continuous monitoring of the patient's respiration, state of consciousness and value of the bispectral analysis, raise the target plasma propofol level in steps of 0.2 µg/ml/2 min until the desired depth of sedation is reached.
NOTE: The target depth of sedation is a sleeping patient (eyes closed), with maintained spontaneous breathing and / or starting to snore and / or obstructive apnea observed by the examiner with the endoscope or the anesthesiologist. - Record manually the mean value of the bispectral analysis at the target depth of sedation.
- Have the examiner with the endoscope stand at head level on the right side next to the patient.
- At the target depth of sedation insert a flexible fiber endoscope transnasally via the inferior nasal meatus.
- Film the endoscopic examination and store digitally. Use the image acquisition system according to manufacturer's instructions.
NOTE: In case of nasal septal deviation or hypertrophy of the inferior turbinates, the inferior meatus with the larger diameter should be chosen. - Examine the upper airways by videoendoscopy in a proximal to distal direction from the nasopharynx as far as the hypopharyngeal entrance.
- Classify the obstruction site(s) (velum, oropharynx, tongue base, epiglottis) and configuration/obstruction pattern (anterior-posterior, lateral, concentric) and the degree/severity (no obstruction/no vibration, partial obstruction/vibration, complete obstruction/collapse) according to the VOTE system at the target depth of sedation15.
- In the case of isolated sleep endoscopy, terminate sedation of the patient by stopping the propofol infusion after completing the endoscopic examination.
- In the case of sleep endoscopy as part of a planned surgical procedure, let the anesthesiologist perform total intravenous anesthesia by starting infusion of opioids (e.g., using remifentanil in TCI mode) and increasing infusion of propofol (e.g., set TCI level to 4 µg/ml) until loss of consciousness. Inject muscle relaxant (e.g., rocuronium) and intubate the patient.
Representative Results
Characteristics of the patients are shown in Table 1. The mean value of the bispectral analysis at the desired depth of sedation was 60 (± SD 10.4, range 35 – 80; 95% confidence interval 42.0 – 47.6). Single or multiple combined sites of obstruction were found across all levels of OSA severity. The identified sites of obstruction, in decreasing order of frequency, were: velar 59.6% (34/57), tongue base 43.9% (25/57), oropharynx 42.1% (24/57) or at the level of the epiglottis 29.8% (17/57). Velar or oropharyngeal obstructions, in each case isolated or in combination, were seen in 49.1% (28/57) of patients. 38.6% (22/57) of all OSA patients showed a single site of obstruction and 61.4% (35/57) at least two sites. The configuration of the obstruction sites differed depending on OSA severity (Figure 1).
Mild OSA
Characteristics of the patients are shown in Table 1. Among the patients with mild OSA, more than half (53.8% (7/13)) showed complete obstruction at a single site (Figure 2). Two or more obstruction sites were present in 46.2% (6/13).
Moderate OSA
Characteristics of the patients are shown in Table 1. Over half of the patients (52.6% (10/19)) with moderate OSA had a solitary complete obstruction (Figure 3), with 47.4% (9/19) showing obstruction at two or more sites.
Severe OSA
Characteristics of the patients are shown in Table 1. Only 20.0% (5/25) of the patients with severe OSA showed obstruction at a single site (Figure 4) and in marked contrast to the groups with mild or moderate OSA, obstructions at two or more sites were present in 80.0% (20/25) of the patients in the severe OSA group. A combination of velar and/or oropharyngeal obstruction was found in 40% (10/25) of the severe OSAS patients. In 44% (11/25) velar obstructions were combined with other obstruction sites (tonsils, tongue base, epiglottis). 48% (12/25) of the severe OSAS patients displayed obstruction at the level of the tongue base and this obstruction was combined with one at another site in 91.7% (11/12) of them. Likewise, oropharyngeal obstruction was combined in 91.7% (11/12) of cases with obstruction at another location. The epiglottis was the site of at least one obstruction in 52% (13/25) of cases. 40% (10/25) of the patients with severe OSA also showed coexistent obstructions at the level of the tongue base. Analysing solely velum obstruction patterns showed a marked decrease of anterior-posterior collapses from mild and moderate (90%) to severe OSA (50%). In contrast, a substantial increase of concentric obstructions emerges from mild (0%) to moderate (10%) to severe OSA (36%) whereas the ratio of partial and complete velum obstruction seems to be independent of OSA severity (mild OSA: 60%/40%; moderate OSA: 60%/40%; severe OSA: 57%/43%) (Figure 5).
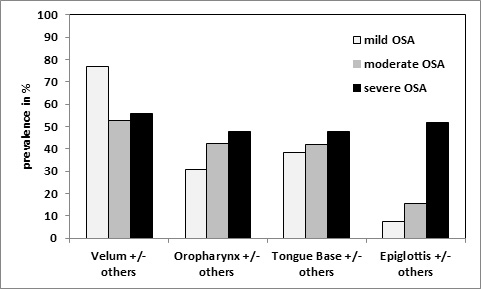
Figure 1: Prevalence (in %) of Obstruction Patterns (x-axis) According to OSA Severity. Due to the fact that every single obstruction site can occur multiple times within a multi-level collapse, more than 100% can be achieved cumulatively according to each grade of OSA. Please click here to view a larger version of this figure.
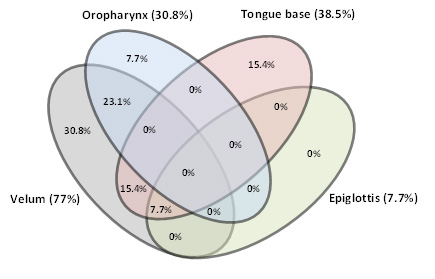
Figure 2: Mild OSA. Venn diagram showing all possible relations of upper airway obstruction sites (prevalence in % and ratio of upper airway obstruction sites). Please click here to view a larger version of this figure.
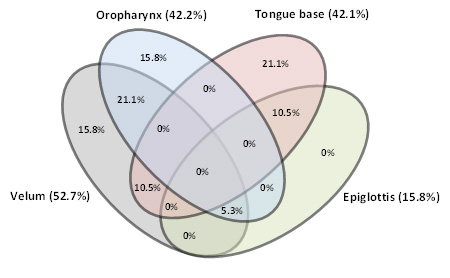
Figure 3: Moderate OSA. Venn diagram showing all possible relations of upper airway obstruction sites (prevalence in % and ratio of upper airway obstruction sites). Please click here to view a larger version of this figure.
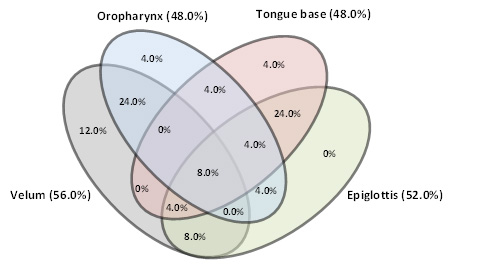
Figure 4: Severe OSA. Venn diagram showing all possible relations of upper airway obstruction sites (prevalence in % and ratio of upper airway obstruction sites). Please click here to view a larger version of this figure.
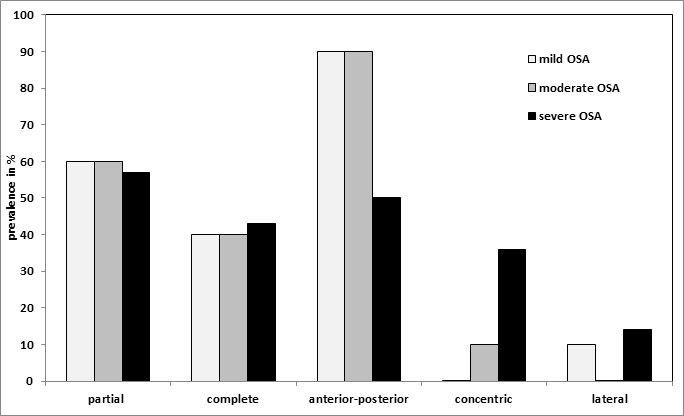
Figure 5: Prevalence (in %) of Velum Obstruction Patterns (x-axis) According to OSA Severity. Please click here to view a larger version of this figure.
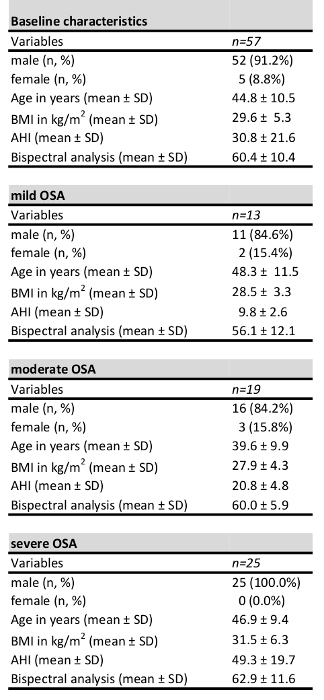
Table 1: Patient Characteristics. SD= standard deviation, BMI=Body Mass Index (kg/m2), AHI=Apnea Hypopnea Index (/hr).
Discussion
The first experiments using flexible fiber optic rhinopharyngolaryngoscopy during spontaneous sleep to detect the site of obstruction was described as early as the 1970s22. However, the roots of this investigative technique were initially of a purely descriptive pathophysiological nature. During the establishment of surgical techniques to treat OSA, such as uvulopalatopharyngoplasty (UPPP) by Fujita, it was, however, shown that the success of the operation was apparently dependent on a careful preoperative selection of patients23. The introduction of drug-induced sleep endoscopy (DISE) by Pringle and Croft in 1991 led to the first-ever objective method of patient selection and the resulting individualized treatment concept in OSA patients7. In subsequent years, the world-wide popularity of DISE increased and numerous sleep endoscopy protocols were published. Due to numerous controversial discussions over the years about patient selection, choice of sedative, classification of the obstruction, validity, reliability, applicability of the results to spontaneous sleep, etc., it has been impossible to establish a standard protocol for the procedure. One small milestone was the publication in 2014 of the European Position Paper on DISE, which is supposed to serve as the first approach to the standardization of this examination technique11.
The DISE procedure described in this study goes one step further in the standardization process, in that it combines the two standardizable techniques of TCI and bispectral analysis. The patient-individualized pharmacokinetic and dynamic monitoring of the sedative (propofol) as part of TCI enables the desired depth of sedation to be achieved with the help of bispectral monitoring. Our mean results of the bispectral analysis (60 ± 10.4) correspond to the already described target corridor of 50 – 70 11. A standardized TCI protocol that is based on a population pharmacokinetic model for propofol, also enables sedation specific to a patient's weight, height, sex and age. That is the fundamental requirement in order for results to be reproducible and hence comparable with future investigations of different centers.
Alternatively to monitoring of the bispectral index, EEG-analysis could be performed to control for depth of sedation. However, raw EEG data is difficult to interpret and prone to bias by inter- and intra-individual variations. The advantage of the bispectral index is the fact that it is a dimensionless number between 0 and 100 and independent of any examiner's interpretation. Moreover, processed parameters obtained by EEG power spectrum analysis like median or spectral edge frequency, are much less used and evaluated in intraoperative settings as compared to monitoring of the bispectral index. Therefore, bispectral analysis is currently the best clinically evaluated and easily obtainable parameter to judge depth of sedation and allow for comparability of study results.
As an alternative to plasma TCI mode of propofol infusion, effect-site (brain) TCI may be used. However, using this mode and the same intended target concentration, the patient would most likely be confronted with more negative side effects such as hypotension, unintentional deep sedation and apnea. This is due to exceedingly high and overshooting propofol plasma levels as a result of the implemented pharmacokinetic protocol to quickly achieve the set effect-site concentration. To avoid critical hypoxia during sleep endoscopy, a nasal oxygen catheter can be placed in the contralateral nostril and oxygen flow (3 – 5 L/min) can be adjusted to maintain adequate peripheral oxygen saturation. Unnecessary interruptions of the examination with re-oxygenation of the patient can be prevented in this way.
The value of preoperative sleep endoscopy can be indirectly measured from the success rates of UPPP — which is widely performed as the classical soft palate operation — and also that of multilevel surgery. In the current literature, the average reported success rate of UPPP in non-selected patients is between 33% and 50% 5. In the selected group with clinically suspected obstruction exclusively at the level of the soft palate, the reported success rate is 52.3% 5. In our investigation, across all levels of OSA severity we observed 49.1% (28/57) obstructions at the level of the velum or oropharynx or both. This would confirm the UPPP responder rate in the literature, both in selected and non-selected patient groups of < 50%.
In terms of invasive, multilevel surgery, the surgical success rate (according to Sher) described in the German S2e-guideline is approximately 53.8% 5,6. The results of this meta-analysis are based on a total of 66 retrospective studies and prospective case series with a mean AHI 40.17. The most interesting fact is that a sleep endoscopy was performed only in three of the 66 studies (4.5%). In the remaining studies, the only technique to detect the sites of obstruction was a rigid optic or flexible rhinopharyngolaryngoscopy in wake and sometimes seated patients although it could be shown in various studies that the investigation in wake patients underestimates the obstruction pattern, particularly at the level of the tongue base, epiglottis and hypopharynx 24, 25. Applying the results of our study on the patients treated with multi-level surgery in the German S2e-guideline, at least one obstruction site at the epiglottis should be expected in 52% of patients with severe OSA. The poor responder-rate of 53.8% in multi-level surgery may therefore suggest that the potential obstruction site "epiglottis" might sometimes have been underdiagnosed and consecutively undertreated. In conclusion this is another argument in favor of a pre-interventional sleep endoscopy, especially in patients with severe OSA.
The limiting factor of the VOTE-classification, however, is the fact that it does not differentiate between a primary (epiglottis collapsing independently) or a secondary (epiglottis is pushed posteriorly by the tongue base with consecutive airway obstruction due to the epiglottal suction phenomenon) epiglottal collapse. In our population we could find an increasing prevalence of primary and secondary epiglottal collapse in mild (0%; 7.7%), moderate (5.3%; 10.5%) and severe OSA (12%; 40.0%).
If the results of our investigations are compared with those of a Belgian study of 1,249 sleep endoscopies, it is clear that despite our comparatively small group, both the distribution and the frequencies of the obstruction sites appear reproducible (palatal/velar: 81% Vroegop et al. vs. 59.6%; tongue base: 46.6% Vroegop et al. vs. 43.9%; hypopharyngeal/epiglottis: 38.7% Vroegop et al. vs. 29.8%, multi-level: 68.2% Vroegop et al. vs. 61.4%)26. However, the transferability of the results still remains problematic, because sedation in the Belgian study was achieved with midazolam (a muscle-relaxing benzodiazepine with respiration-depressant effects) and propofol. In addition, the depth of sedation was not measured objectively — which further limits the comparability of the results. This is another reason for advocating further standardization of sleep endoscopy. Furthermore, it still has to be shown that the results obtained with sleep endoscopy and their influence on the treatment decision, ultimately also lead to an improvement in the surgical outcome. A limiting factor of our protocol is the fact that there exists no data comparing obstruction patterns in DISE with obstruction patterns in natural sleep. This should be subject of future investigations, for example, by means of comparing obstruction patterns during DISE with obstruction patterns during magnetic resonance imaging in natural sleep.
The fact that a multilevel obstruction is present in 80% of cases of severe OSA, with over half of the cases (52%) showing epiglottal involvement, illustrates the need for sleep endoscopy prior to planned upper airway surgery. This is also true in terms of improving the postoperative outcome. The DISE-TCI-bispectral analysis procedure is a step towards a required reproducible protocol of sleep endoscopy — capable of standardization. However it is not yet known whether these observed obstruction patterns also correspond to findings in natural sleep.
Disclosures
The authors have nothing to disclose.
Acknowledgements
The authors are grateful to Philipp Grundtner for his help with the statistical analyses.
Materials
| Cardiorespiratory polysomnography | |||
| SOMNOscreen | SOMNOmedics, Randersacker, Germany | SBT202 | |
| Sedation | |||
| Propofol-Lipuro 20 mg/mL; 2,6-diisopropylphenol | B. Braun Melsungen AG, Melsungen, Germany | ||
| Target-controlled infusion (TCI) | |||
| Infusion pump Orchestra Module DPS Visio | Fresenius Kabi, Germany GmbH | Z082420 | |
| Data manager Orchestra Base Primea | Fresenius Kabi Germany GmbH | Z081320 | |
| Bispectral analysis (BIS) | |||
| BIS single-use electrode BIS Quatro Sensor | Covidien, Neustadt/Donau, Germany GmbH | 186-0106 | |
| BIS monitor BIS VISTA | Covidien, Neustadt/Donau, Germany GmbH | 186-0210 | |
| Endoscope | |||
| Laryngo fiberscope, length 30 cm, diameter 3.5 mm | KARL STORZ GmbH & Co. KG, Tuttlingen, Germany | 11101RP | |
| Picture Archiving System | |||
| AIDA | Karl STORZ GmbH & Co. KG, Tuttlingen, Germany | WD 200-XX | |
| Premedication | |||
| Catapresan; Clonidin-HCl 0.075 mg/0.15 mg/0.3 mg | Boehringer Ingelheim Pharma, GmbH & Co. KG, Ingelheim am Rhein, Germany |
References
- Punjabi, N. M. The epidemiology of adult obstructive sleep apnea. Proc Am Thorac Soc. 5 (2), 136-143 (2008).
- Giles, L. T., Lasserson, T. J., Smith, B., White, J., Wright, J. J., Cates, C. J. Continuous positive airways pressure for obstructive sleep apnoea in adults. Cochrane Database Syst Rev. 19 (3), (2006).
- Mayer, G., et al. Deutsche Gesellschaft für Schlafforschung und Schlafmedizin (DGSM), S3-Leitlinie. Nicht erholsamer Schlaf/Schlafstörungen. Somnologie. 13, 1-160 (2009).
- McArdle, N., Devereux, G., Heidarnejad, H., Engleman, H. M., Mackay, T. W., Douglas, N. J. Long-term use of CPAP therapy for sleep apnea/hypopnea syndrome. Am J Respir Crit Care Med. 159 (4), 1108-1114 (1999).
- Verse, T., et al. HNO-spezifische Therapie der obstruktiven Schlafapnoe bei Erwachsenen. AWMF. , (2015).
- Sher, A. E., Schechtman, K. B., Piccirillo, J. F. The efficacy of surgical modifications of the upper airway in adults with obstructive sleep apnea syndrome. Sleep. 19 (2), 156-177 (1996).
- Croft, C. B., Pringle, M. Sleep nasendoscopy: a technique of assessment in snoring and obstructive sleep apnoea. Clin Otolaryngol Allied Sci. 16 (5), 504-509 (1991).
- De Vito, A., et al. Drug-induced sleep endoscopy: conventional versus target controlled infusion techniques–a randomized controlled study. Eur Arch Otorhinolaryngol. 268 (3), 457-462 (2011).
- Kezirian, E. J., et al. Interrater reliability of drug-induced sleep endoscopy. Arch Otolaryngol Head Neck Surg. 136 (4), 393-397 (2010).
- Rodriguez-Bruno, K., Goldberg, A. N., McCulloch, C. E., Kezirian, E. J. Test-retest reliability of drug-induced sleep endoscopy. Otolaryngol Head Neck Surg. 140 (5), 646-651 (2009).
- De Vito, A., et al. European position paper on drug-induced sedation endoscopy (DISE). Sleep Breath. 18 (3), 453-465 (2014).
- . Sleep-related breathing disorders in adults: recommendations for syndrome definition and measurement techniques in clinical research. The Report of an American Academy of Sleep Medicine Task Force. Sleep. 22 (5), 667-689 (1999).
- Iber, C., Ancoli-Israel, S., Chesson, A., Quan, S. F. . The AASM Manual for the Scoring of Sleep and Associated Events: Rules, Terminology and Technical Specifications. 1st ed. , (2007).
- Berry, R. B., et al. Rules for scoring respiratory events in sleep: update of the 2007 AASM Manual for the Scoring of Sleep and Associated Events. Deliberations of the Sleep Apnea Definitions Task Force of the American Academy of Sleep Medicine. J Clin Sleep Med. 8 (5), 597-619 (2012).
- Kezirian, E. J., Hohenhorst, W., de Vries, N. Drug-induced sleep endoscopy: the VOTE classification. Eur Arch Otorhinolaryngol. 268 (8), 1233-1236 (2011).
- Ihmsen, H., Schraag, S., Kreuer, S., Bruhn, J., Albrecht, S. Target-controlled infusion. Clinical relevance and special features when using pharmacokinetic models. Anaesthesist. 58 (7), 708-715 (2009).
- Marsh, B., White, M., Morton, N., Kenny, G. N. Pharmacokinetic model driven infusion of propofol in children. Brit J Anaesth. 67 (1), 41-48 (1991).
- Schnider, T. W., et al. The influence of method of administration and covariates on the pharmacokinetics of propofol in adult volunteers. Anesthesiology. 88 (5), 1170-1182 (1998).
- Sigl, J. C., Chamoun, N. G. An introduction to bispectral analysis for the electroencephalogram. J Clin Monitor. 10 (6), 392-404 (1994).
- Avidan, M. S., et al. Anesthesia awareness and the bispectral index. New Engl J Med. 358 (11), 1097-1108 (2008).
- Kissin, I. Depth of anesthesia and bispectral index monitoring. Anesth Analg. 90 (5), 1114-1117 (2000).
- Borowiecki, B., Pollak, C. P., Weitzman, E. D., Rakoff, S., Imperato, J. Fibro-optic study of pharyngeal airway during sleep in patients with hypersomnia obstructive sleep-apnea syndrome. Laryngoscope. 88 (8), 1310-1313 (1978).
- Fujita, S., et al. Evaluation of the effectiveness of uvulopalatopharyngoplasty. Laryngoscope. 95 (1), 70-74 (1985).
- Zerpa Zerpa, ., Carrasco Llatas, M., Agostini Porras, G., Dalmau Galofre, J. Drug-induced sedation endoscopy versus clinical exploration for the diagnosis of severe upper airway obstruction in OSAHS patients. Sleep Breath. 19 (4), 1367-1372 (2015).
- Fernandez-Julian, E., Garcia-Perez, M. A., Garcia-Callejo, J., Ferrer, F., Marti, F., Marco, J. Surgical planning after sleep versus awake techniques in patients with obstructive sleep apnea. Laryngoscope. 124 (8), 1970-1974 (2014).
- Vroegop, A. V., et al. Drug-induced sleep endoscopy in sleep-disordered breathing: report on 1,249 cases. Laryngoscope. 124 (3), 797-802 (2014).
