NOTE: An overview of the general experimental workflow is depicted in Figure 1.
Caution: RTA is highly toxic for humans. Safety lab permission S2 (biosafety level 2 equivalent) is needed. Please wear gloves during the entire experiment.
1. Heterologous Expression of His-tagged RTA in Escherichia coli
- Transform E. coli cells with the expression plasmid pET24-RTA(His)6 or the empty vector pET24a(+) using standard electroporation protocols9,10. Cells containing the empty plasmid serve as a negative control.
- After selection of positive clones on kanamycin-containing (100 µg/mL) LB plates, inoculate cells containing the RTA expression plasmid or the empty vector in 5 mL LBkan medium (LB medium with 100 µg/mL of kanamycin) and incubate at 37 °C and 220 rpm for 24 h.
- Supplement 1 L LBkan medium with 5 mL pre-culture and incubate cells at 37 °C and 220 rpm until cells have reached an OD600 of 0.8-1.0 (approximately 3-4 h). Thereafter, reduce culture temperature to 28 °C and prepare a 1 M of isopropyl-β-D-1-thiogalactopyranoside (IPTG) stock solution in H2O.
- Induce RTA expression of the E. coli by adding IPTG to a final concentration of 1 mM.
- After 3.5 h at 28 °C and 220 rpm, harvest cells by centrifugation at 10,000 x g and 4 °C for 10 min, wash the pellet two times with 5 mL of binding buffer (500 mM NaCl, 10 mM imidazole, and 20 mM KH2PO4, pH = 7.4) at 10,000 x g and 4 °C for 10 min, and resuspend pellet in 5 mL binding buffer.
NOTE: Protocol can be paused at this stage and cells can be stored at 80 °C for several days.
2. Purification of His-tagged RTA via Affinity Chromatography
- Sonicate cells on ice using the following protocol: 15 s pulse (20 microns), 30 s pause. Repeat this step five times.
- Centrifuge cell lysate at 21,000 x g and 4 °C for 15 min and filter supernatant using a sterile syringe filter system (0.2 µm pore size).
NOTE: Cell pellets of successfully sonicated samples show transparent borders. - Use an automated purification system equipped with a 5 mL Ni2+-based affinity column to purify the His-tagged RTA fraction from the sterile-filtered E. coli supernatant. In general, use an elution speed of 1 mL/min and cool the whole purification system to prevent non-efficient toxin binding and loss of toxin activity.
NOTE: Parameters for efficient RTA purification are listed in Table 1. See also Becker et al. for further information9.- Briefly, equilibrate the affinity column with 20 mL of binding buffer to remove the storage buffer. Apply sterile-filtered supernatant onto the affinity column using a syringe.
- Wash the column with 25-35 mL of binding buffer to remove the unbound proteins from the column. Perform the washing step until UV absorbance at 280 nm is close to the initial UV value.
- Elute bound RTA fraction in 20-35 mL of elution buffer (500 mM imidazole, 500 mM NaCl, 20 mM KH2PO4, pH = 7.2) and keep the sample on ice (Figure 2A and Figure 2B).
NOTE: Elution of the RTA fraction is marked by an increase in UV absorption. Please note to exclusively collect this fraction to prevent contamination with nonspecific bound proteins. - Use 20 µL of eluted samples to perform Coomassie Blue staining11 or Western blot analysis12,13 (Optional). Use primary anti-His antibodies (1:1,000) and secondary anti-mouse-IgG-HRP (1:10,000) to detect RTA and verify sample purity (Figure 3).
- Desalt eluted RTA fraction on a 5 mL desalting column and equilibrate sample in 0.8 M sorbitol.
- Replace the affinity column of the purification system by the desalting column and first equilibrate the column with 20 mL of 0.8 M sorbitol.
- Apply the eluted RTA fraction to the column via a syringe. Wash the column with 100 mL of 0.8 M sorbitol and elute the desalted RTA fraction in a 15 mL tube as soon as the UV absorption starts to increase (Figure 2C).
- Store the eluted RTA fraction at 4 °C.
NOTE: Directly stop RTA fraction sampling when conductance increases to avoid salt contamination. Parameters for the desalting procedure are listed in Table 1.
- Concentrate eluted RTA fraction at 10,000 x g and 4 °C for 30-180 min using a 10 kDa cut-off spin column to a final volume of 1-2 mL and store sample at 4 °C for 3-4 weeks.
Caution: Do not freeze the sample since freezing leads to a complete loss of RTA activity. - Determine protein concentration using a conventional protein determination kit. Protein concentration should be in the range of 1-1.5 mg/mL.
NOTE: RTA tends to precipitate if the protein concentration is too high (>5 mg/mL).
3. Yeast Transformation and Cell Wall Removal
- Transform wild-type or selected yeast deletion mutants with the GFP reporter plasmid pRS315-K28SP-GFP6 using standard lithium acetate transformation methods14. Incubate cells on leucine drop-out (d/o) glucose plates (2% glucose, 1.5% agar, 0.5% ammonium sulfate, 0.17% Yeast Nitrogen Base (YNB), and 0.087% d/o mix without leucine) at 30 °C for 2-3 days for positive clone selection.
- Pick 3 different yeast clones from each plate and inoculate the clones in 100 mL of leucine d/o raffinose medium (2% raffinose, 0.5% ammonium sulfate, 0.17% YNB, and 0.087% d/o mix without leucine) at 220 rpm and 30 °C to OD600 = 1.0-2.0 (2-4 x 10⁷ cells/mL).
NOTE: Cell growth of the different yeast deletion strains is different. Monitor OD600 via a spectrophotometer. - To calculate OD600 values, dilute samples to OD600 = 0.1-0.3 (1:5 to 1:10 dilutions) and measure OD600 in a spectrophotometer. As reference, use H2O supplemented with the corresponding amount of leucine d/o raffionose medium. Finally, resuspend OD600 = 125 in 5 mL of sterile water (5 x 10⁸ cells/mL).
- Centrifuge cells at 25 °C for 5 min at 10,000 x g, wash cells twice with 5 mL sterile water, and resuspend cells in 50 mL spheroplasting buffer (0.8 M sorbitol, 10 mM Tris-HCl (pH 7.5), 10 mM CaCl2, 2 mM dithiothreitol (DTT), and 200 µg/mL lytic enzyme).
- Incubate the 50 mL culture at 100 rpm and 30 °C for 90 min. Optional: Monitor spheroplast formation every 15 min by phase contrast microscopy. Under the microscope, cells should have a dark translucent gray color. Bright (refractile) cells are insufficiently digested, whereas ghosts (pale gray cells with little, if any, internal structure) are over-digested.
- Check spheroplast preparation efficacy for each sample.
- After finishing step 3.5, mix 4 µL of the spheroplasted 50 mL culture with 496 µL spheroplasting buffer (approximately 2 × 10⁶ spheroplasts) and centrifuge for 10 min at 400 x g.
- Resuspend pellet in 10 mL H2O distilled, vortex sample for 30 s, and plate out 10 µL of the sample on leucine d/o glucose plates (2% glucose, 1.5% agar, 0.5% ammonium sulfate, 0.17% YNB, and 0.087% d/o mix without leucine).
- Incubate cells for 3 days at 30 °C. Count the total number of grown cell colonies on the plate. For data evaluation, use only samples with efficiency higher than 98% (total cell colony number <40 colonies/plate).
- Centrifuge cells from step 3.5 at 400 x g and 4 °C for 10 min and wash cells twice with 5 mL stabilized leucine d/o raffinose medium (0.8 M sorbitol, 2% raffinose, 0.5% ammonium sulfate, 0.17% YNB, and 0.087% drop-out mix without leucine). Resuspend cells in 5 mL stabilized leucine d/o raffinose medium (1 x 10⁸ cells/mL) and directly use cells for the GFP reporter assay measurements (Section 4).
4. GFP Reporter Assay Measurement in 96-Well Plates
- Seed out the yeast cell spheroplasts obtained in step 3.7 into 96-well plates (200 µL/well).
- Add 70 µL stabilized leucine d/o raffinose medium containing negative control (eluate of a Ni2+-affinity purified cell lysate from IPTG-induced E. coli cells expressing the empty vector) or purified RTA in a final RTA concentration of 5 µM (corresponding to 160 g/L RTA) in each well.
- Immediately add 30 µL stabilized galactose solution (30% galactose, 0.8 M sorbitol) to induce GFP expression and subsequently start the measurement.
NOTE: Perform at least 3 technical replicates per experiment and 3 biological replicates per yeast strain. - After finishing sample preparation (steps 4.1-4.3), put the 96-well plate in a fluorescence reader and start the measurement. Use the 475/509 nm filter set required for GFP fluorescence detection. Perform measurements at 30 °C, 120 rpm, and with a shaking diameter of 1 mm over a time window of 20 h (measuring intervals of 10 min).
NOTE: The GFP filter set is normally available in all reader systems. Temperature, time window, measuring intervals, and RTA concentration can be adjusted for own needs. Representative results are shown in Figure 4. - Optional: Use additional internal controls in the measurement for quality control. Prepare a negative control by adding 30 µL stabilized leucine d/o raffinose medium instead of 30% galactose (no GFP induction). In addition, add 70 µL of 0.8 M sorbitol stabilized G418 solution (300 µg/mL). The protein translation inhibitor G418 serves as positive control for protein inhibition as it prevents GFP expression in yeast.
- Calculate relative GFP fluorescence in percent for the 20 h time point according to the following equation (see Figure 4A):
 Where NC is the negative control
- Alternatively, determine the relative GFP fluorescence for each measuring point (in this case 10 min, see also step 4.4) using the above equation. As shown in Figure 4B, create a graph by blotting the GFP fluorescence intensities (y-axis) over time (x-axis).
The general workflow of the protocol described in this manuscript is illustrated in Figure 1, roughly summarizing the single steps for successful RTA purification and the subsequent GFP reporter assay experiment. A more detailed description of each individual step can be found in the protocol. Figure 2 illustrates the expected result of a successful RTA purification by affinity chromatography (Figure 2A) and empty vector control (Figure 2B). Figure 2C shows a representative outcome of a desalting experiment illustrating the ideal separation of the protein peak (blue) and the salt-eluted peak (brown). An effective RTA purification is presented in form of a Coomassie-stained SDS-gel in Figure 3. Finally, Figure 4 summarizes some original results obtained by this simple and robust GFP-based reporter assay method6. Figure 4A illustrates that the established GFP reporter assay is able to produce reliable results and schematically depicts the GFP reporter plasmid used in this study. In the graph, the relative GFP fluorescence of yeast spheroplasts under RTA-treated and non-treated conditions is compared with each other. As expected, non-induced as well as G418-treated cells show almost no GFP fluorescence. In non-treated and negative control-treated (empty vector) cells, GFP expression is not affected and significant differences between both samples were not observed. In contrast, RTA treatment leads to the expected GFP fluorescence reduction mediated by its ribosome inhibiting activity. In Figure 4B, a time curve of RTA-induced GFP fluorescence inhibition is displayed. This kind of data presentation contains additional information about the timing of GFP expression (90 min after galactose induction) and the starting point of the translational inhibition by RTA (210 min after application in wild-type cells). The delay in RTA-mediated fluorescence decrease most likely reflects the uptake kinetics and intracellular transport of RTA to the cytosol. Figure 4C illustrates the relative GFP fluorescence obtained from selected yeast mutants after a 20 h RTA-treatment and compared to RTA-treatment and compared to RTA-treated wild-type cells. The ERAD components Hrd1p and Der1p were chosen as suitable positive controls because earlier studies already demonstrated that both proteins are involved in ER-to-cytosol retrotranslocation of RTA in yeast1. Therefore, both mutants show the expected increase in GFP fluorescence compared to wild-type cells. In contrast, relative GFP fluorescence values in Δyos9 and Δnup120 cells are not significantly different. It has already been described that neither a lack of the ER quality control lectin Yos9p nor a lack in the nuclear pore protein Nup20p affect RTA toxicity and transport1. A list of the specific affinity chromatography and desalting parameters can be found in Table 1.
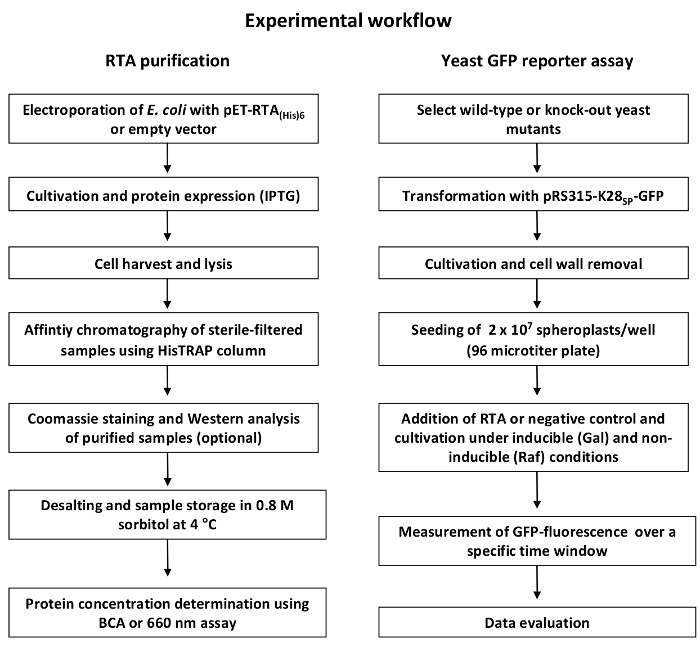
Figure 1: General workflow of RTA purification and GFP-based reporter assay. The RTA purification (left) starts with transformation of E. coli with the expression or empty vector followed by cultivation and IPTG-induced RTA expression. After cell lysis and sterile-filtration, the supernatant is purified via Ni2+ affinity chromatography and sample purity is verified via Coomassie staining or Western blot. Before the eluted RTA fractions are ready to use in the GFP reporter assay experiment, fractions need to be desalted and concentrated, and protein concentration must be determined. The GFP reporter assay experiment (right) starts with the transformation of wild-type and/or selected yeast deletion mutants with the GFP expression construct. After cultivation, the cell wall is removed by enzymatic treatment to allow RTA in vivo uptake. Then, GFP fluorescence of yeast cell spheroplasts is measured under toxin-treated and non-treated conditions over time in a fluorescence reader (475/509 nm). Finally, relative GFP fluorescence is determined using the equation shown in step 4.6 and is displayed as illustrated in Figure 4. Please click here to view a larger version of this figure.
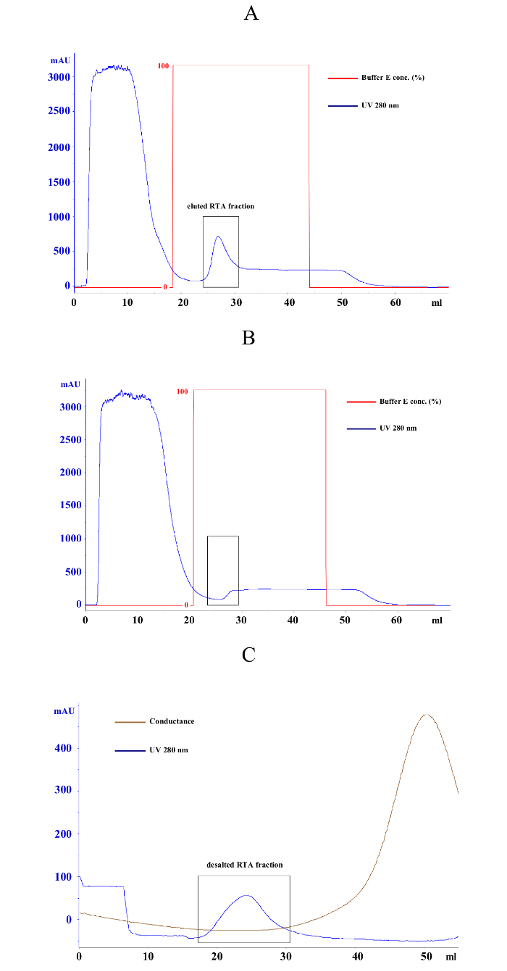
Figure 2: Representative affinity chromatography and desalting results of E. coli cells containing pET-RTA(His)6 or the empty vector control. (A) Typical purification graph of an E. coli cell lysate sample expressing RTA(His)6 from vector pET24-RTA(His)6. Blue curve represents the UV absorption at 280 nm caused by the aromatic rings of the amino acids Trp, Tyr, and Cys and serves as protein indicator. During column loading, unbound proteins are detected in the flow-through (0-10 mL). After removing unbound proteins by washing with binding buffer, elution buffer concentration is increased from 0 to 100% (red curve) and bound proteins are immediately eluted from the column. The peak of the blue curve between 25 and 30 mL represents the fraction of bound His-tagged RTA (black box). (B) Typical purification graph of an E. coli lysate from cells expressing empty vector control. Same purification protocol as in (A). As shown in the black box, no proteins are eluted from the column in the negative control. (C) Desalting diagram of an E. coli pET24-RTA(His)6 sample after affinity purification. The diagram shows the separation of the RTA protein fraction (peak of 280 nm absorption between 20-30 mL) and the salt fraction (increasing conductance peak after 30 mL). Please click here to view a larger version of this figure.
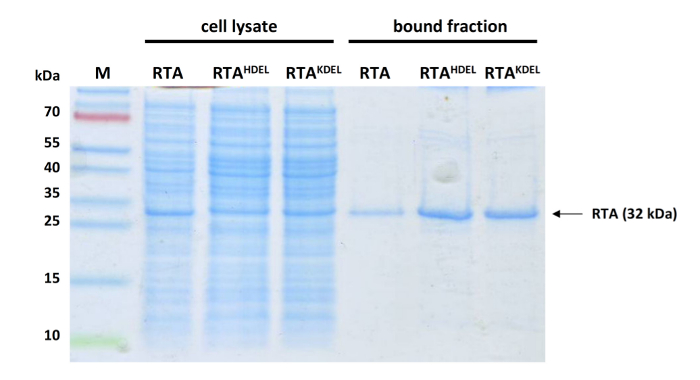
Figure 3: Representative Western analysis of different samples before and after affinity purification. 20 µL cell lysate (lanes 2-4) or purified sample (lanes 5-7) of different RTA variants (only unmodified RTA was used in this study) analyzed by SDS-PAGE and Coomassie blue staining. Lane 1, protein ladder; lane 2, unmodified RTA; lane 3, RTAHDEL; lane 4, RTAKDEL; lane 5, unmodified RTA; lane 6, RTAHDEL; lane 7, RTAKDEL. Please click here to view a larger version of this figure.
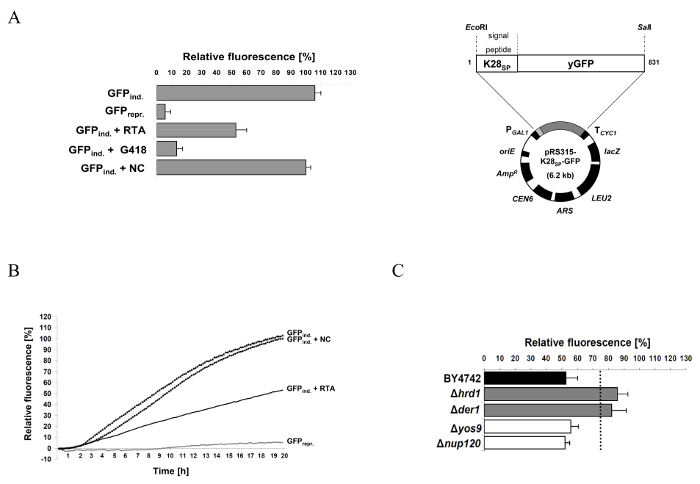
Figure 4: Representative results obtained by the reporter assay for RTA-treated wild-type and selected yeast deletion mutants. (A) Relative GFP fluorescence of wild-type yeast spheroplasts containing the reporter plasmid pRS315-K28SP-GFP (right) under induced (3% galactose, GFPind.) and non-induced (2% raffinose, GFPrepr.) conditions after 20 h GFP induction. Relative GFP fluorescence was also analyzed in the presence of RTA (5 µM), G418 (300 µg/mL) or the negative control (NC). The protein translation inhibitor G418 serves as positive control and prevents GFP expression in yeast. Mean values and standard deviation (SD) are indicated. (B) Relative GFP fluorescence from (A) displayed as time course over 20 h. This diagram provides additional information about the timing of GFP expression and translation inhibition by RTA; the curve behavior indirectly reflects the kinetics of RTA uptake and intracellular transport to the cytosol. (C) Representative result of selected yeast mutants defective in cellular proteins that are known to be involved (Hrd1p and Der1p) or not involved (Yos9p and Nup120p) in RTA trafficking in yeast1,6. The dotted line represents a threshold of significance which is based on the fluorescence emission obtained by the positive control strains (for further explanation see reference6). Mean values and standard deviation (SD) are indicated. The figure was modified from Becker et al.6 Please click here to view a larger version of this figure.
| Affinity chromotography parameter | ||
| Measuring parameters | UV (280 nm), Elution buffer concentration, Conductance | |
| Settings | Variable/Unit | Value |
| Flow rate | mL/min | 1 |
| Maximum column pressure | MPa | 0.35 |
| Wavelength | nm | 280 nm |
| Binding buffer | Pump position | A |
| Elution buffer | Pump position | B |
| Starting concentration elution buffer | % | 0 |
| System volume compensation | mL | 10 |
| Column equilibration | mL | 20 |
| Sample injection over superloop/syringe | mL | cell lysate volume |
| Washing step | mL | 20-35 |
| Elution step | mL | 20-35 |
| Concentration elution buffer during elution | % | 100 |
| Recalibration of column with 20% EtOH | mL | 50 |
| Desalting parameter | ||
| Measuring parameters | UV (280 nm), Conductance | |
| Settings | Variable/Unit | Value |
| Flow rate | mL/min | 4 |
| Maximum column pressure | MPa | 0.35 |
| Wavelength | nm | 280 nm |
| Binding buffer | Pump position | A |
| Elution buffer | Pump position | B |
| Starting concentration elution buffer | % | 0 |
| System volume compensation | mL | 10 |
| Column equilibration | mL | 20 |
| Sample injection over superloop/syringe | mL | cell lysate volume |
| Desalting buffer injection (0.8 M sorbitol) | mL | 100 |
| Recalibration of column with 20% EtOH | mL | 50 |
Table 1: Parameters used for column-based affinity purification and desalting. List of all relevant column settings (e.g., flow rate, elution buffer concentration, equilibration and washing step duration) and measured parameters (e.g., conductance or UV absorption).
