The overall goal of this methodology is to give the optimal experimental conditions from sample preparation to image acquisition and reconstruction in order to perform 2D dual color dSTORM images of microtubules and intermediate filaments in fixed cells
The cytoskeleton, composed of actin microfilaments, microtubules, and intermediate filaments (IF), plays a key role in the control of cell shape, polarity, and motility. The organization of the actin and microtubule networks has been extensively studied but that of IFs is not yet fully characterized. IFs have an average diameter of 10 nm and form a network extending throughout the cell cytoplasm. They are physically associated with actin and microtubules through molecular motors and cytoskeletal linkers. This tight association is at the heart of the regulatory mechanisms that ensure the coordinated regulation of the three cytoskeletal networks required for most cell functions. It is therefore crucial to visualize IFs alone and also together with each of the other cytoskeletal networks. However, IF networks are extremely dense in most cell types, especially in glial cells, which makes its resolution very difficult to achieve with standard fluorescence microscopy (lateral resolution of ~250 nm). Direct STochastic Optical Reconstruction Microscopy (dSTORM) is a technique allowing a gain in lateral resolution of one order of magnitude. Here, we show that lateral dSTORM resolution is sufficient to resolve the dense organization of the IF networks and, in particular, of IF bundles surrounding microtubules. Such tight association is likely to participate in the coordinated regulation of these two networks and may, explain how vimentin IFs template and stabilize microtubule organization as well as could influence microtubule dependent vesicular trafficking. More generally, we show how the observation of two cytoskeletal components with dual-color dSTORM technique brings new insight into their mutual interaction.
Cytoplasmic intermediate filaments (IFs) are 10 nm-diameter homo- or heteropolymers of a cell type specific subset of IF proteins. IFs participate in a large range of cellular functions such as cell motility, proliferation and stress responses. Their key role is highlighted by the fact that more than 90 human diseases are directly caused by mutations in IF proteins; for instance, changes in IF composition accompanies tumour growth and spreading1,2,3. There is growing evidence that the three cytoskeleton systems work in collaboration to control cellular functions such as cell polarization, division and migration2,3. Since there is a tight coupling between spatial architecture and functions, it is crucial to get insights into the structural organization of the IF with the other filaments and better understand the cytoskeletal cross-talk. this article provides a protocol to perform the super-resolution technique dual-color dSTORM (direct STochastic Optical Reconstruction Microscopy)4 and how it is used to investigate the interaction between IF and microtubules in fixed, cultured cells in 2 dimensions (2D).
Several super-resolution techniques have been developed over the past decade, and there discoveries were at the origin of the Nobel Prize in Chemistry in 20145. Among all these techniques lies the single molecule localization-based methods like PALM6 (Photo-Activated Localization Microscopy) which uses photoswitchable fluorescent proteins, STORM7 with pairs of fluorophores or dSTORM4 with conventional fluorophores. All these methods are based on the same principle which consists of (i) the switch of most of the fluorescent reporters into an "off" state" (non-fluorescent), (ii) the stochastic activation of a subset of them into a fluorescent state in order to localize their spatial position with nanometer accuracy, and (iii) the repetition of this process in order to activate as many subsets of fluorophores as possible. A final image is reconstructed using all the localizations of the activated molecules, providing a lateral resolution down to ~20-40 nm. Several commercialized optical systems allowing PALM/STORM are now available for biologists for routine experiments. Here, one such system was used to study the structural association of microtubules and IFs. Among all the single-molecule localization-based methods, the dual-color dSTORM technique was selected, because it is well suited to observe very thin lamellar regions (<1 µm) of adherent cells and can provide significant improvement of image resolution with minimal time and money investment. Indeed, dSTORM is a very convenient and versatile technique that is compatible with the standard organic dyes routinely used for cellular staining and immunofluorescence.
While one color dSTORM images are relatively simple to obtain using the fluorophore Alexa6478, dual color dSTORM requires to optimize the experimental conditions so that two dyes can blink properly in the chosen buffer, especially when there is limited laser power. Excellent papers are already available on the methods to set up multi-color imaging with dSTORM9,10,11,12,13, and these papers explain in detail the possible sources of artifacts and degraded image resolution as well as how to overcome them. In this article, the optimal experimental conditions in terms of cells fixation, immunostaining, sample preparation, imaging acquisition and image reconstruction are described in order to acquire images of dense cytoplasmic IF networks and microtubules in glial cells with dual-color dSTORM. Briefly, the extraction/fixation method described in Chazeau et al12 was adapted to glial cells and used with a post-fixation step, optimized antibodies concentration, a STORM buffer with 10 mM MEA described in Dempsey9 et al. which was found to be optimal for the experimental set up and sample type.
Glial cells mainly express three types of IF proteins: vimentin, nestin and GFAP (glial acidic fibrillary protein). These three proteins were shown to co-polymerize in astrocytes14. We previously showed using super-resolution structured illumination microscopy (SR SIM) that these three IF proteins can be found in the same single IF filament and that they display similar distribution and dynamics in glial cells 15. Due to the similarities between the three IF proteins, vimentin staining was used as a reporter for the whole IF network. Using dSTORM, we managed to resolve how IF form bundles along microtubules, which was not possible with diffraction limited microscopy techniques15. These observations may help to understand how vimentin IFs can template microtubules and regulate their growth trajectory, promoting the maintenance of a polarity axis during cell migration16. Super-resolution images provided key information on the mutual interaction of the two cytoskeletal subsystems, and brought insight into the link between spatial association and local function which could be cell-type specific17. In general, dual-color dSTORM can be used to study the crosstalk between cytoskeletal elements or other types of organelles, provided that good immunostaining conditions are reached in terms of density and specificity. This technique will be useful to better characterize the cytoskeleton changes observed during astrogliosis and in glioblastoma, the most common and most malignant tumor of the central nervous system, where the expression of IF proteins is altered 18,19,20,21.
1. Coverslips preparation (Day 1, 30 min)
2. Cell plating (Day 1, 20 min)
3. Cell fixation (Day 2, 2h)
4. Immunostaining (Day 2, 5h)
5. Sample preparation (Day 3, 5 min)
6. Image acquisition (Day 3, ~1h per cell)
7. Image reconstruction (5 min)
8. Estimation of the localization precision of a STORM image (10 min)
9. Channel registration (5 min)
A microscope equipped with 50 mW 405 nm and 100 mW 488, 561 and 642 nm solid-state lasers, an EMCCD 512×512 camera, an alpha Plan Apo 100X/1.46 objective and Band Pass 570-650 / Long Pass 655 emission filters was used for the representative results presented below.
Figure 1A gives an example of molecule density and signal to noise ratio that should be used during raw image acquisition. Good quality images are obtained with a minimum of ~1 µm between neighboring molecules. In good blinking conditions, fluorophores should be present in only one frame. Good blinking requires to adjust the imaging buffer conditions (pH, reductive agent, oxygen scavenging system) and laser powers, which influence the on- and off-rates of the fluorophores, and therefore the duty cycle (the fraction of time a fluorophore spends in the on state)9,11. Figure 1B, on the contrary, gives an example of raw image where the molecule density is too high and single molecule cannot be resolved.
Figure 1C shows a typical histogram of localization precisions for all the molecules detected and analyzed by the manufacturer software from a stack of 20 000 frames. This histogram corresponds to the dSTORM image of the microtubule network shown in Figure 3B. Values of localization precisions provided by the manufacturer software are in good agreement with values estimated following step 8, using the pointing precision of a single molecule localized at different time points22 (Figure 1D).
Figure 2A shows a typical example of dSTORM image of vimentin filaments immunolabeled with Alexa647. The increase in resolution can clearly be observed on comparison with the image acquired with a standard wide-field microscope (Figure 2B-C). The fluorescence intensity profiles represented in Figure 2D show that super-resolution microscopy imaging allows resolving vimentin bundles. The dSTORM resolution is sufficient to count the number of filaments present in the bundles.
Figure 3 shows a typical example of dual-color dSTORM image of the vimentin and tubulin networks immunolabeled with Alexa647 and Alexa555 respectively. The overlay of the two networks shows that the vimentin bundles are often localized along microtubules, providing key structural information on the coupling between the two cytoskeleton subsystems.
Figure 4 illustrates various examples of dSTORM images of microtubules obtained in non-optimal conditions. First, using Alexa488 and a buffer with 143 mM beta-mercaptoethanol (another reductive agent used instead of MEA9,10,11) and an oxygen scavenging system (composed of 0.5 mg/mL glucose oxidase and 40 µg/mL catalase), the fluorophores were blinking but were not bright enough to be precisely localized (too low photon number) (Figure 4A). Second, using Alexa555 with 143 mM beta-mercaptoethanol, 50 mM MEA and an oxygen scavenging system, the fluorophores could not be pumped to their dark state and therefore not be well spatially separated (too high duty cycle, i.e. the fraction of time in the "on" state is too long) (Figure 4B). Finally, using Alexa568, with 143 mM beta-mercaptoethanol, 50 mM MEA and an oxygen scavenging system, the fluorophores were not bright and were blinking slowly with very long "on" and "off" states (low photon number and too high duty cycle) (Figure 4C). In all these non-optimal conditions, the microtubule network was poorly rendered in the super-resolution images. In conclusion, optimal conditions require fluorophores with high photon number and low duty cycle9,10 in the corresponding imaging buffer. Note that optimizing labeling density and imaging buffer conditions to obtain good blinking conditions is a standard procedure for dual-color dSTORM and is not specific to IF-microtubule imaging.
According to the Nyquist-Shannon theorem, it is necessary to have fluorophores at least every 10 nm to have a resolution of 20 nm. Extended to 2D structures, Dempsey et al estimated that a labeling of ~104 fluorophores per µm2 is necessary. As the IF network is denser and its filaments are thinner (10 nm vs 25 nm diameter without the primary and secondary antibodies) compare to the microtubule network, we observed that twice more localizations are necessary to describe the IF network. We obtained good images with 5 000 localizations/µm2 for IF and 2500 localizations/µm² for microtubules, obtained with 40 000 frames and 20 000 frames respectively. The image with the highest resolution was obtained with a localization precision of σSMLM ~ 8-12 nm estimated following step 8 of the protocol (pointing precision of a single molecule localized at different time points22). This estimation of localization precision was in good agreement with the values provided by the manufacturer software shown in a histogram of localization precisions extracted from all the detected molecules in the raw data (example shown in Figure 1C). Such localization precision could provide an image with a resolution of ~30 nm (2.35*precision) if the labeling density is high enough. We routinely observed vimentin filament with a Full Width at Half Maximum (FWMH) of ~40 nm and microtubules with a width FWMH of ~55 nm. Since the image resolution depends on both the localization precision and the localization density, we provide experimental conditions which allow the best results taking into account both criteria.
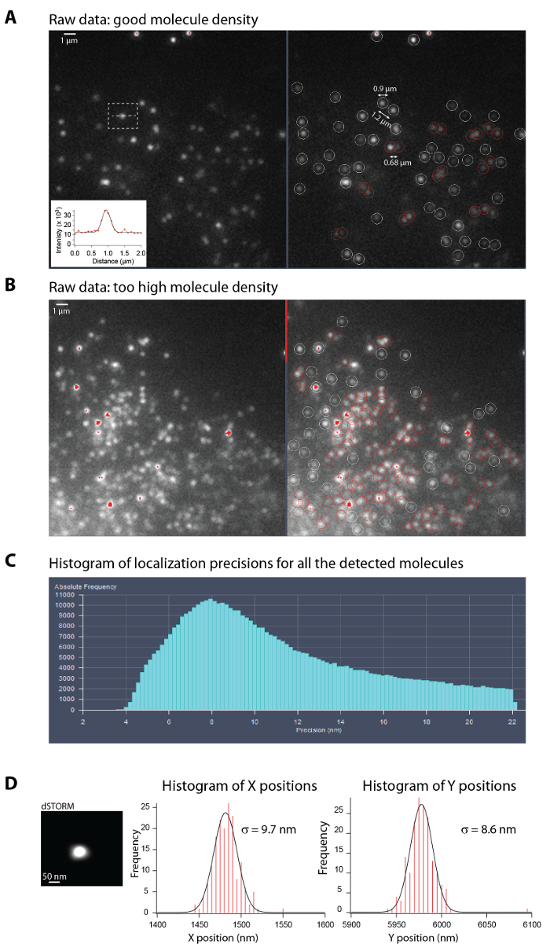
Figure 1: Optimal density of single molecules during acquisition and localization precision estimation.
(A-B) Left: Representative raw images from a single frame with an optimal density of single molecules in the bright state (A) and with a too high density (B) during STORM acquisition (step 6.12.) of fixed U373 cells stained with anti-vimentin and anti-mouse Alexa647. Right: Raw images where the single molecules with fluorescence level above the Peak intensity to noise threshold (set to 6) are surrounded by circles (white or red). The circle diameter is set by the Peak mask size (set to 9 pixel) and the color determines whether the molecules overlap (red) or not (white). Note that high density of single molecules (in (B)) lead to a high amount of overlapping molecules which are not taken into account for the STORM image reconstruction. A Inset: Graph showing a typical fluorescence intensity profile of a single molecule in red and its Gaussian fit in black. In this example, the localization precision is σx = 6.7 nm. Scale bar, 1 µm. (C) Typical histogram of localization precisions for all the molecules detected and analyzed by the manufacturer software. It can be visualized and is updated regularly during the acquisition of the raw data thanks to the online processing. This histogram corresponds to the dSTORM image of the microtubule network shown in Figure 3B. (D) Left: STORM image of a single molecule presents on the glass surface after reconstruction. Right: Histograms of the X and Y positions obtained after Gaussian fitting. Gaussian fitting the X and Y distributions give an estimate of the localization precision. Please click here to view a larger version of this figure.
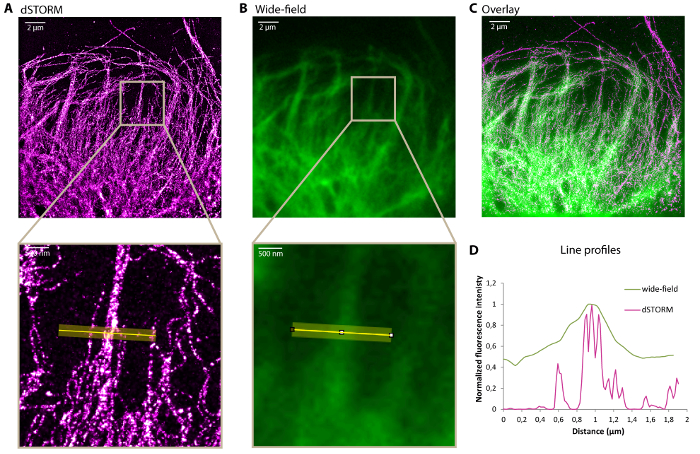
Figure 2: Representative dSTORM image of a vimentin network. dSTORM image (A), corresponding standard wide-field image (B) and overlay (C) showing the leading edge of a U373 glial cell fixed as described in the protocol and stained for vimentin with Alexa647. Bottom: zoom of the highlighted region. (D) Transverse intensity profiles along the yellow line on the zoomed images in A and B. Scale bar, 2 µm and 500 nm in the zoom. Please click here to view a larger version of this figure.
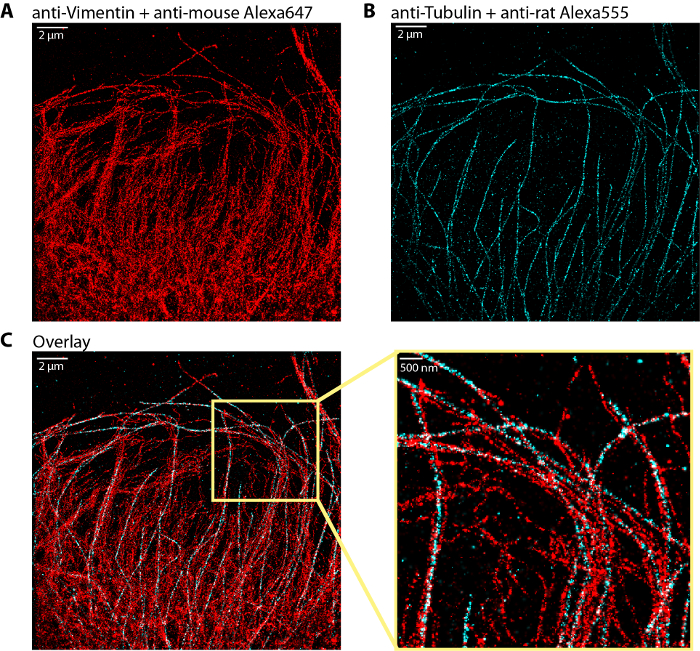
Figure 3: Representative dual color dSTORM image of vimentin and microtubule networks.(A) Vimentin network stained with Alexa647 (same as in Figure 2A). (B) Microtubule network labeled with Alexa555. (C) Overlay of the vimentin (red) and microtubule (cyan) networks with a zoom region on the right. The dSTORM image of vimentin was obtained with ~1.5 million of localizations out of 40 000 frames. The dSTORM image of microtubules was obtained with ~850 000 localizations out of 20 000 frames. Scale bar, 2 µm and 500 nm in the zoom. Please click here to view a larger version of this figure.
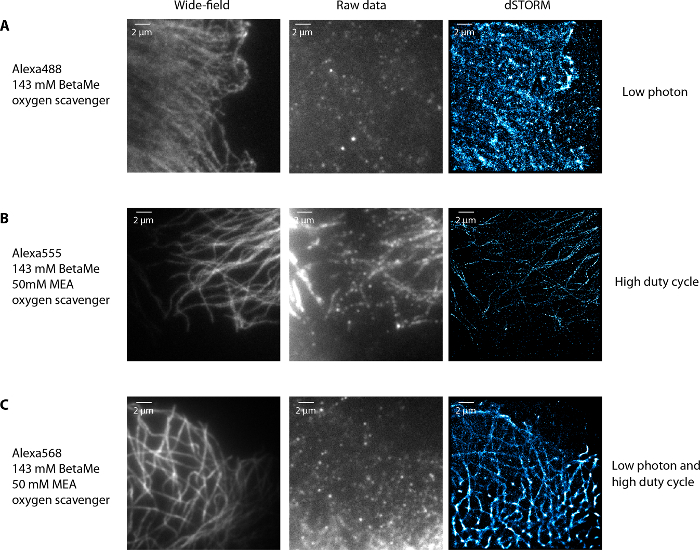
Figure 4: Examples of non-optimal imaging conditions of microtubules. When the fluorophores blink but are not bright enough with an Alexa488 labeling of tubulin in U373 glial cells and 143 mM BetaMercaptoethanol and oxygen scavenger in the imaging buffer (A), when the fluorophores are bright enough but cannot be properly depleted in the dark state (at the maximum laser power available) and blink slowly with Alexa555 labeled tubulin in 143 mM BetaMercaptoethanol, 50 mM MEA and oxygen scavenger buffer (B) and when fluorophores blink slowly and are not bright using Alexa568 labeled tubulin in a storm buffer that contains 143 mM BetaMercaptoethanol, 50 mM MEA and oxygen scavenger (C). In all these cases, the dSTORM images have degraded resolution. Scale bar, 2 µm. Please click here to view a larger version of this figure.
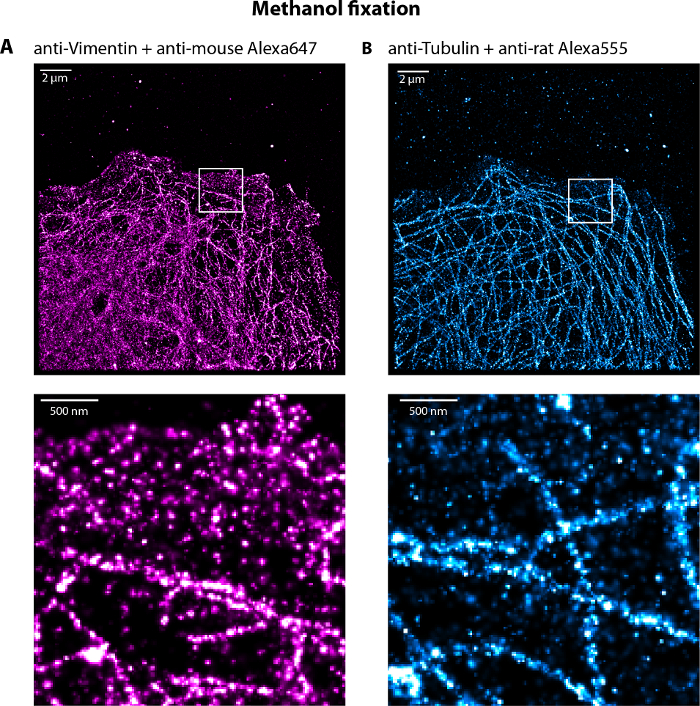
Figure 5: Representative dual-color dSTORM image of vimentin and microtubule networks of a U373 cell fixed with cold methanol for 5 min. (A) Vimentin and (B) microtubules networks labeled with Alexa647 and Alexa555 respectively with highlighted zooms. Note the presence of single molecules at the front of the cells localized in the cytoplasm decreasing the global resolution of the filament networks. Scale bar, 2 µm and 500 nm in the zoom. Please click here to view a larger version of this figure.
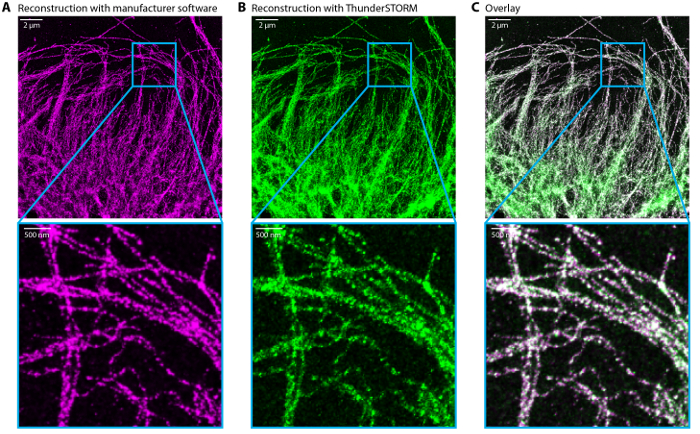
Figure 6: Comparison of dSTORM reconstructed images
Reconstructed dSTORM image by the manufacturer software (A) and ThunderSTORM (FiJi plugin) (B). (C) Overlay of (A) in magenta and (B) in green. Scale bar, 2 µm and 500 nm in the zoom. Please click here to view a larger version of this figure.
Critical steps in the protocol
We present here a protocol which minimizes artifacts in the dSTORM images of microtubules and IFs in glial cells. Artifacts can be created at every step of the sample preparation and imaging: fixation, blocking, immunolabeling, drift during acquisition, non-optimal blinking conditions23. We list below the most critical steps.
Cleaning the coverslips is an important step to limit the non-specific binding of fluorophores on the surface and therefore to limit the background noise in the dSTORM image.
We suggest fixing the sample with a step of extraction and fixation solutions using a mix of glutaraldehyde and triton, and then fixation with PFA (paraformaldehyde) (step n°3). The fixation protocol was adapted from Chazeau et al12: we decreased the extraction/fixation step incubation time to 60 s (step 3.4), remove the glucose from the cytoskeleton buffer, and skipped the extra-step of permeabilization. The advantage of this method is that the freely moving cytoskeletal subunits are drained away, allowing super-resolution imaging with less background12. More generally the fixation step is critical because bad fixation (using old PFA, cold solutions, too long/short incubation steps) lead to partial destruction of the filament networks (broken microtubules, microtubules which do not reach the cell front and/or in a low density). Note that it is also possible to use methanol fixation, especially if only the vimentin network is imaged as described in Leduc et al15. However, background noise can be observed inside the cell (Figure 5). Although dSTORM images obtained with methanol fixed cells are of poorer quality, they still provide information on what both IF and microtubule networks should look like e.g. in term of filament density. Fixation with only glutaraldehyde gave very poor results for IFs, although it is the best protocol for microtubule fixation23.
In the immunostaining part, it is important to use anti-mouse antibodies which minimize cross-reaction with antibodies developed in rat. We could not use Fab fragments (anti-mouse) for this reason, because they cross-react non-specifically with the rat anti-tubulin in addition to the mouse anti-vimentin.
Due to the limited laser power available, it is necessary to use both 488 and 561 nm laser lines to pump the Alexa555 dyes to the dark state. High 488 laser power (~50%) is also necessary during acquisition to observe good blinking and low duty cycle (the fraction of time a fluorophore spends in the on state), although it increases the background noise as well. The TIRF illumination mode limits the excitation of fluorophores in a thin layer (~200 nm above the glass coverslip). It increases the signal-to-noise ratio by decreasing the background light, but also decreases the excitation power. The HILO mode allows axial sectioning and can be efficient to optimize the signal-to-noise ratio. It is therefore a good intermediate between epi and TIRF. Using the HILO mode is essential to excite efficiently the Alexa555 fluorophores, which require high laser power to blink properly.
Another critical step is the acquisition of raw data (step 6). It is necessary to adjust the acquisition parameters (exposure, gain, TIRF and even focus when no focus block device is available) while the movie is acquired. Keeping an optimal density of bright fluorophores is important (Figure 1A): it must be low enough to spatially separate each dye, but high enough to visualize the entire structure after 40 000 frames. If the number of activated molecules is too low, longer stacks should be acquired. We obtained good images with ~ 5000 localizations per µm² for IFs, and 2 500 localizations per cm² for microtubules.
Modifications and troubleshooting of the method
It is important to work with fresh samples and optimized imaging buffers. pH should be precisely adjusted, especially for the MEA.
Vimentin and microtubules should look uniformly labeled when imaged with standard wide-field microscopy technique (WF). If filaments look punctuated/dashed with classical microscopy, this will be amplified when using super resolution. In this case, it is better to prepare new samples. Non-optimized fixation conditions (old PFA etc.) may result in microtubules looking fragmented. High background on the glass surface may arise from an inefficient blocking. In that case, BSA (bovine serum albumin) can be replaced by FBS (fetal bovine serum), and used in each incubation steps.
If the labeling density is too high (Figure 1B) and cannot be sufficiently pushed in the dark off-state, even with the highest laser power, the amount of secondary antibodies should be lowered (better than decreasing the amount of primary antibodies). However, this requires the preparation of new samples. In general, it is necessary to evaluate empirically the quantity of secondary antibodies to use.
If the fluorophores do not blink normally (they should be in the bright state during only one frame), check that the pH of the imaging buffer is correct (pH 8.3). Prepare new solutions if the problem persists (especially MEA). Always check that the TIRF collimator is on (TIRF u_HP). With limited laser power, obtaining proper blinking may be challenging (the on and off rates as well as dye brightness depend on laser power, as described in van de Linde et al11). Other dyes like Alexa488 or Atto488 can be explored if more power of the excitation laser is available14.
If the fluorophores stop blinking before the end of the 40 000 frames, change the imaging buffer which may have been oxidized. Verify that there is no air bubbles between the buffer and the lid after the buffer change. Sealed samples could be imaged for a few hours in a raw.
If STORM movies are acquired on a regular TIRF microscope equipped with an EMCCD, it is possible to use ThunderSTORM24 to reconstruct the images. Similar options are available for the drift correction, image filtering and image rendering. ThunderSTORM is a plugin used with the Fiji/imageJ software. Similar results were obtained with the manufacturer software and ThunderSTORM (Figure 6).
COT (cyclooctatetraene) can be added to the imaging buffer to improve the localization precision of single molecules. It increases the number of photons emitted per cycle for Alexa64725. A better localization precision was indeed observed (down to 6 nm) when adding 2 mM COT to the STORM buffer described in step 5 or with 100 mM MEA as described in reference25. However, in these conditions, the number of bright molecules during acquisition decreases much faster than without COT, limiting the total number of molecule localizations at the end of the acquisition and potentially leading to under-sampling of the IF network. Other imaging buffers were reported to work well with Alexa dyes, for example using lactase and oxyrase as oxygen scavenging system26. In this protocol, we report the buffer composition which gave the best results in term of resolution for our type of samples and imaging set up, but each sample type requires buffer optimization, in addition to labeling and fixation conditions optimization.
Limitations of the method and possible improvements
The method presented here is limited to fixed cells and 2D images. Using a standard imaging set up with a TIRF microscope and an EMCCD, the most limiting factor was the laser powers (100 mW for the 561 nm laser was not sufficient to make the Alexa555 dyes blink). A 532-nm laser line may be more efficient to excite these dyes. A possible improvement of the method would be to perform 3D dSTORM using optical astigmatism27. This would require minimal modifications of the protocol, except for a lower labeling density and an increased frame number. 3D dual color STORM image would provide a better view of IFs wrapped around microtubules, especially in bundles. Note that actin filaments could also be observed using the same fixation method and an optimized amount of fluorescent phalloidin8. 3 color STORM could be used to observe the organization of the three cytoskeletal subsystems.
Using primary and secondary antibodies increases the size of the object of interest since the secondary antibody is localized up to 20 nm from the target. Typically, a 25-nm diameter microtubule will have a width of ~ 50 nm after labeling. One possibility to improve the distance between the target and the dye is to directly label the primary antibodies with the appropriate dyes. Ideally nanobodies labeled with organic dyes should be used28.
We provide here just a simple method to estimate the average localization precision of a single molecule following Endesfelder et al22. The overall resolution of the images that takes into account both localization precision and labeling density, can also be measured using the Fourier Ring Correlation approach29.
Regarding the channel registration, it is difficult to overlay perfectly all the beads present in the field of view. A more complex correction can be found in Chazeau et al 12.
Limitations arising from the blinking of fluorophores and bleaching of the probes can be overcome by using DNA-PAINT (DNA Points Accumulation for Imaging in Nanoscale Topography )30. In this method, the blinking necessary for single molecule localization is created by transient binding of short-dye-labeled oligonucleotides to their complementary targets.
Conclusion
This article presents a robust protocol to perform dual-color dSTORM imaging in 2 dimensions of cytoskeletal filaments in fixed cells. The experimental conditions that were found optimal in terms of fixation, immunolabeling and imaging buffer for our sample type are described in details. Then, the process of raw data acquisition and the type of blinking images that have to be recorded (molecule density, signal to noise ratio, fluorophore duty cycle etc) is presented as well as how to reconstruct dSTORM images, correct the drift and filter data. These steps are generic for dual-color dSTORM imaging and not sample type specific. Finally, it is shown how this technique helps to resolve the dense organization of the two coupled cytoskeletal networks.
The authors have nothing to disclose.
We thank Mickael Lelek, Orestis Faklaris and Nicolas Bourg for fruitful discussion, Andrey Aristov and Elena Rensen for help with the super-resolution technique and Shailaja Seetharaman for careful reading of the manuscript. We gratefully acknowledge the UtechS Photonic BioImaging (Imagopole) Citech of Institut Pasteur (Paris, France) as well as the France-BioImaging infrastructure network supported by the French National Research Agency (ANR-10-INSB-04; Investments for the Future), and the Région Ile-de-France (program Domaine d’Intérêt Majeur-Malinf) for the use of the Elyra microscope. This work was supported by the the Ligue Contre le Cancer and the French National Research Agency (ANR-16-CE13-0019).
Minimum Essential Media (MEM) | Gibco | 41090-028 | cell culture |
non essential amino acid | Gibco | 1140-050 | cell culture 1/100e |
Penicillin-Streptomycin | Gibco | 15140-122 | cell culture 1/100e |
Fœtal Bovine Serum | Gibco | 10270-106 | cell culture 1/10e |
0,05 % Trypsin-EDTA (1X) | Gibco | 25300-054 | cell culture |
PBS 10x | fischer scientific | 11540486 | cell culture |
coverslip 18 mm n°1,5H | Marienfield/Dominic dutsher | 900556 | coverslips |
paraformaldehyde (PFA) solution | Sigma | F8775 | cell fixation |
glutaraldehyde | Sigma | G5882 | cell fixation |
triton X100 | Sigma | T9284 | non ionic surfactant. Used for cell fixation |
sodium borohydride (NaBH4) | Sigma | 452904-25ML | cell fixation |
BSA | Sigma | A7906 | sample passivation 3% in PBS |
Monoclonal Anti-Vimentin (V9) antibody produced in mouse | Sigma | V6630 | primary antibodies |
Rat anti alpha tubulin | Biorad | MCA77G | primary antibodies |
Goat anti-Rat IgG (H+L) Secondary Antibody, Alexa Fluor 555 | Fisher scientific | 10635923 | secondary antibodies |
Donkey anti-Mouse IgG (H+L) Secondary Antibody, Alexa Fluor 647 | Fisher scientific | 10226162 | secondary antibodies |
TetraSpeck Microspheres, 0.1 µm, fluorescent blue/green/orange/dark red | Fisher scientific | T7279 | fluorescent beads |
Chamlide magnetic chamber | Live Cell Instrument | CM-B18-1 | magnetic sample holder, maximum volume 1,2 mL |
Cysteamine (MEA) | Sigma | 30070 | for the blinking buffer |
glucose oxidase from Aspergillus niger | Sigma | G0543 | for the blinking buffer |
glucose | sigma | for the blinking buffer | |
catalase from bovine liver | Sigma | C9322 | for the blinking buffer |
Tris (trizma) | Sigma | T1503 | for the blinking buffer |
Wash-N-Dry coverslip rack | Sigma | Z688568 | |
Parafilm | Sigma | P7793-1EA | paraffin film |
ultrasonic cleaner | Fisher scientific | 15-335-6 | |
plasma cleaner | Harrick plasma | PDC-32G-2 |