The procedures carried out in this protocol were in accordance with the national Danish legislation for care and use of laboratory animals and the experiments were approved by the Danish National Animal Experiments Inspectorate (protocol# 2015-15-0201-00615).
1. Preparations
- Prepare axolotl medium.
- Apply high quality non-chemically treated tap water as axolotl medium. If this is unavailable, apply 40% Holtfreter's solution.
- Prepare 40% (wt/vol) Holtfreter's solution by dissolving 15.84 g NaCl, 0.54 g CaCl2·2H2O, 1.11 g MgSO4·7H2O, and 0.288 g KCl in filtered and deionized water up to a volume of 1 L.
- Make immersion anesthetics.
- Prepare benzocaine (ethyl 4-aminobenzoate) anesthetic solution by dissolving 200 mg ethyl 4-aminobenzoate in 3 mL acetone and then dissolving this mix in 1 L tap water or 40% Holtfreter's solution.
- Prepare MS-222 (ethyl 3-aminobenzoate methanesulfonic acid, also commonly known as tricane) anesthetic solution by dissolving 200 mg ethyl 3-aminobenzoate methanesulfonic acid directly in 1 L tap water or 40% Holtfreter's solution.
- Prepare propofol (2,6-diisopropylphenol) anesthetic solution by dissolving 3.3 mg 2,6-diisopropylphenol in in 1 L tap water or 40% Holtfreter's solution. Alternatively, dilute commercially premade solution to 3.3 mg/L.
CAUTION: Propofol is a powerful human anesthetic (intravenously administered) and should be handled with care, including in the diluted form.
- Prepare bed and container for echocardiography.
- Prepare lip-shaped animal bed for echocardiography by folding a 70 cm x 55 cm piece of soft cloth once and then rolling it into "burrito shape" (Figure 1A). Then bend over the ends until they meet and tape these together (Figure 1B).
- Submerge the lip shaped structure in axolotl medium to accommodate the anesthetized axolotl during ultrasound imaging. Secure the animal to the structure and prevent floating using loose rubber bands; position these mid-mandibular and over the sacral region (Figure 1C).
NOTE: The rubber bands should not squeeze the animal as this will affect hemodynamics. - For 2D echocardiography on unanesthetized axolotls, prepare a hammock by carving out a 16 cm x 8 cm x 5 cm hole in a 33 cm x 27 cm x 5 cm block of polystyrene foam (e.g., a lid from a medium size polystyrene foam container) (Figure 1D).
- Push a 33 cm x 27 cm piece of plastic wrap through the hole and secure the edges of the wrap to the top surface of the polystyrene foam block (Figure 1E) to create a hammock. Add axolotl medium to 3 cm of depth in the hammock. The unanesthetized axolotl will sink to the bottom of the hammock allowing for easy ventral access through the plastic wrap (Figure 1F).
2. Anesthetize Axolotls
- Immerse axolotl in desired anesthetic solution (benzocaine, MS-222, or propofol).
- Inspect for first signs of sedation, reduced movements and increasing loss of righting reflex, this appears within 10 min in animals < 10 g (< 10 cm) and within 20 min in animals between 10 g and 50 g of body mass (10-22 cm).
- Inspect for complete lack of body movements, gill ventilation movements, and righting reflex, and make sure the animal is non-responsive to moderate pain stimulation tested by pinching the webbing between digits.
NOTE: Despite the fact that general anesthesia is accomplished within 30 min in benzocaine anesthetized axolotls, cardiac function is not stabilized until 1 h. This is not the case in MS-222 or propofol anesthetized axolotls (Figure 6A-F). - To maintain axolotl under general anesthesia, keep the animal in anesthesia solution or wrapped in wet paper wipes wetted in anesthesia solution.
NOTE: Anesthesia can be maintained for 7 h without adverse effects on animal's wellbeing given that the skin and especially the gills are kept moist. - To reawake axolotl, transfer the animal to anesthesia-free medium.
NOTE: The first sign of awakening is gill ventilation movements. Animal should be upright and responsive to stimulation within 1 h.
3. 2D Echocardiography on Anesthetized Axolotl
- Place anesthetized axolotl in a supine position in the lip-shaped animal bed (steps 1.3.1-1.3.2). Secure it from floating using loose rubber bands (Figure 1C). Ensure that the thoracic surface is covered by 3-5 mm of medium.
NOTE: For a brief acquisition (< 5 min) anesthetic-free medium can be applied. For prolonged acquisition, anesthetic solution should be applied as ultrasound medium to ensure stable cardiac function throughout measurements. - Position the transducer over the midline of the animal in the thoracic region parallel to the long axis of the animal (Figure 2A, Figure 3A-B, Supplementary File 2). Use transillumination with a cold light source on white and albino axolotls to ensure the correct placement of the transducer (Figure 2C and Supplementary File 1).
- For axolotls weighing < 20 g, use a 50 MHz transducer; for axolotls > 20 g, use a 40 MHz transducer. Ensure positioning of the cranial/anterior direction to the right for standardized image acquisition. If this is not the case rotate the transducer 180 ° or invert the image.
- Make sure that in the long axis midline view, a small portion of the ventricle (positioned to the right in the thoracic cavity, Figure 2A) appears in the frame at ventricular diastole and a large portion of the left and right atria (positioned at the center/slightly toward the left in the thoracic cavity, Figure 2A) and the sinus venosus are visible both in atrial systole and diastole (Figure 3A, B).
- Translate the transducer 1-3 mm toward the animal's right to obtain the ventricular long axis view (Figure 2A). The correct position is attained when the cross-sectional area of the end-systole ventricle is at its maximum (Figure 3C-H).
- In B-mode, acquire ≥ 3 cardiac cycles with > 50 frames/s in either 'general imaging' (high spatial/low temporal resolution) or 'cardiology' (low spatial/high temporal resolution) mode.
NOTE: This view allows for evaluation of ventricular function. Ventricular function can be evaluated in two dimensions using the ventricular fractional area change (FACv) calculated from the end-diastolic and end-systolic cross sectional area of the ventricle (CSAv) using the equation:
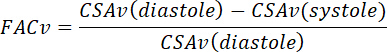 (1)
(1)
The axolotl's ventricle assumes the shape of a sphere and a geometry based stroke volume [SV(geo)] can be calculated using the equation:
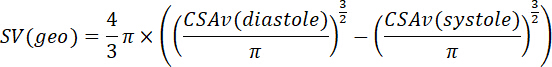 (2)
(2) - Translate the transducer along the long axis of the animal until the center of the ventricle is in the middle of the screen. Rotate the transducer 90 ° clockwise to obtain the mid-ventricular short axis view (Figure 5A and B, Supplementary File 10). Evaluate the circular shape of the ventricle by translating the transducer along the long axis of the heart.
- Return the transducer to the long axis plane and translate it back toward the midline or slightly to the left of the midline to obtain the atrial long axis two chamber view (Figure 2A). Make sure that the correct position is attained by confirming that the cross-sectional areas of the end-systole atria are at their maxima and the two atria combined assume the outline of the number '8' tilted ~ 45 ° toward the left (Figure 4A and B, Supplementary File 6).
- In B-mode acquire ≥ 3 cardiac cycles with > 50 frames/s in either 'general imaging' or 'cardiology' mode.
NOTE: The axolotl's atria are irregular in shape and 3D function cannot be directly inferred from 2D data, thus their function must be evaluated as an index measure such as atrial fractional area chance (FACa) based on the combined cross sectional area (CSAa) of both atrial chambers in systole and diastole:
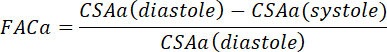 (3)
(3) - Translate the transducer toward the right until the outflow tract (conus arteriosus) appears (close to the ventricular long axis view) (Figure 2A).
NOTE: After leaving the ventricle in an anterior direction, the outflow tract makes a sharp bend and runs at a small angle toward the ventral surface before again assuming an anterior direction and splitting up into gill branches and systemic vessels.- Make sure that the correct outflow tract view is attained by confirming that the diameter of the outflow is at its maximum at ventricular end-systole and two of the three semilunar valves at the entrance of the outflow are visible at mid-ejection (Figure 4E, Supplementary File 8).
NOTE: The ventral directionality toward the transducer of the intermediate portion of the outflow tract allows for velocity and flow measurements using Doppler imaging.
- Make sure that the correct outflow tract view is attained by confirming that the diameter of the outflow is at its maximum at ventricular end-systole and two of the three semilunar valves at the entrance of the outflow are visible at mid-ejection (Figure 4E, Supplementary File 8).
- Apply Color Doppler-mode to map blood flow velocities in the outflow tract during cardiac ejection (Figure 4F and Supplementary File 9). Likewise apply Color Doppler and Power Doppler imaging to visualize blood flow in the ventricular and atrial views (Figure 3E-H, Supplementary Files 4-5 and Figure 4C-D, and Supplementary File 7).
- Apply Pulse Wave (PW) Doppler-mode at the position of maximum blood velocity in the portion of the outflow tract running toward the transducer.
- Use 'beam angle' and 'angular correction' up to 45 ° to adjust for the outflow not being completely perpendicular to the face of the transducer (Figure 4G). Make sure that the PW Doppler position is not overlapped by the spiral valve of the outflow during any phase of the cardiac cycle (Figure 4E).
- In PW Doppler-mode acquire velocity/time data over ≥ 3 cardiac cycles.
- Return to B-mode and acquire ≥ 3 cardiac cycles at the exact same plane as PWV was acquired.
- Measure the velocity time integral (VTI) of the blood flow in the outflow tract as the area under the velocity/time curve for one full cardiac cycle (Figure 4G, g1).
NOTE: From the VTI and the diameter (d) of the outflow tract at end-systole obtained from the B-mode acquisition, a PW Doppler based stroke volume [SV(pw)] can be calculated using the equation:
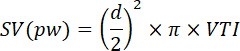 (4)
(4)
Heart rate (HR) is measured from the velocity/time curve by measuring the duration of an entire cardiac cycle. Cardiac output [CO(pw)] is calculated using the equation:
 (5)
(5) - Obtain the oblique paragill view, a view that offers an alternative for the measurement of the blood flow velocity in the outflow tract, by rotating the axolotl 90 ° in the lip shaped bed in such a way that the right part of the animal is facing upward (Figure 2B). Angle and rotate the transducer and position it parallel and just posterior to the protruding gills (Figure 2B). Make sure that the correct position is attained by confirming that the outflow tract is running downward at ~ 45 ° and that the atria appear under the outflow tract during ejection (Figure 5C, Supplementary File 11).
- Apply PW Doppler-mode at the position of maximum blood velocity in the portion of the outflow tract running away from the transducer (Figure 5D, Supplementary File 12). Use 'beam angle' and 'angular correction' up to 45 ° to adjust for the outflow not being completely perpendicular to the face of the transducer (Figure 5E).
- In the PW Doppler-mode acquire blood velocity over ≥ 3 cardiac cycles.
- Return to B-mode and acquire ≥ 3 cardiac cycles at the exact same plane as PWV was acquired.
NOTE: SV(pw) and CO(pw) are calculated for the oblique paragill view using Equation 4 and Equation 5 as described above for the long axis view.
4. 2D Echocardiography on Unanesthetized Axolotl
- Place the unanesthetized axolotl in a prone position in the hammock (step 1.3.3).
- Leave the animal undisturbed for 30-60 min to recover from handling stress.
- Position the ultrasound transducer with the transducer head facing upward toward the axolotl in the hammock.
- Apply ultrasound-gel on the transducer.
- Gently, and without disturbing the animal, position the transducer over the midline of the animal in the thoracic region parallel to the long axis of the animal.
NOTE: This is the same, but inverted, position as for the anesthetized axolotl (step 3.2). - Obtain B-mode, Color Doppler mode, PW mode data in the long axis and short axis view as described in steps 3.2-3.14.
NOTE: An oblique paragill view is unobtainable in the unanesthetized axolotl. The echocardiographic data in unanesthetized axolotls should be acquired between gill ventilation movements (a 10-20 s period for a resting animal). If the axolotl moves during acquisition, measurements must be repeated.
5. Evaluate 2D Echocardiography Data and Minimize Subjectivity
- Avoid operator/observer bias in 2D ultrasound imaging and 3D evaluation of cardiac function based on 2D data caused by subjectivity in both the data acquisition and the data analysis phase by performing intra/inter-operator/observer analysis20.
NOTE: In the startup of studies and when training new personnel this subjectivity must be quantified and minimized using intra/inter-operator/observer analysis. - Initiate the intra/inter-operator/observer analysis in a two person setup with operator/observer 1 (less experienced) being tested against operator/observer 2 (more experienced) by performing ≥ 6 consensus measurements together, including both bench work at the ultrasound system (operation) and subsequent analysis of relevant parameters (observation).
- Reach consensus between operators and observers and operate (operator/observer 1) the ultrasound system to acquire relevant data on ≥ 6 animals (operation 1.1).
- Directly after, operate (operator/observer 2) the ultrasound system to acquire relevant data on the same animals (operation 2.1).
- Let animals recover for 3 days. Thereafter, repeat (operator/observer 1) the procedure (operation 1.2).
- Analyze (operator/observer 1) all measured data (operation 1.1/observation 1.1; operation 2.1/observation 1.1; operation 1.2/observation 1.1) and after 24 h repeat the analysis of operator/observer 2's data (operation 2.1/observation 1.2).
- Analyze (operator/observer 2) the data acquired by her/himself (operation 2.1/observation 2.1). Note that the values obtained by this analysis are considered closest to the true values.
- Evaluate variation, tendencies, and bias in comparisons between all acquired parameters using Bland-Atman plotting, QQ plotting, t-test (equal mean), and F-test (equal variance) (Figure 6G).
- Note that the operation 1.1/observation 1.1 versus operation 2.1/observation 1.1 comparison demonstrates the inter-operator variation.
- Note that the operation 2.1/observation 1.1 versus operation 2.1/observation 2.1 comparison demonstrates the inter-observer variation.
- Note that the operation 1.1/observation 1.1 versus operation 1.2/observation 1.1 comparison demonstrates the intra-operator variation.
- Note that the operation 2.1/observation 1.1 versus operation 2.1/observation 1.2 comparison demonstrates the intra-observer variation.
- Make sure that mean and variation of the different measurements are non-significantly different for the four comparisons; the difference between measured values should fall within ± 1.96 standard deviations, and there should appear no tendencies toward less precision of neither small nor large values.
6. 3D Echocardiography on Anesthetized Axolotl
- 3D acquisition
- Place the anesthetized axolotl in a supine position in the lip-shaped animal bed (step 1.3.1). Secure it from floating using loose rubber bands (Figure 1C) and make sure that the thoracic surface is covered by 3-5 mm of medium. 3D acquisition is a lengthy procedure, therefore apply anesthetic solution as ultrasound medium to ensure stable cardiac function throughout measurements.
- Position the transducer over the midline of the animal in the thoracic region either parallel to the long axis of the animal (for a sagittal 3D recording) or orthogonal to the long axis (transversal 3D recording).
- Translate the transducer in the in-plane dimension (x and y) and the out-of-plane dimension (z or slice) to ensure that the entire cardiac region will be covered in the subsequent 3D capture.
- Adjust the frame rate and spatial resolution as desired by selecting either 'general imaging' (high spatial/low temporal resolution) or 'cardiology' (low spatial/high temporal resolution) mode. For 0.33 Hz < HR < 1 Hz use a temporal resolution of 50 frames/s obtained at high spatial resolution ('general imaging') that allows for the cardiac cycle to be reconstructed into 50-150 distinct phases.
- Adjust '2D gain' to a level where anatomical structures are barely recognizable in the raw B-mode image (~ 5 dB) to increase signal-to-noise-ratio in the final reconstructions.
- For each slice (z step), record ≥ 1,000 frames.
- Translate transducer one z step at a time, e.g., 20 µm or 50 µm, and repeat recording until the entire cardiac region is covered.
- 3D reconstruction (Supplementary Files 13 and 14).
- Export acquisitions into Digital Imaging and Communications in Medicine DICOM (little endian).
NOTE: Each slice containing a set number of frames will compose a single file. - Determine the number of frames in a full cardiac cycle. As HR can vary over time, determine this for both the first and the final slice. Set the highest number of frames per cycle as the initial upper estimation of phase resolution that can later be reduced (step 6.2.8).
- Determine crop boundaries and excise irrelevant space surrounding the B-mode window.
NOTE: These boundaries should be constant throughout slices. - Convert the RGB Color image into 32-bit.
- Calculate the correlation value (C) for each frame in the stack and the number of frames included in the first cardiac cycle using the formula:
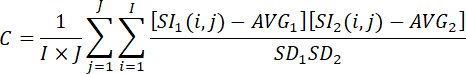 (6)
(6)
NOTE: Here is the signal intensity of the pixel at coordinate (i, j) in the first image
  and is the same in the second image,
  ,
,  and
and  ,
,  are the mean intensity and standard deviation, respectively, of the first and second image in the comparison, and I and J are the numbers of columns and rows in the image. The resulting array of correlation values will have the size of the product of the number of frames per cardiac cycle and the total number of frames per slice (e.g., 75 × 1,000 = 75,000 in Figure 8) (see exemplary script in Supplementary File 16). The correlation value cannot be calculated if one or both of the images in the comparison have a standard deviation of pixel values of zero, however this is highly unlikely in ultrasonographic images.
 - Detect local maxima in the array of correlation values (Figure 8A, see exemplary script in Supplementary File 17 to automatically detect local maxima).
- Calculate quadratic average Q(AVG) of frames with peak correlation values (i.e., matching cardiac phases) using the formula:
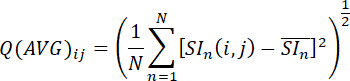 (7)
(7)
where N is the total number of frames with matching cardiac phases, is the intensity of the pixel at coordinate (i, j) of the nth image and
  is the temporal arithmetic mean of
  of the nth image (see exemplary script in Supplementary File 18).
 - Repeat step 6.2.3-6.2.7 for all slices.
- Select a slice (reference slice) with easily recognizable anatomical structures (e.g., mid-ventricular) and check if the reconstructed ensemble averaged one cardiac cycle corresponds to exactly one cycle (i.e., if there are additional phases resulting in more than one cardiac cycle). Delete additional phases to yield exactly one cardiac cycle (e.g., going from an overestimated 75 phases/cycle (in reality, 1.07 cycle) in Figure 8 to exactly one cycle containing 70 phases in Figure 8).
- On the neighboring slice (test slice), sort the ensemble averaged one cardiac cycle t-stack into matching cardiac phases with the reference slice using the correlation value formula ( Equation 6) (see exemplary scripts in Supplementary File 19 and Supplementary File 20).
NOTE: Although two non-identical slices will not appear completely similar at any point during the cardiac cycle, adjacent slices with a sufficiently small step size (e.g., 20 µm or 50 µm) will have pronounced similarities resulting in correlation value maxima that can be translated into matching phases. - Repeat step 6.2.9-6.2.10 for all slices.
- Collapse the entire 3D reconstruction into a single 3D Tagged Image File format (TIF) containing z slices and t frames or into a stack of DICOM files.
NOTE: Data can be binned in each dimension to reduce size, increase signal-to-noise ratio and generate isotropic data (in-plane resolution is usually several folds higher than out-of-plane resolution).
- Export acquisitions into Digital Imaging and Communications in Medicine DICOM (little endian).
Intrapericardial space in the axolotl is dependent on the size of the animal. Smaller animals (2-20 g, 7-15 cm) will have an excess of pericardial fluid (appearing dark in echocardiography) surrounding the cardiac chambers whereas in larger sexually mature animals (> 20 g, > 15 cm) the chambers will occupy most of the intrapericardial space. To provide the best overview for representative results of echocardiographic views of the axolotl heart, a smaller animal (10 g, 10 cm) was applied for Figure 3, Figure 4, Figure 5, and Figure 9.
The long axis view generally provides a good overview of cardiac anatomy in the axolotl. Entering at the midline plane with the sinus venosus, atria, and part of the ventricle in plane (Figure 3A, B, Supplementary File 2), either the ventricular plane (Figure 3C–H) or the atrial plane (Figure 4A–D) can be reached by translating the transducer to the right or left of the animal, respectively. The ventricle will appear spherical and highly trabeculated (Figure 3C, Supplementary Files 3–5), whereas the atria have a more irregular shape and almost no trabeculation (Figure 4A, Supplementary File 6, Supplementary File 7). The short axis view (Figure 5A, B, Supplementary File 10) provides a less easily interpretable overview of the cardiac anatomy of the axolotl heart, however it contributes to the evaluation of correct cardiac contraction (e.g., infarcted or non-contracting zones of the circular ventricle are clearly visualized in this view plane). In the long axis view plane, the center of the outflow tract is positioned closely to the center of the ventricle (Figure 2A, and compare Figure 3C with Figure 4E and Supplementary File 3 with Supplementary File 8). Since the soft tissue of the outflow tract will be moving upon blood ejection, the high intensity blood signal during a cardiac cycle measured by pulse wave Doppler in both the long axis and the oblique paragill plane will be adjoined by low intensity noise from the movements of the surrounding soft tissue (gray area surrounding white area in the velocity/time curve in Figure 4G and Figure 5E). Generally, the contrast between blood signal and soft tissue noise should be large enough to segment out only the blood signal when measuring the velocity time integral (Figure 4G (g1 magnification) and Figure 5E (e1 magnification)).
For qualitative evaluation of blood flow patterns, color Doppler and power Doppler imaging provide visualizations of flow patterns in different cardiac chambers (ventricle: Figure 3E–H, Supplementary File 4, Supplementary File 5; atria: Figure 4C, D, Supplementary File 7; outflow tract: Figure 4F, Figure 5D, Supplementary File 9, Supplementary File 12).
Axolotls used for laboratory experimentation vary in size from the early post larval stage of 2-4 g to full maturity at 10-30 g and larger animals weighing > 100 g. Likewise, cardiac function and some absolute values of functional parameters described here depend on the size of the animals. Generally, fractional area change is constant in different size groups with values ranging at 40-50% (skewed toward lower values for larger animals). Stroke volume is highly dependent on the size of the animal, i.e., the size of the heart, ranging from e.g., 20-30 µL in 5 g axolotls, 50-70 µL in 10 g axolotls, and 250-300 µL in 50 g axolotls. Heart rate and to some degree stroke volume are highly dependent on the applied anesthetic and the level of anesthesia (Figure 6A–F, Figure 7).
Traditional intra/inter-operator/observer analysis involves graphical representations (Q-Q Plots and Bland-Altman plots) and testing for equal mean (t-test) and variance (F-test) to evaluate normal distribution of data and to compare accuracy and precision between two persons (Figure 6G).
3D echocardiography adds an additional dimension (z or depth) to the more traditional 2D acquisition. This allows for multi-planar visualization of data (Figure 9A), reslicing (Figure 9B), surface and volume reconstructions (Figure 9C, Supplementary File 13, and Supplementary File 14), and segmentation and generation of 3D models (Figure 9C, Supplementary File 15).
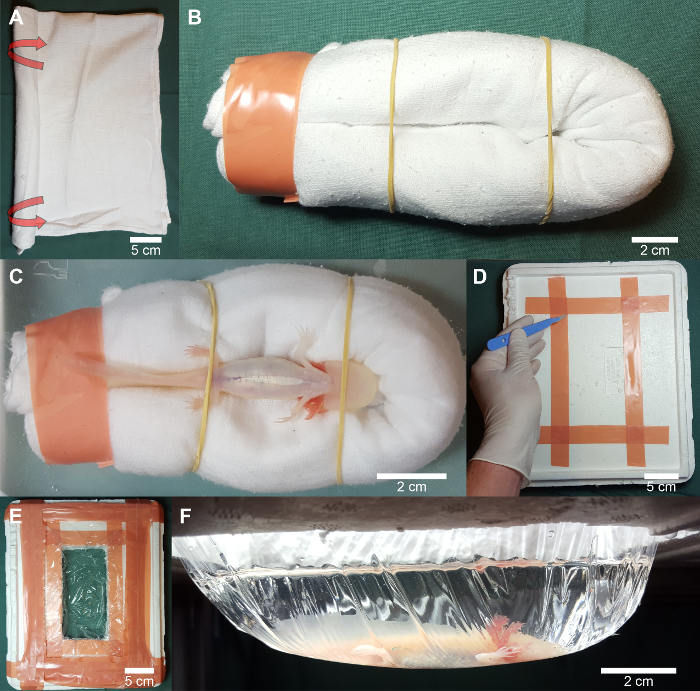
Figure 1. Preparation of bed and container for echocardiography of anesthetized and unanesthetized axolotl. (A) A soft piece of cloth is folded once and rolled into "burrito" shape. (B) The ends are bent back and taped to form a lip shaped bed for the axolotl during underwater scanning. (C) For 2D and 3D echocardiography of an anesthetized axolotl, the animal is gently placed in a supine position in the crevice of the lip shaped bed and fixed with rubber bands over the mid-mandibular and sacral region. (D, E) A hammock is prepared by carving out a square hole in a piece of polystyrene foam and taping plastic wrap to the upper surface. (F) For 2D echocardiography of an unanesthetized axolotl, the animal is placed in a natural prone position in the hammock and approached with a gel covered transducer tip from underneath. Please click here to view a larger version of this figure.
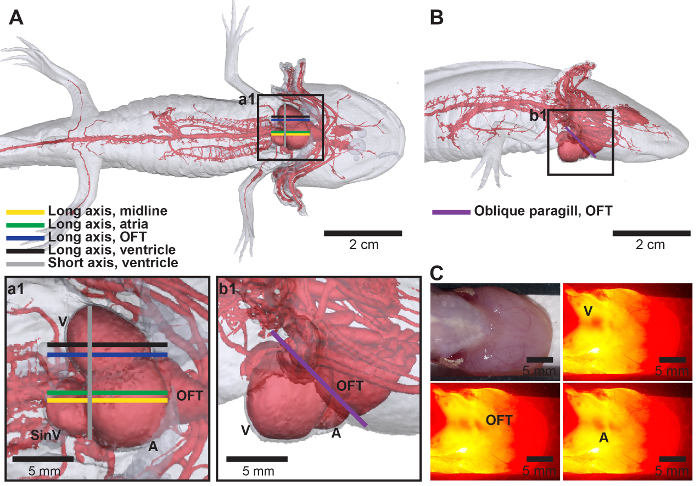
Figure 2. Transducer placement. (A, B) Model of the arterial network in the axolotl with the approximate position of the transducer for long axis and short axis view (A) and oblique paragill view (B). (C) Transillumination with a powerful cold light source can aid in finding the exact location of the cardiac chambers before applying the transducer (see Supplementary File 1). Anatomical abbreviations: A, atria; OFT, outflow tract; SinV, sinus venosus; V, ventricle. Please click here to view a larger version of this figure.
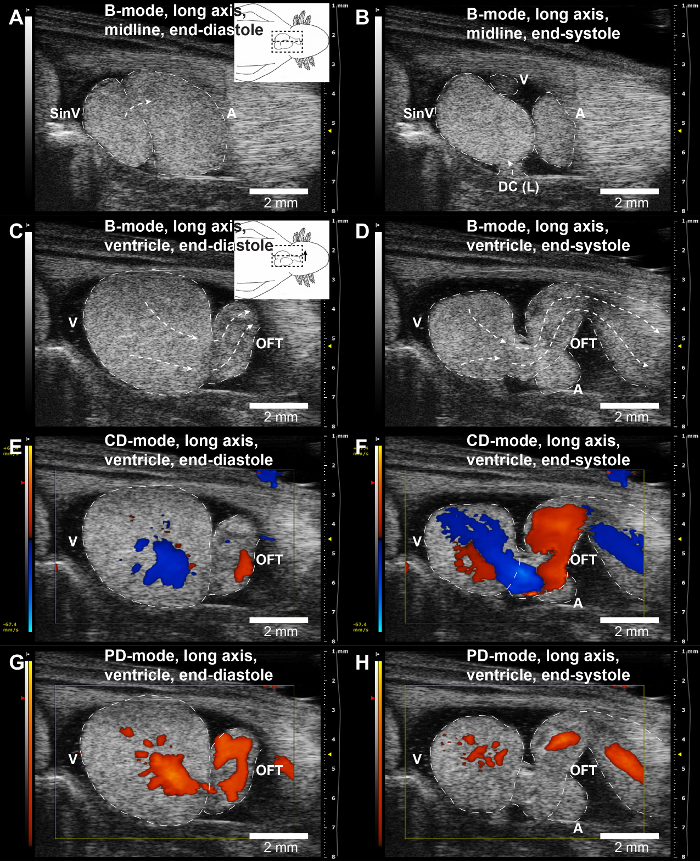
Figure 3. Representative long axis echocardiographic views of the ventricle. (A, B) Typical long axis midline view in B-mode (yellow line in Figure 2A) in the ventricular end-diastolic (A) and end-systolic (B) phases (see Supplementary File 2 for video representation). (C, D) Long axis view of the ventricle in B-mode (black line in Figure 2A) in the ventricular end-diastolic (C) and end-systolic (D) phases (see Supplementary File 3 for video representation). (E–H) Similar view plane as in (A) and (B) in color Doppler (CD) and power Doppler (PD) mode demonstrating blood flow (see Supplementary File 4 and Supplementary File 5 for video representation of CD- and PD-mode, respectively). Red colors in CD-mode images indicate blood flowing toward the transducer and blue colors indicate the opposite. Cardiac chambers and blood flow have been highlighted with dotted lines. Inserted cartoons in (A) and (C) show placement of transducer and translation relative to the long axis midline view. Anatomical abbreviations: A, atria; DC(L), left duct of Cuvier; OFT, outflow tract; SinV, sinus venosus; V, ventricle. Please click here to view a larger version of this figure.
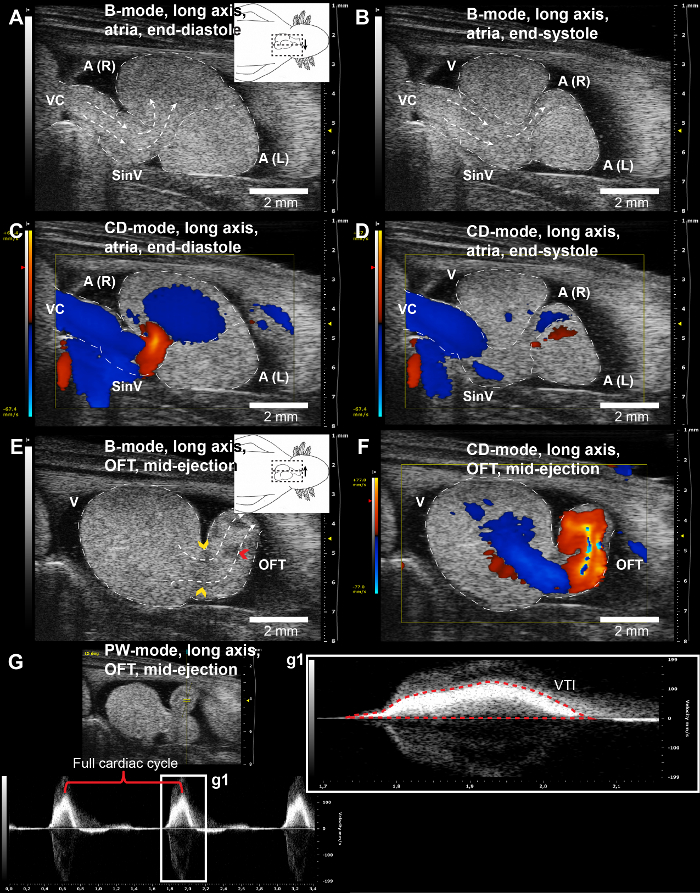
Figure 4. Representative long axis echocardiographic views of the atria and outflow tract. (A, B) Long axis view of the atria in B-mode (green line in Figure 2A) in the atrial end-diastolic (A) and end-systolic (B) phases (see Supplementary File 6 for video representation). (C, D) Similar view plane as in (A) and (B) in color Doppler (CD) mode demonstrating blood flow (see Supplementary File 7 for video representation). (E) Long axis view of the outflow tract in B-mode (blue line in Figure 2A) in the mid-ejection phase (see Supplementary File 8 for video representation). F: Similar view plane as in (E) in CD-mode demonstrating blood flow (see Supplementary File 9 for video representation). (G) Similar view plane as in (E) and (F) in pulse wave Doppler (PW) mode allowing for heat rate detection and velocity time integral (VTI) measurement for stroke volume calculation. Red colors in CD-mode images indicate blood flowing toward the transducer and blue colors indicate the opposite. Cardiac chambers and blood flow have been highlighted with dotted lines. Yellow and red arrow heads indicate semilunar valves at the root of the outflow tract and the spiral valve in the outflow tract, respectively. Inserted cartoons in (A) and (E) show placement of transducer and translation relative to the long axis midline view. Anatomical abbreviations: A(R), right atrium; A(L), left atrium; OFT, outflow tract; SinV, sinus venosus; V, ventricle; VC, vena cava. Please click here to view a larger version of this figure.
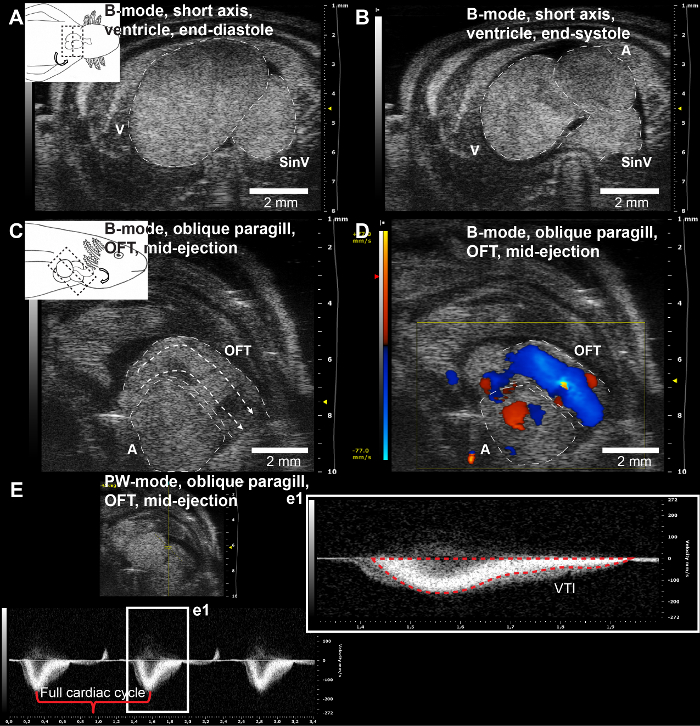
Figure 5. Representative short axis and oblique paragill echocardiographic views of the ventricle and outflow tract. (A, B) Short axis view of the ventricle in B-mode (grey line in Figure 2A) in the ventricular end-diastolic (A) and end-systolic (B) phases (see Supplementary File 10 for video representation). (C) Oblique paragill view of the outflow tract in B-mode (purple line in Figure 2B) in the mid-ejection phase (see Supplementary File 11 for video representation). (D) Similar view plane as in (C) in CD-mode demonstrating blood flow (see Supplementary File 12 for video representation). (E) Similar view plane as in (C) and (D) in pulse wave Doppler (PW) mode allowing for heat rate detection and velocity time integral (VTI) measurement for stroke volume calculation. Red colors in CD-mode images indicate blood flowing toward the transducer and blue colors indicate the opposite. Cardiac chambers and blood flow have been highlighted with dotted lines. Inserted cartoons in (A) and (C) show placement of transducer and translation relative to the long axis midline view. Anatomical abbreviations: A, atria; OFT, outflow tract; SinV, sinus venosus; V, ventricle. Please click here to view a larger version of this figure.
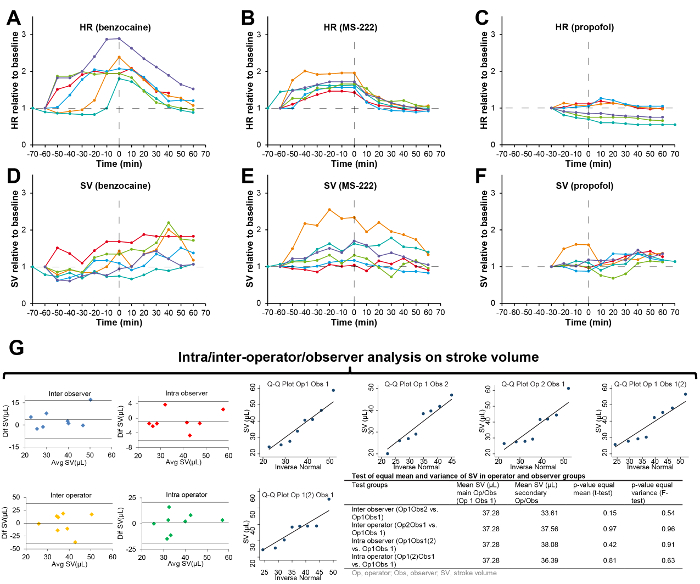
Figure 6. Representative results of heart rate and stroke volume measurements, the effect of anesthesia, and representative intra/inter-operator/observer analysis. (A–C) Heart rate (HR) relative to unanesthetized baseline plotted over time (0 h is at full anesthesia) for six axolotls anesthetized in benzocaine (A), MS-222 (B), and propofol (C). (D–F) Stroke volume (SV) relative to unanesthetized baseline plotted over time (0 h is at full anesthesia) for six axolotls anesthetized in benzocaine (D), MS-222 (E), and propofol (F). (G) Intra/inter-operator/observer analysis of stroke volume. Bland-Altman plots [difference (Dif) between operators (Op)/observers (Obs) plotted against average (Avg)] should reveal no systematic bias in the normally distributed measurements (Q-Q Plots) obtained by different operators and observers. Testing for equal mean (t-test) and equal variance (F-test) should reveal no significant differences between operators/observers (table in lower right). A–F was modified from material available under the Creative Commons Attribution License (Figure 1 of Thygesen et al.21). Please click here to view a larger version of this figure.
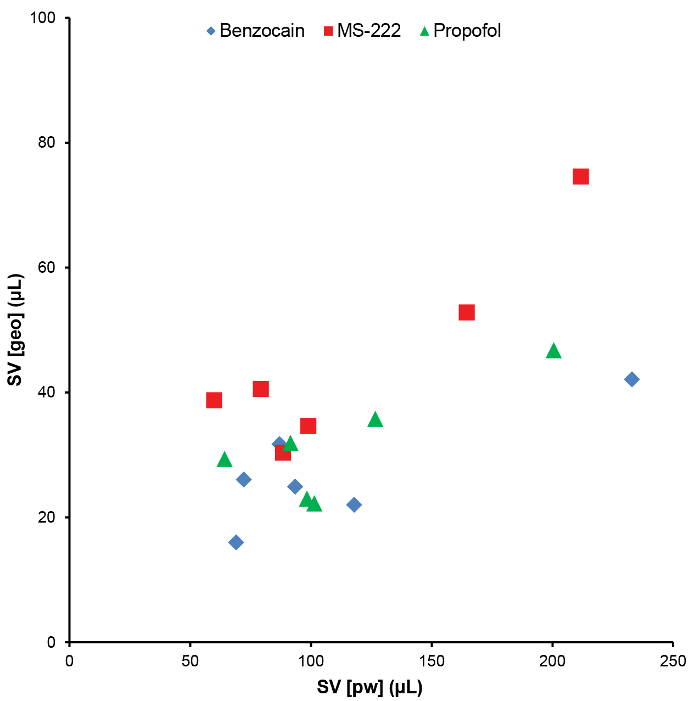
Figure 7. Comparison of stroke volume estimated by the geometric and the pulse wave Doppler method. Comparison of stroke volume (SV) estimated by either two-dimensional B-mode geometric (geo) measurements or pulse wave Doppler measurements on the velocity of blood exiting the outflow tract. SV(geo) and SV(pw) is recorded in the same six animals with seconds in between the two measurement types and using three different anesthetics, benzocaine (blue tilted squares), MS-222 (red squares), and propofol (green triangles) with one week of recovery between applying the different anesthetics. Please click here to view a larger version of this figure.
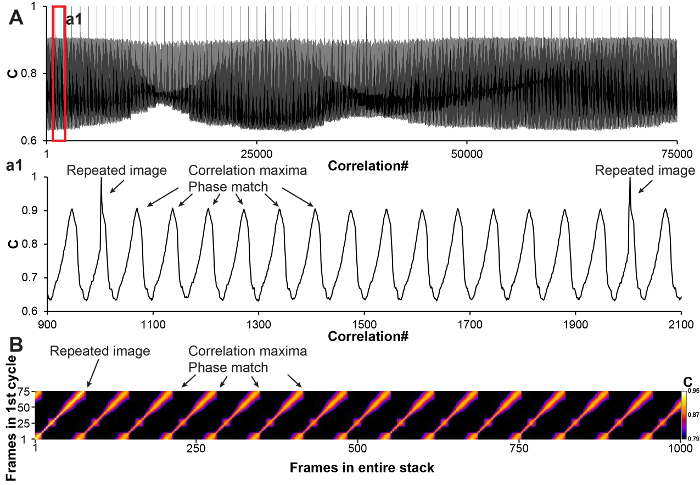
Figure 8. Representative spatiotemporal image correlation for 3D echocardiography. (A) Curve representation of yielded correlation values of a correlation operation in a 1,000 frame cine dataset with 75 frames per cardiac cycle. Two frames with only small differences, indicating matching cardiac phases, will yield a high correlation value. Subsequently a local maxima searching algorithm can be applied on the data to detect all matching frames. (B) Graphical representation of the same data as in (A). When correlation values are obtained by comparing the first cardiac cycle with the entire cine stack, diagonal lines of maximum correlation indicate matching cardiac phases. Please click here to view a larger version of this figure.
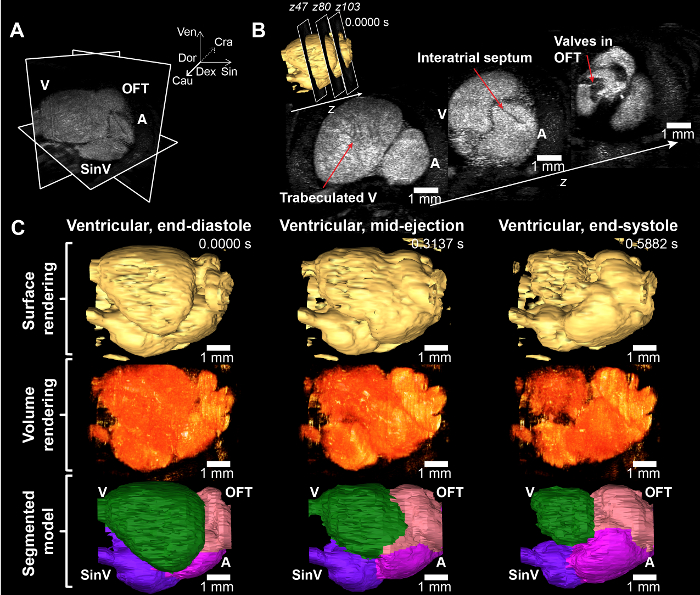
Figure 9. Representative 3D echocardiography. (A) Multi-planar view of 3D reconstructed axolotl heart. The spatiotemporal image correlation procedure allows for the reconstruction of a full cardiac cycle with several distinct phases (here 70 phases) in three spatial dimensions that can then be sliced as ones for desired investigation of spatiotemporal phenomena in the beating heart. (B) Three transversal slices of the reconstructed 115 slices 3D data. The quadratic averaging procedure enhances the blood-to-tissue contrast and lowers the signal-to-noise ratio allowing for a better appreciation of the trabeculated nature of the axolotl ventricle and a clear visualization of the interatrial septum and the valves in the outflow tract. (C) Surface and volume representations of the beating heart at three phases along a color coded segmented model (see Supplementary File 13 and Supplementary File 14 for video representations of the surface and volume rendered beating heart, and Supplementary File 15 for a three-phase segmented interactive 3D model). Anatomical abbreviations: A, atria; Cau, caudal; Cra, cranial; Dex, dexter (to the animal right); Dor, dorsal; OFT, outflow tract; Sin, sinister (to the animals left); SinV, sinus venosus; V, ventricle; Ven, ventral. Please click here to view a larger version of this figure.
Supplementary File 1. Transillumination to locate cardiac chambers in theaxolotl. See Figure 2C. Please click here to download this file.
Supplementary File 2. Long axis, midline view, B-mode. See Figure 3A, B. Please click here to download this file.
Supplementary File 3. Long axis, ventricular view, B-mode. See Figure 3C, D. Please click here to download this file.
Supplementary File 4. Long axis, ventricular view, Color Doppler mode. See Figure 3E, F. Please click here to download this file.
Supplementary File 5. Long axis, ventricular view, Power Doppler mode. See Figure 3G, H. Please click here to download this file.
Supplementary File 6. Long axis, atrial view, B-mode. See Figure 4A, B. Please click here to download this file.
Supplementary File 7. Long axis, atrial view, Color Doppler mode. See Figure 4C, D. Please click here to download this file.
Supplementary File 8. Long axis, outflow tract view, B-mode. See Figure 4E. Please click here to download this file.
Supplementary File 9. Long axis, outflow tract view, Color Doppler mode. See Figure 4F. Please click here to download this file.
Supplementary File 10. Short axis, ventricular view, B-mode. See Figure 5A, B. Please click here to download this file.
Supplementary File 11. Oblique paragill, outflow tract view, B-mode. See Figure 5C. Please click here to download this file.
Supplementary File 12. Oblique paragill, outflow tract view, Color Doppler mode. See Figure 5D. Please click here to download this file.
Supplementary File 13. Three-dimensional surface rendering of beating heart in 70 phases (19.6 ms temporal resolution). See Figure 9C. Please click here to download this file.
Supplementary File 14. Three-dimensional volume rendering of beating heart in 70 phases (19.6 ms temporal resolution). See Figure 9C. Please click here to download this file.
Supplementary File 15. Three-dimensional interactive model of beating heart in 3 phases: Ventricular end-systole, ventricular mid-ejection, and ventricular end-systole. See Figure 7C. The interactive PDF file should be viewed in Adobe Acrobat Reader 9 or higher. To activate the 3D feature, click the model. Using the cursor, it is now possible to rotate, zoom, pan the model, and in the model tree all segments of the model can be turned on/off or made transparent. The model tree is a hierarchy containing several sub layers that can be opened (+). Please click here to download this file.
Supplementary File 16. Representative annotated script for calculating the correlation value of a 1,000 frames acquisition with an upper estimation of 75 frames/cardiac cycle. The script is written in IJ1 macro language and can be implemented as a batch macro in ImageJ to calculate correlation values (75,000 per acquisition) across an entire z-stack of 3D data. Please click here to download this file.
Supplementary File 17. Representative script for automatic peak detection in a series of correlation values from a 1,000 frames acquisition with an upper estimation of 75 frames/cardiac cycle. The series of correlation values (Column B, marked in yellow) can be replaced and after activation of the macro (Ctrl + r) the list of commands to select matching cardiac phases and perform quadratic averaging will be displayed (Column Q, marked in green). Please click here to download this file.
Supplementary File 18. Representative annotated script to select matching cardiac phases and perform quadratic averaging of a 1,000 frames acquisition with an upper estimation of 75 frames/cardiac cycle (Column Q in Supplementary File 17). The script is written in IJ1 macro language and can be implemented as a macro in ImageJ to create an ensemble averaged one cycle (75 phases) 2D slice. Please click here to download this file.
Supplementary File 19. Representative annotated script for calculating the correlation value between a 70 frames reference slice and an adjacent 75 frames test slice. The script is written in IJ1 macro language and can be implemented as a macro in ImageJ to calculate correlation values (5,250). Please click here to download this file.
Supplementary File 20. Representative Excel script for automatic peak detection in a series of correlation values from a comparison between a 70 frames reference slice and an adjacent 75 frames test slice. The series of correlation values (Column C, marked in yellow) can be replaced and after activation of the macro (Ctrl + t) the list of slices to be selected as a substack in the test slice will be displayed (Column L, Row 2, marked in green). The test slice substack will have spatially matching frames to the reference slice. Please click here to download this file.
