We describe a system that utilizes three methods to evaluate the safety and effectiveness of placenta-targeted drug delivery: in vivo imaging to monitor nanoparticle accumulation, high-frequency ultrasound to monitor placental and fetal development, and HPLC to quantify drug delivery to tissue.
No effective treatments currently exist for placenta-associated pregnancy complications, and developing strategies for the targeted delivery of drugs to the placenta while minimizing fetal and maternal side effects remains challenging. Targeted nanoparticle carriers provide new opportunities to treat placental disorders. We recently demonstrated that a synthetic placental chondroitin sulfate A binding peptide (plCSA-BP) could be used to guide nanoparticles to deliver drugs to the placenta. In this protocol, we describe in detail a system for assessing the efficiency of drug delivery to the placenta by plCSA-BP that employs three separate methods used in combination: in vivo imaging, high-frequency ultrasound (HFUS), and high-performance liquid chromatography (HPLC). Using in vivo imaging, plCSA-BP-guided nanoparticles were visualized in the placentas of live animals, while HFUS and HPLC demonstrated that plCSA-BP-conjugated nanoparticles efficiently and specifically delivered methotrexate to the placenta. Thus, a combination of these methods can be used as an effective tool for the targeted delivery of drugs to the placenta and development of new treatment strategies for several pregnancy complications.
Placenta-mediated pregnancy complications, including pre-eclampsia, pregnancy loss, placental abruption and small gestational age (SGA), are common and lead to substantial fetal and maternal morbidity and mortality1,2,3, and very few drugs have been proven to be effective for treating pregnancy disorders4,5. The development of strategies for more selective and safer placenta-targeted drug delivery during pregnancy remains challenging in modern drug therapy.
In recent years, several reports have focused on the targeted delivery of drugs to uteroplacental tissues by coating nanoparticles with peptides or antibodies as placenta-targeted tools. These include an anti-epidermal growth factor receptor (EGFR)6 antibody, tumor-homing peptides (CGKRK and iRGD)7, placenta-targeted peptides8, placental vasculature-targeted peptides9 and antibodies against the oxytocin receptor10.
Here, we demonstrate that a synthetic placental chondroitin sulfate A binding peptide (plCSA-BP) can be used for the targeted delivery of nanoparticles and their drug payloads to the placenta11. The plCSA-BP-guided nanoparticles are complementary to the reported uteroplacental targeting methods because they target the placental trophoblast.
As a non-invasive method, in vivo imaging has been used to monitor placenta-specific gene expression in mice12, and indocyanine green (ICG) has been widely used to track nanoparticles using fluorescence imaging systems13,14,15. Thus, we intravenously injected plCSA-BP-conjugated nanoparticles loaded with ICG (plCSA-INPs) to visualize the plCSA-INP distribution in pregnant mice with a fluorescence imager. We then intravenously injected methotrexate (MTX)-loaded plCSA-NPs into pregnant mice. High-frequency ultrasound (HFUS), another non-invasive, real-time imaging tool16,17 was used to monitor fetal and placental development in the mice. Finally, we used high-performance liquid chromatography (HPLC) to quantify MTX distribution in the placentas and fetuses.
In this protocol, we describe in detail the three-method system used to assess the efficiency of placenta-targeted drug delivery by plCSA-BP-guided nanocarriers.
All mouse experiments strictly followed protocols (SIAT-IRB-160520-YYS-FXJ-A0232) approved by the Animal Care and Use Committee of Shenzhen Institutes of Advanced Technology, Chinese Academy of Sciences.
1. Synthesis of Placental Chondroitin Sulfate A-Targeted Lipid-Polymer Nanoparticles
2. In vivo Fluorescence Imaging
3. HFUS Evaluation of Embryonic Development
4. HPLC Analysis
Number | Final concentration (μg/mL) | 500 μg/mL standard, μL | Mobile phase(μL) |
1 | 0.5 | 1 | 999 |
2 | 1 | 2 | 998 |
3 | 2.5 | 5 | 995 |
4 | 10 | 20 | 980 |
5 | 25 | 50 | 950 |
6 | 50 | 100 | 900 |
7 | 100 | 200 | 800 |
Table 1. Prepare of standard curve for MTX. The final concentration of MTX standard solution is from 0.5-100 μg/mL.
In this manuscript, plCSA-BP-conjugated nanoparticles loaded with MTX (plCSA-MNPs) or ICG (plCSA-INPs) were intravenously injected into pregnant mice. In vivo imaging revealed strong ICG signals in the region of the uterus 30 min after plCSA-INP injection. The INPs were mainly localized to the liver and spleen region (Figure 1A). At 48 h after plCSA-INP injection, pregnant mice were sacrificed, revealing ICG signals only in the placenta, while with no signals were detectable in the fetus (Figure 1B).
We then used HFUS to monitor embryo development after the intravenous injection of nanoparticles. Biometric measurements included the gestational sac length (GS), fetal crown rump length (CRL), biparietal diameter (BPD), abdominal circumference (AC), placental diameter (PD), placental thickness (PT), umbilical artery peak velocity (UA), and fetal heart rate (HR) (Movie 1). The morphological parameters measured at different gestational ages are listed in Table 2. In the plCSA-MNP group, relative to the PBS group, the mean fetal abdominal circumference and umbilical artery peak velocity were significantly decreased at E12.5 (Figures 2A and 2H), and the crown rump length and placental diameter were significantly decreased at E10.5 (Figures 2B and 2F). Beginning on E9.5, the gestational sac length was also significantly decreased (Figure 2C), and the biparietal diameter, placental thickness, and fetal heart rate began to dramatically decrease on E 11.5 relative to those in the PBS group (Figures 2D, 2E and 2G). These findings together suggest that plCSA-MNPs have a strong cytotoxic effect on both fetal and placental development. Interestingly, treatment with MNPs also slightly impaired fetal and placental development (Figures 2A-2H), indicating that nanoparticles might improve the delivery of MTX to the placenta via the enhanced permeability and retention (EPR) effect.
Gestational age | Group | Decidua (mm) | GS (mm) | CRL (mm) | BPD (mm) | AC (mm) | PD (mm) | PT (mm) | HR (bpm) | UA (mm/s) |
E6.5 | 0.92±0.23 | / | / | / | / | / | / | / | / | |
E7.5 | PBS | / | 0.82±0.24 | 0.72±0.18 | / | / | / | / | / | / |
MNPs | / | 0.83±0.14 | 0.83±0.14 | / | / | / | / | / | / | |
plCSA-MNPs | / | 0.65±0.23 | 0.65±0.23 | / | / | / | / | / | / | |
E8.5 | PBS | / | 2.02±0.54 | 1.88±0.40 | 0.93±0.23 | / | / | / | / | / |
MNPs | / | 1.49±0.50 | 1.49±0.50 | 0.82±0.20 | / | / | / | / | / | |
plCSA-MNPs | / | 1.14±0.46 | 1.02±0.42 | 0.83±0.18 | / | / | / | / | / | |
E9.5 | PBS | / | 3.31±0.62 | 3.49±0.65 | 1.39±0.54 | / | / | / | / | / |
MNPs | / | 2.34±0.68 | 2.23±0.49 | 0.98±0.34 | / | / | / | / | / | |
plCSA-MNPs | / | 1.83±0.42 | 1.59±0.59 | 0.94±0.25 | / | / | / | / | / | |
E10.5 | PBS | / | 4.43±0.67 | 4.97±0.80 | 2.10±0.61 | 4.83±1.40 | 2.91±0.23 | 2.24±0.24 | 100±30 | 30.16±9.40 |
MNPs | / | 3.28±0.64 | 2.91±0.83 | 1.46±0.54 | 3.95±1.28 | 2.66±0.33 | 2.17±0.19 | 87±21 | 24.63±7.35 | |
plCSA-MNPs | / | 2.64±0.66 | 2.17±0.85 | 1.12±0.33 | 3.82±1.13 | 2.13±0.35 | 1.94±0.15 | 83±22 | 15.37±5.70 | |
E11.5 | PBS | / | 5.68±0.73 | 6.45±0.90 | 3.08±0.70 | 8.67±2.08 | 4.16±0.39 | 2.75±0.26 | 124±28 | 31.62±7.76 |
MNPs | / | 4.36±0.39 | 3.74±1.2 | 2.31±0.53 | 6.69±1.85 | 3.56±0.40 | 2.39±0.23 | 106±22 | 25.20±6.18 | |
plCSA-MNPs | / | 3.42±0.76 | 2.61±0.84 | 1.51±0.54 | 4.59±1.57 | 2.54±0.49 | 2.09±0.27 | 79±20 | 16.66±5.69 | |
E12.5 | PBS | / | / | 8.12±1.29 | 3.90±0.65 | 12.43±2.48 | 5.37±0.42 | 3.14±0.24 | 141±26 | 40.62±10.89 |
MNPs | / | / | 4.87±1.29 | 2.87±0.62 | 8.29±1.78 | 4.25±0.67 | 2.65±0.26 | 119±18 | 27.76±7.52 | |
plCSA-MNPs | / | / | 3.2±1.28 | 1.75±0.60 | 5.47±1.39 | 3.05±0.50 | 2.28±0.26 | 72±22 | 18.76±7.20 | |
E13.5 | PBS | / | / | 10.04±1.2 | 4.67±0.65 | 15.64±2.33 | 6.03±0.60 | 3.49±0.23 | 157±28 | 54.62±12.37 |
MNPs | / | / | 6.17±1.29 | 3.37±0.55 | 9.39±1.88 | 4.77±0.69 | 2.92±0.43 | 109±22 | 35.84±9.49 | |
plCSA-MNPs | / | / | 3.57±1.71 | 1.87±0.73 | 6.25±1.41 | 3.42±0.63 | 2.37±0.34 | 60±23 | 20.02±11.20 | |
E14.5 | PBS | / | / | 12.35±1.6 | 5.36±0.71 | 18.38±2.53 | 6.70±0.64 | 3.75±0.35 | 167±27 | 71.48±10.72 |
MNPs | / | / | 7.6±1.56 | 3.90±0.70 | 10.31±2.31 | 5.23±0.76 | 3.10±0.39 | 99±23 | 45.80±13.07 | |
plCSA-MNPs | / | / | / | / | / | / | / | / | / |
Table 2. Measure morphologic parameters of each gestational age. GS: Gestational sac length; CRL: Crown rump length; BPD: Biparietal diameter; AC: Abdominal circumference ; PD: Placental diameter; PT: Placental thickness; HR: Fetal heart rate; UA: Umbilical artery peak velocity; /: cannot measure.
We next measured MTX concentrations in the placentas and fetuses using HPLC. Using the HPLC operation parameters described above, the MTX retention time was determined to be 7 min, and MTX was detected in the placentas of the plCSA-MNP group (Figure 3). The MTX concentrations in placentas and fetuses were determined using MTX standard curves (Figure 4). 24 h after injection, the placental MTX level in the MNP group was significantly lower than that in the plCSA-MNP group, and no MTX was detected in fetuses of the plCSA-MNP group. MTX could still be detected in the placenta 48 h after plCSA-MNP injection (Figure 5). These results demonstrate that plCSA-MNPs cannot cross the placenta, thus minimizing potential adverse effects on the fetus.
In summary, this three-method system comprised of in vivo fluorescence imaging, HFUS, and HPLC can be employed to determine how well a drug delivery vehicle targets nanocarriers and delivers drugs to the placenta. Using these methods, we have demonstrated that plCSA-BP guided nanoparticles are an efficient tool for targeting the delivery of drugs to the placenta.
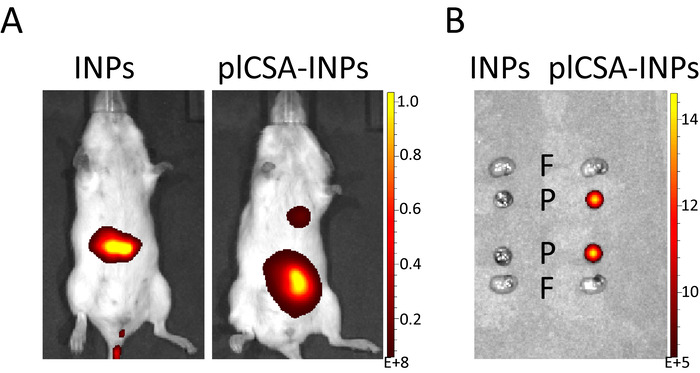
Figure 1. In vivo fluorescence imaging. (A) Pregnant mice (n=5 each) at E11.5 were injected with INPs or plCSA-INPs (ICG equivalent 5 mg/kg) via the tail vein. After 30 min, the mice were imaged using a fluorescence imaging system. (B) 48 h after the injection of INPs or plCSA-INPs, the fetuses (F, n=2 per mouse) and placentas (P, n=2 per mouse) were collected and imaged with a fluorescence imaging system. Please click here to view a larger version of this figure.
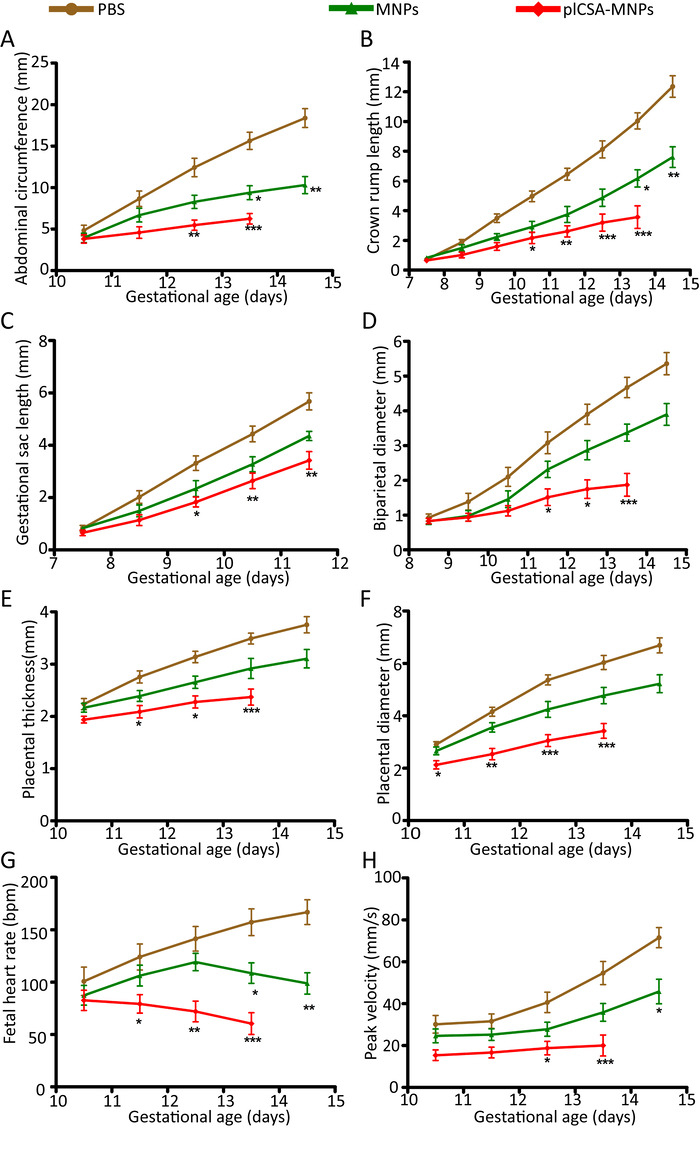
Figure 2. Quantification of embryonic growth by HFUS. (A) The abdominal circumference (n = 30-51 embryos/day), (B) crown rump length (n = 30-51 embryos/day), (C) gestational sac length (n = 10-30 embryos/day), (D) biparietal diameter (n = 30-51 embryos/day), (E) placental thickness (n = 30-51 embryos/day), (F) placental diameter (n = 30-51 embryos/day), (G) fetal heart rate (n = 20-33 embryos/day), and (H) umbilical artery peak velocity (n = 12-36 embryos/day) as measured non-invasively by ultrasound in vivo. All tests were compared by 2-tailed paired t-test, and p < 0.05 was considered statistically significant. Values are expressed as the means ± SD. *p < 0.05, **p < 0.01, ***p < 0.001 compared to the PBS group. Please click here to view a larger version of this figure.
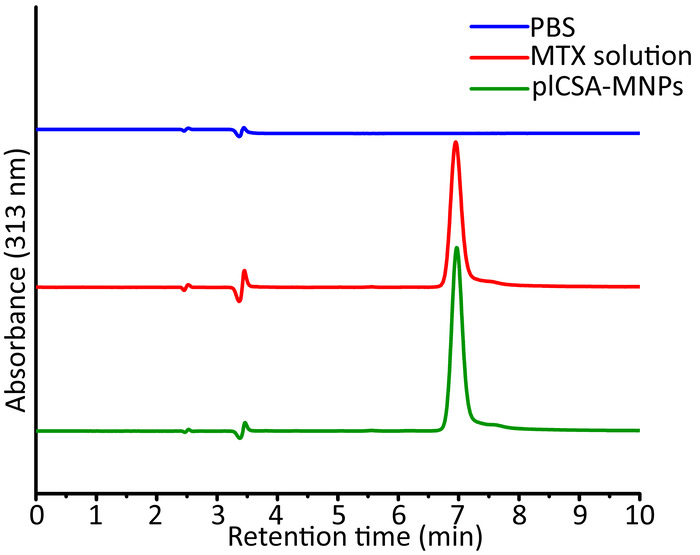
Figure 3. Representative HPLC chromatograms of placental samples. Pregnant mice (n=5 each) were intravenously injected with PBS or plCSA-MNPs, and their placentas (n=15 each group) were collected 24 h later for HPLC. Using a standard solution of MTX with UV detection at 313 nm, the retention time was determined to be 7 min. Please click here to view a larger version of this figure.
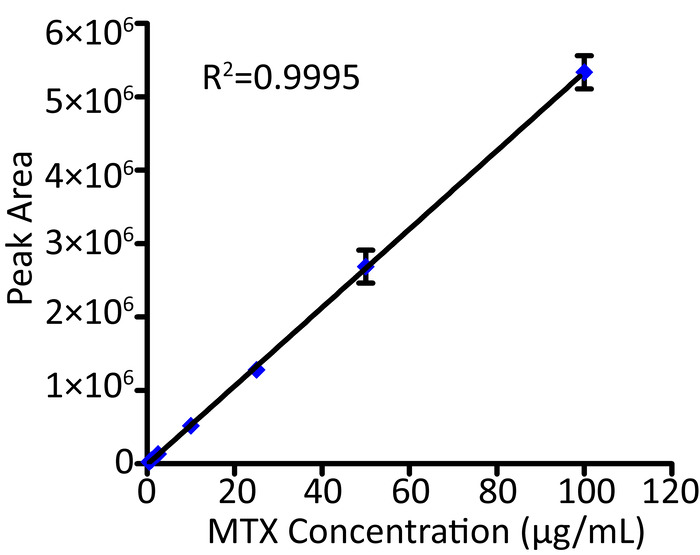
Figure 4. Standard curves for MTX. The concentrations of MTX ranged from 0.5 μg/mL to 100 μg/mL. The data represent the mean ±SD for n=3. The error bars of some data are smaller than the rhombic symbols. Please click here to view a larger version of this figure.
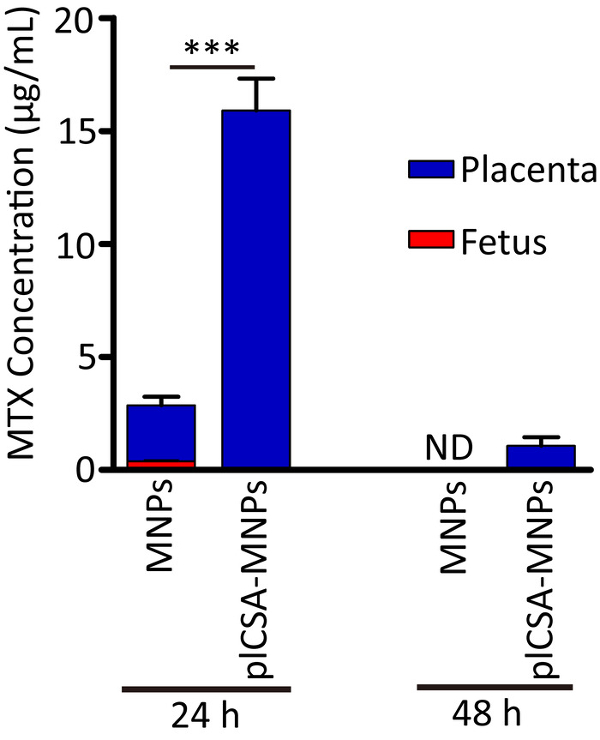
Figure 5. Application of HPLC to determine the biodistributions of nanoparticles in placentas and fetuses. Pregnant mice were administered a single injection of MNPs or plCSA-MNPs (1 mg/kg MTX equivalent) at gestational stage E13.5. After 24 h and 48 h, the concentrations of MTX in the placentas (n = 15) and fetuses (n = 15) were measured by HPLC. Values are expressed as the means±SD. Differences in MTX concentrations between the MNP and plCSA-MNP groups were analyzed using unpaired Student's t-test (***p < 0.001); nd: not detected. Please click here to view a larger version of this figure.
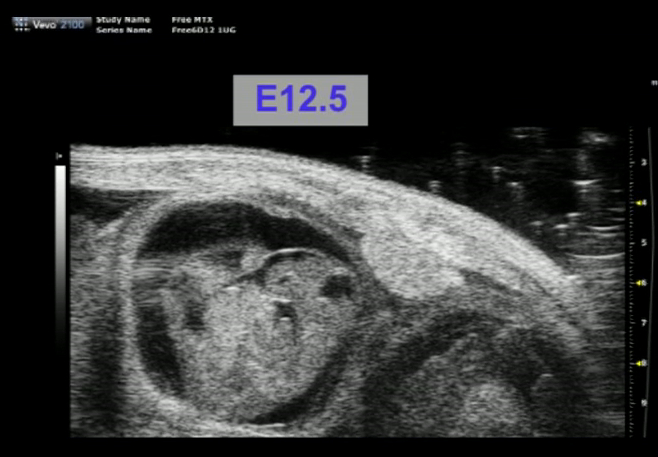
Movie 1. HFUS images of fetuses and placentas illustrating biometric measurement locations. Please click here to view this video. (Right-click to download.)
In this manuscript, we outline a three-method system for determining whether plCSA-BP-guided nanoparticles are an efficient tool for targeting the delivery of drugs to the placenta. The use of in vivo imaging to monitor the infrared fluorescent ICG signal confirmed the placental targeting specificity of plCSA-BP. Using HFUS and HPLC, we demonstrated that plCSA-BP-conjugated nanoparticles can efficiently deliver MTX only to the placenta cells, not to the fetus.
In the in vivo fluorescence imaging experiments, the gestational ages of pregnant mice are important. The placenta begins to form around E9.521. Additionally, considering the resolution of the imager, the in vivo imaging experiment should be performed after E 10.5. After plCSA-INP injection at E 11.5 according to this protocol, no fluorescence signal was detected with the imager under the described conditions, which may have been due to the skin and internal organs preventing signal transmission22. To overcome this limitation, increasing the injection dose or collection of placentas and fetuses for ex vivo imaging must be utilized.
A critical step in HFUS imaging is the use of a suitable transducer to obtain high-quality embryonic images. The optimized frequency for mouse embryology imaging is 40-50 MHz. Moreover, maintaining the physiological body temperature of the pregnant mouse prior to acquiring images is also important. Finally, the observer should be careful when recording B-mode movies during early embryo development (E 6.5-E 8.5), and this is more dependent on experience. The uncertainty in measurement may be compensated by comparing anatomical features with the frame of reference to fetus and placental movement during ultrasound processing16,23,24. The accuracy of imaging data may be improved by making multiple measurements and increasing the numbers of the fetuses and placentas.
The unbound residual nanoparticle in the blood vessel is an effective factor for evaluating the targeted drug delivery to the placenta and fetus. Thus, cardiac perfusion was performed to remove unbound nanoparticles before the fetuses and placentas were collected. Previous studies7,8,9 have also noted that before analyzing the ability of a peptide to bind the placenta, subjecting the mouse to cardiac perfusion is essential.
A possible pitfall during HPLC analysis is the overlap of MTX with other peaks. Acetonitrile is used to elute MTX from the column. If the overlapping peaks occur before 5 min, decreasing the concentration of acetonitrile in the mobile phase may be helpful. If no peaks or overlapping peaks occur after 30 min, increasing the concentration of acetonitrile is useful. A main limitation of HPLC is that it does not reveal the localization of nanoparticles within the placenta. The plCSA-BP-guided nanoparticles specifically targeted the placental labyrinth in the mouse placenta11. Thus, morphological analysis of the placenta is necessary.
This is the first use of combining in vivo imaging, HFUS, and HPLC to determine the efficiency of placenta-targeted delivery guided by a peptide. HFUS has emerged as an advanced, non-invasive, safe, real-time imaging method and has been used successfully for the high-resolution imaging of mouse embryonic development17,25,26. Although in vivo fluorescence imaging has been widely used to visualize tumor formation and metastasis in live mice27,28,29, it has not previously been used in the study of placental drug delivery. As an alternative approach, in vivo fluorescence imaging has a distinct advantage over HFUS in being able to directly visualize the distribution of intravenously injected nanoparticles in live mice but cannot monitor placental and fetal development. Hence, we combined the advantages of visualization by fluorescence in vivo imaging and high-resolution HFUS-the former enabling visualization of plCSA-BP-guided INPs in vivo, and the latter enabling in vivo monitoring of the effects of plCSA-MNPs on both placental and fetal development and survival. Furthermore, HPLC confirmed that plCSA-MNPs were specifically delivered to placentas and did not reach the fetuses.
Targeted nanomedicine is a new development in the field of pregnancy disorders, and substantial new approaches to specifically deliver drugs to the maternal organs are needed to treat pregnancy disorders in the clinic30. The three-method system described in this protocol is a combination of the in vivo time course imaging of both nanoparticle targeting and the corresponding effects on placental and fetal development, allowing for more precise biochemical measurement of the amount of drug in tissues to evaluate tools for targeted placenta delivery for the treatment of placenta-mediated pregnancy complications.
The authors have nothing to disclose.
This work was supported by grants from the National Natural Sciences Foundation (81771617) and the Natural Science Foundation of Guangdong Province (2016A030313178) awarded to X.F.; a grant from the Shenzhen Basic Research Fund (JCYJ20170413165233512) awarded to X.F; and the Eunice Kennedy Shriver National Institute of Child Health & Human Development of the National Institutes of Health under Award Number R01HD088549 (the content is solely the responsibility of the authors and does not necessarily represent the official views of the National Institutes of Health) to N.N.
CD-1 mice | Beijing Vital River | 201 | Female (8-12 week) |
Insulin syringe | BD | 328421 | for IV injection |
Ethanol absolute | Sinopharm Chemical | 10009218 | for nanoparticles synthesis |
Soybean lecithin | Avanti Polar Lipids | 441601 | for nanoparticles synthesis |
DSPE-PEG-COOH | Avanti Polar Lipids | 880125 | for nanoparticles synthesis |
PLGA | Sigma-Aldrich | 719897 | for nanoparticles synthesis |
Ultrasonic processor | Sonics | VCX130 | for nanoparticles synthesis |
Methotrexate (MTX) | Sigma-Aldrich | V900324 | for nanoparticles synthesis |
Indocyanine green (ICG) | Sigma-Aldrich | 1340009 | for in vivo imaging |
phosphate-buffered saline (PBS) | Hyclone | SH30028.01 | |
IVIS spectrum instrument | Perkin Elmer | for in vivo imaging | |
Ultrasound transmission gel | Guanggong | ZC4252418 | for ultrasound imaging |
Isoflurane | Lunan Pharmaceutical | I0040 | for maintain the anesthesia |
Depilatory cream | Nair | TMG001 | for removing fur |
40 MHz transducer | VisualSonics | MS550S | for ultrasound imaging |
High-frequency ultrasound imaging system | VisualSonics | Vevo2100 | for ultrasound imaging |
Avertin | Sigma-Aldrich | T48402 | for anesthesia |
Syringe pump | Mindray | SK-500III | forcardiac perfusion |
0.9% saline solution | Meilunbio | MA0083 | forcardiac perfusion |
1.5 mL Polypropylene tubes | AXYGEN | MCT-150-C | |
-80 °C freezer | Thermo Fisher Scientific | 88600V | |
Centriguge | Cence | H1650R | |
Perchloric acid | Sigma-Aldrich | 311421 | for precipitating protein |
Homogenizer | SCIENTZ | SCIENTZ-48 | for homogenizing tissue |
Syringe filter (0.45 μm) | Millipore | SLHV033RS01 | |
Sodium hydroxide | Sinopharm Chemical | 10019763 | for solving MTX |
HPLC vials | Waters | 670650620 | for HPLC |
Potassium phosphate dibasic | Sinopharm Chemical | 20032117 | for HPLC |
Acetonitrile | JKchemical | 932537 | for HPLC |
C18 column | Waters | 186003966 | for HPLC |
HPLC system | Shimadzu | for HPLC |