1. Preculture Procedure
NOTE: Recombinant CHO DG44 cells with a viable cell concentration of 1 x 10⁷ cells/mL are used for this protocol.
- Thaw the vial containing 1.2 mL of cells to room temperature and immediately transfer the cell suspension to a 15 mL conical centrifuge tube containing 10 mL of cold seed medium.
- Centrifuge the conical centrifuge tube for 5 minutes at 190 x g and room temperature and discard the supernatant.
- Pre-heat 150 mL of the seed medium in a 500 mL shake flask to 36.8 °C.
- Gently resuspend the cell pellet in 10 mL of pre-warmed seed medium and transfer the cells into the shake flask.
- Use 1 mL of the sample from the flask to measure the initial VCC and viability using a cell counter.
NOTE: The viability should be above 70% after thawing for successful cultivation. - Incubate the shake flask in an orbital shaker (shaker diameter of 19 mm) at 36.8 °C and 7.5% CO2 with a shaking rate of 120 rpm.
NOTE: These conditions vary depending on the cell strain and medium. - Three days after passaging the cells, remove the shake flask from the shaker and place it under the laminar flow cabinet. Take 1 mL of sample to measure the final cell concentration. Calculate the volume to be transferred to fresh pre-warmed seed medium such that the initial cell concentration in the new passage is 2 x 10⁵ cells/mL.
- Passage the cells 5 times in total before transferring to the bioreactor for the main cultivation.
2. Main Cultivation
- Measure the final cell concentration of the preculture. Calculate the volume to be transferred to the bioreactor such that the initial cell concentration in the reactor is 3 x 10⁵ cells/mL.
- Fill the reactor with production medium a day before the inoculation to equilibrate the reactor and set the process parameters such as temperature, pH and DO.
NOTE: The cultivation conditions are 36.8 °C and 60% dissolved oxygen concentration (DO). We tested stirrer speeds of 1050 rpm and 1300 rpm along with pHs of 6.9, 7.1, and 7.3. The total duration of the cultivation is 12 days until the cells are harvested. The batch process runs for 72 hours after which the feed medium is added every 24 h. The protocol to be used for the cultivation is listed in detail in the next segment.
3. Writing the Recipe in the Automated Micro-bioreactor Software
NOTE: There are two ways of writing a recipe in the AMBR cell culture software: it is created either by using a wizard or by adding each step manually. For the purpose of this protocol, steps using the wizard are shown.
- Creating a new experiment
- Open the AMBR cell culture software and in the Introduction tab click on Create New Experiment.
- Loading the recipe
- In the New Experiment tab, enter the name of the experiment along with the date on which it is to be conducted.
- Activate the check point for the culture station and the vessels to be used during the cultivation. The Auto Add DOE Tags will also be activated for an easy transition during the programming of the DOE experiment. Click on Next to switch to the next tab.
- Set information about addition of media into the vessel along with antifoam, inoculum, feed and glucose.
- Activate the Add Media Plate check point. Define the Plate type, name and location of the plate containing the medium.
CAUTION: Depending on the type of plate and if the plate contains a lid, activate the check on Is Lidded to ensure smooth functioning of the liquid handler - Click on Add Media To Vessels. Enter the volume of the media to be added into the vessels. Define the mapping of the transfer of the media from the plate to the vessels. Click on Next to switch to the next tab.
- Activate the Add Media Plate check point. Define the Plate type, name and location of the plate containing the medium.
- Set the cultivation conditions in the reactor.
- After the media information has been fed into the software, assign the cultivation conditions. Click on Condition Media and fill in the temperature, target DO, upper pH limit and stirring RPM (Up stirring or Down stirring).
- Set addition of inoculums into the vessels.
- Activate Add Cell Plate. Define the plate type, name and location of the plate containing the medium.
- Click on Add Cells To Vessels. Enter the time of inoculation and the volume of the media to be added to the vessels.
- Define the path travelled by the liquid handler to the transfer of the cell from the plate to the vessels. Click on Next to switch to the next tab.
NOTE: Ensure Reuse Pipette Tips is deactivated to avoid cross-contamination and incorrect initial viable cell concentration.
- Set addition of feed, glucose and antifoam.
NOTE: The procedure for addition of feed, glucose and antifoam is similar to each other. For the sake of this protocol the procedure is listed for “Feed”. This can be replicated for glucose and antifoam.- Activate the Add Feed Plate and define the plate type, name and location. Click on Add Feed To Vessels and enter the volume of the feed to be added to the vessels. Define the mapping of the transfer of the feed from the plate to the vessels.
- Depending on the cultivation, add the number of feed addition. For this cultivation, the reactor is fed after 72 hours for every 24 hours.
- Manually add the time delay between the feeding by entering the data into Delay from cells added. The first day of feeding is after 72 hours of inoculation and the next one is after 96 hours and so on.
NOTE: Antifoam addition is programmed to be added every day to avoid foaming during the cultivation.
- Set sampling during the cultivation.
- Activate the Add Sample Plate and define the plate type, name and location.
- Check on Take Sample from Vessels and enter the volume of the sample to be removed from the vessels. Define the mapping of the transfer of the sample from the vessels to the plate. Ensure that the volume does not decrease below 10 mL during the entire course of cultivation.
- Add the number of samples to be taken during the cultivation. Similar to feeding, add the time of the sample being removed from the vessel for each input sample point.
- Save the process. It is now ready for execution.
NOTE: To ensure the smooth running of the protocol, switch to the Process Steps tab in the AMBR cell culture software and select Process Step view to visualize the flow of the recipe.
- In the New Experiment tab, enter the name of the experiment along with the date on which it is to be conducted.
- Design of experiment in the automated micro bioreactor
- In order to run the DOE software of the bioreactor, ensure that the recipe in the main software is saved and ready to use.
- Open the AMBR 15 DOE software and click on Investigation and select 신규.
- Enter the name of the new DOE investigation in the Create Investigation dialog box.
- In order to assign an experiment to the DOE investigation, open the recipe created to study the different parameters. Click on 열람 and select the respective experiment.
- Define the DOE factor.
- The vessel tags are already enlisted in the column. To define the desired DOE factor, select the parameter and click on the column labeled DOE factor. Select 신규 and add the units, abbreviation, lower and upper limit of the factors (e.g., temperature, DO, pH).
- Define the response factor.
- Once the DOE factors have been defined, define the response based on which the experimental analysis would be structured.
- In the Responses tab, define the values to be considered for the analysis of the data.
- Click on Edit DOE Responses and define the name of the response, abbreviation, units, minimum and maximum limits (e.g., titer, viable cell concentration).
- Once the responses are defined, select the AMBR variable for each response and define the variable. A response can be automatically associated with a micro-bioreactor variable, Choose the required variable from the drop-down list.
- Change the equation for each of the response depending on the requirement. The choice is between the minimum, maximum, first, last and average data.
- Create a design.
- Use the Start Design Wizard in order to select the type of experimental design, to add or remove the number of replicates and center points.
- Select the objective, which determines the choice of designs and models:
Screening: Uses linear and interaction models to find the important factors
Optimization (RSM), Uses quadratic and cubic models for detailed modeling and optimization
Split objective: Models for formulation and process factors can be chosen separately - Once the objective is decided upon, select the model and the design along with the number of center points and replicates.
- Click on Finish and switch to the next tab.
- Define the experiment.
NOTE: The DOE factors are listed in the right column of the software. On selecting the desired factors, the vessels running that experiment with the desired parameter would be highlighted. The vessels within the culture station can be moved around by right clicking on the vessel and moving it to the desired location.- Create work packets that can be imported in the AMBR cell culture software. Depending on the number of experiments the different work packets are created and stored for further implementation
- Execution of the experiment in the work packets created on the AMBR control laptop
- In the Experiment tab, click on Create DOE Experiment and browse for the work packet created using the DOE software.
- Initialize the process by clicking Start.
- Analysis of experimental results
- Once the experiment has been executed, export the data using Export DOE Results. The Export DOE Results window opens and the rows indicating the culture vessel and station are listed in the table.
- Select the desired rows and click on Exported Selected Rows or Export Experimental data to store all the results and save the file for further analysis.
- Import the data into the AMBR DOE module by switching to the Results tab and selecting Import Results.
- Browse for the desired data file and click the Analysis Results.
- Analyze the results further in MODDE.
4. Execution of Cultivation in the Automated Micro-bioreactor
NOTE: The following steps are executed by the user with the help of the protocol written in the aforementioned software. The steps are carried out by the user unless mentioned otherwise.
- Loading the vessels
- Open the gamma sterilized culture vessels under a laminar flow cabinet and orient in the culture station as depicted in Figure 2.
- Clean the clamp plate with 70% ethanol and double distilled water. Then, autoclave the plate and place on top of the vessel.
- Mount the clamp plate with a stirrer plate, ensuring each pin is fixed firmly.
- Tighten both the stirrer plate and clamp plate onto the stirring assembly.
- Running the micro-bioreactor software
- Use the program written in Section 3 to run the cultivation.
- Visualize the process steps scheduled or completed in the Process tab. Alter the cultivation steps during the process run as needed by first pausing the liquid handler and then editing the process recipe.
- Add antifoam to the vessels before the stirrer is started to ensure there is no excessive foaming during the cultivation. The antifoam will be added regularly, and the foam detected visually.
- Addition of media into the vessel
- Fill the 24 well plate provided with the micro-bioreactors manually with sterile media and place in the designated deck of the system. Ensure the plate is placed in the deck designated by the written program (section 3). The filling of the vessel will take place as designed in section 3.2.2.
NOTE: The temperature and stirrer start immediately after the addition of the media and the antifoam. The sensor reader is activated 1 hour after the vessel is filled (Start Monitor step). Gassing to each vessel commences once the reader has been activated. Media is left to equilibrate for a minimum of 6 hours before pH recalibration and inoculation. The process parameters can be altered in the software as mentioned in section 3.2.3.
- Fill the 24 well plate provided with the micro-bioreactors manually with sterile media and place in the designated deck of the system. Ensure the plate is placed in the deck designated by the written program (section 3). The filling of the vessel will take place as designed in section 3.2.2.
- Inoculation
- Measure the viable cell concentration after the 5th passage. Calculate the number of cells to be transferred to the vessels to ensure that the initial cell concentration in all the vessels is 3 x 10⁵ cells/mL.
- Transfer the cells to a 24 deep well plate such that the volume of the suspension is at least 1.6 times the required volume. For a required volume of 2 mL of the inoculum, transfer 3.2 mL of cell suspension into each well in the plate.
- Place the 24 well plate in the designated deck. The vessels will be inoculated as in section 3.2.4.
- Daily sampling and analytics
- Remove a 460 μL sample from the vessels every day using the liquid handler. Dilute 200 µL of the sample with 800 µL of filtered 1x PBS buffer (5x dilution), and then place in the cell counter.
- Centrifuge the remaining sample for 5 min at 190 x g and room temperature and store the supernatant for further analysis (glucose, lactate, glutamine and glutamate).
- Freeze 100 µL of the supernatant at -20 °C until the end of the cultivation for protein quantification.
- End of cultivation
- When the process parameter control (i.e., temperature, agitation, pH and DO) has terminated, stop the monitoring of the process.
- Unscrew the stirrer plate and clamp plate.
- Remove the culture vessels and clean the culture stations. Place the drying plates on the culture stations and screw them in.
- Meanwhile, clean the clamp plates thoroughly with 70% ethanol and double distilled water.
- Click on Stop in the bioreactor software once the drying cycle is completed.
- Cell culture harvest
- Harvest cells on Day 12 of the cultivation by manually removing the content of the vessels into 50 mL centrifuge tubes. Centrifuge the cell broth at 190 x g for 30 min.
- Discard the cell pellet and store the supernatant at -20 °C.
5. Measuring mAb Concentration
- Use a 1.7 mL Protein A column for the quantification of the protein during the cultivation run.
- Prepare the equilibration and elution buffer before thawing the samples.
- Use a solution of 0.5 M Na2HPO4 containing 0.5 M NaCl with a pH of 7.9 as the equilibration buffer and a solution of 100 mM glycine containing 0.5 M NaCl with a pH of 2 as the elution buffer.
- Filter both buffers through a 0.2 µm membrane and degas before being placed for the analysis.
- Purge the high-performance liquid chromatography system (HPLC) with freshly prepared equilibration buffer.
- Load the protein A column on to the HPLC system.
- Carry out chromatography with a flow rate of 1 mL/min. Set the column oven temperature at 30 °C and autosampler temperature at 10 °C
- Thaw the frozen samples at room temperature and filter 225 µL of each sample through a 0.22 µm PVDF membrane. Dilute the samples with higher concentration of the desired protein are in a 1:20 ratio with equilibration buffer and filter through the membrane before placing in the autosampler.
- Place the samples in the autosampler. Load the method and sequence in the software and start the sequence.
NOTE: The method is comprised of three phases (see Figure 1): injection of the sample into the column for the first two minutes; followed by elution buffer for 8 min and column regeneration with equilibration buffer for 10 min.
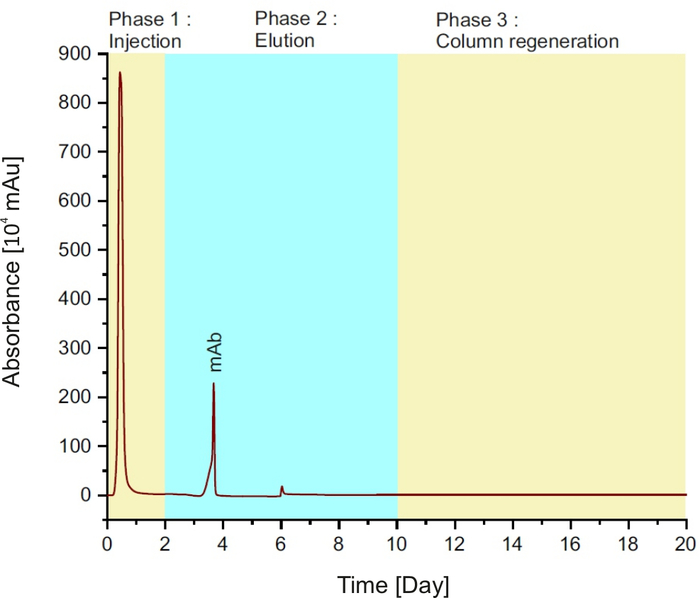
Figure 1: Protein A chromatogram, representing the different phases during a single run. Please click here to view a larger version of this figure.
An overview of the cultivation performed in this study is presented in Figure 2.
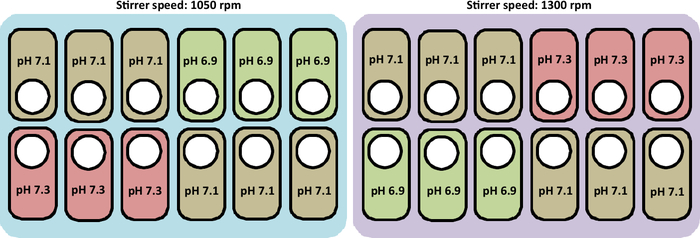
Figure 2: Schematic representation of the experimental conditions to test pH and stirrer speed profiles in the culture stations. The figure also represents the correct layout to place the vessels. Please click here to view a larger version of this figure.
The cell growth in the automated micro-bioreactors is comparable to the multi-use bioreactors. This is depicted in Figure 3. The cell concentration from the three different scales is compared and it is observed that the 15 mL automated micro-bioreactor mimics the 2 L glass bioreactor. The results from the shake flask are also compared to exhibit the benefit of the AMBR.
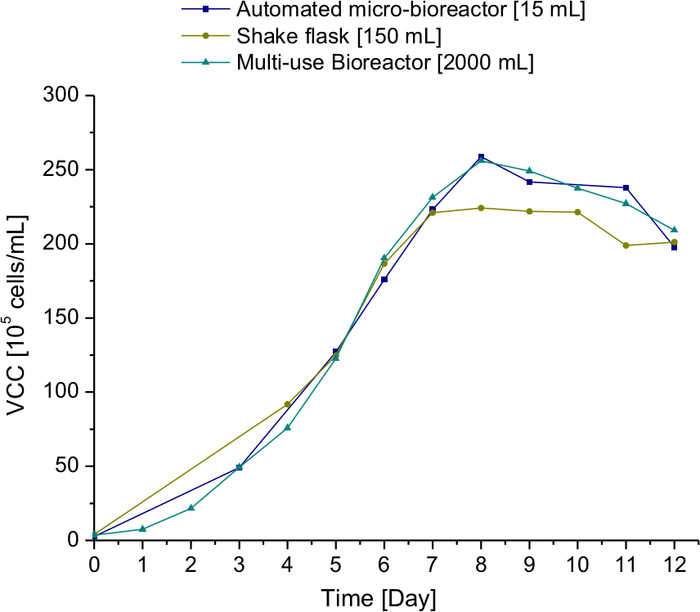
Figure 3: Comparison of the viable cell concentration at different scales. 15 mL micro-bioreactor, 150 mL shake flask, and 2 L multi-use glass bioreactor. Please click here to view a larger version of this figure.
The influence of different stirrer speed and pH is studied in the automated micro-bioreactors. Viable cell concentration (VCC) is one of the vital parameters to compare the cultivation. Figure 4 represents the comparison of the VCC and monoclonal antibody concentration in the different micro-bioreactors. Figure 5 represents the response contour plot of the two responses considered for the comparison, namely, VCC and mAb concentration. The values are comparable in the vessels with the same pH and different stirrer speed, indicating that the stirrer speed selected for this process has no significant influence on the process output. For future cultivations, the stirrer speed of 1050 rpm would be used in order to avoid foaming.
The pH, however, has a conspicuous impact on the process output data. The negative influence of pH 6.9 on the VCC can be observed in the Figure 4A. The growth of the cells improved significantly under the culture at pH 7.3 compared to pH 7.1. In Figure 5B, the monoclonal antibody concentration of the different cultivations is compared. The production of the mAb is slower in the vessels maintained at pH 7.3; however, the final product concentration is comparable to the vessel maintained at pH 7.1.
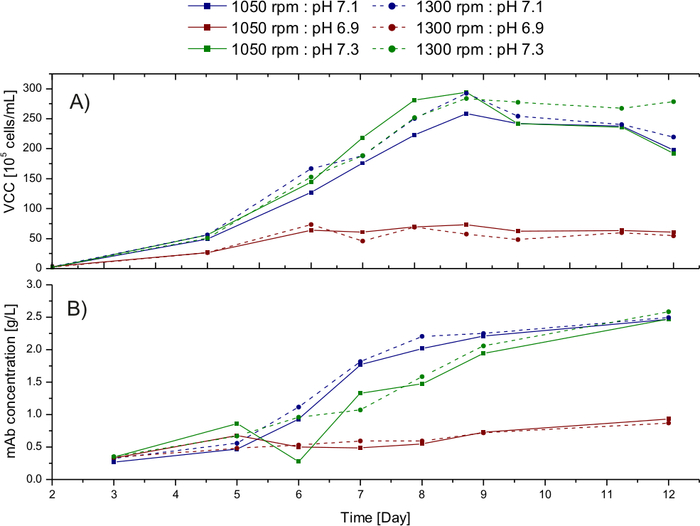
Figure 4: Result of the DOE experiment. (A) Viable cell concentration profile of the cultivation run to study the influence of pH and stirrer speed (B) Monoclonal antibody concentration profile over the fed-batch process in the respective cultivation conditions. Please click here to view a larger version of this figure.
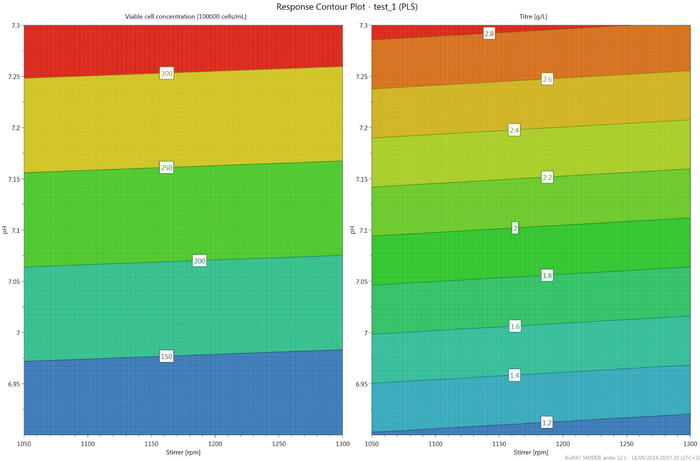
Figure 5: Response contour plot indicating the influence of pH and stirrer speed on the maximum viable cell concentration and monoclonal antibody, respectively. Please click here to view a larger version of this figure.
One of the advantages of using the AMBR is the continuous monitoring and control of the cultivation. The monitoring of the pH can be observed in Figure 6. The pH is controlled at the set point using CO2. The bolus feeding from Day 3 is responsible for the spike in the values.
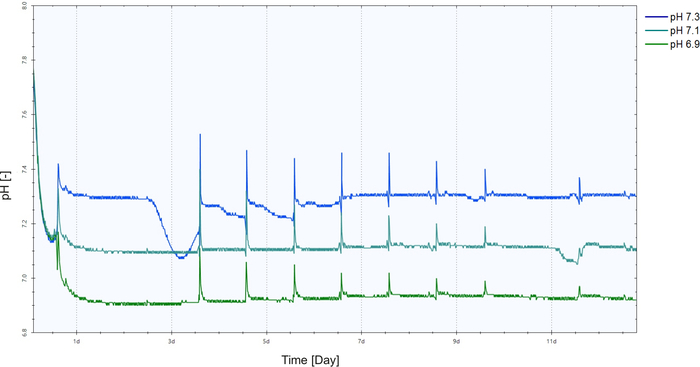
Figure 6: pH monitoring in the automated micro bioreactors for the cultivation, with set points of pH 6.9, 7.1 and 7.3 and a stirrer speed of 1050 rpm. Please click here to view a larger version of this figure.
The process parameters used for the future tests was narrowed down to a stirrer speed of 1050 rpm and pH of 7.1.
