Despite the advancements in multiplex immunohistochemistry and multispectral imaging, characterizing the density and clustering of major immune cells simultaneously in the endometrium remains a challenge. This paper describes a detailed multiplex staining protocol and imaging for the simultaneous localization of four immune cell types in the endometrium.
Immunohistochemistry is the most commonly used method for the identification and visualization of tissue antigens in biological research and clinical diagnostics. It can be used to characterize various biological processes or pathologies, such as wound-healing, immune response, tissue rejection, and tissue-biomaterial interactions. However, the visualization and quantification of multiple antigens (especially for immune cells) in a single tissue section using conventional immunohistochemical (IHC) staining remains unsatisfactory. Hence, multiplexed technologies were introduced in recent years to identify multiple biological markers in a single tissue sample or an ensemble of different tissue samples.
These technologies can be especially useful in differentiating the changes in immune cell-to-cell interactions within the endometrium between fertile women and women with recurrent miscarriages during implantation. This paper describes a detailed protocol for multiplexed fluorescence IHC staining to investigate the density and clustering of four major immune cell types simultaneously in precisely timed endometrial specimens during embryo implantation. The method includes sample preparation, multiplex optimization with markers for immune cell subtypes, and the scanning of the slides, followed by data analysis, with specific reference to detecting endometrial immune cells.
Using this method, the density and clustering of four major immune cell types in the endometrium can be simultaneously analyzed in a single tissue section. In addition, this paper will discuss the critical factors and troubleshooting to overcome possible fluorophore interference between the fluorescent probes being applied. Importantly, the results from this multiplex staining technique can help provide an in-depth understanding of the immunologic interaction and regulation during embryo implantation.
Recurrent miscarriage (RM) can be defined as the loss of two or more pregnancies before 24 weeks of gestation1. This frequent reproductive condition affects up to 1% of couples worldwide2,3. The pathophysiology is multifactorial and can be divided into embryologically driven causes (mainly due to an abnormal embryonic karyotype) and maternally driven causes that affect the endometrium and/or placental development. This manifestation can result from parental genetic abnormalities, uterine anomalies, prothrombotic conditions, endocrinology factors, and immunological disorders4.
In recent years, immune effector cell dysfunction has been implicated in the pathogenesis of early pregnancy loss5. This has inspired many investigations into elucidating the specific populations of immune cells in the endometrium during the menstrual cycle, implantation, and early pregnancy, with specific roles in early pregnancy. Among these immune cells, uterine natural killer (uNK) cells play a critical role during embryo implantation and pregnancy, particularly in the processes of trophoblastic invasion and angiogenesis6. Studies have shown an increased uNK cell density in the endometrium of women with RM7,8, although this finding was not associated with an increased risk of miscarriage9. However, this stimulated research evaluating the density of other immune cell types (such as macrophages, uterine dendritic cells) in the endometrium in women with RM10, 11. Nevertheless, it remains uncertain whether there is a significant alteration in the immune cell density in the peri-implantation endometrium in women with RM.
One possible explanation for the uncertainty is that evaluation of the endometrial immune cell density might be difficult due to the rapid changes in the endometrium during the window of implantation. During the 24 h timeframe, significant changes in the endometrium alter immune cell density and cytokine secretion, introducing a source of variation in these results12. In addition, most reports mainly rely on the use of single-cell staining (e.g., traditional IHC methods) that could not examine multiple markers on the same tissue section. Although flow cytometry can be used for detecting multiple cell populations in a single sample, the large amounts of cells required and the time-consuming optimization hinder the popularity and efficiency of this method. Hence, the recent advancement in multiplex IHC staining could solve this problem by immunostaining multiple markers on the same slide to evaluate multiple parameters, including cell lineage and histological localization of individual immune subpopulations. Further, this technology can maximize the information obtained in case of limited tissue availability. Ultimately, this technique can help elucidate the differences in immune cell interactions in the endometrium between fertile women and women with RM.
Two groups of women were recruited from the Prince of Wales Hospital, including fertile control women (FC) and women with unexplained recurrent miscarriage (RM). Fertile control was defined as women who had at least one live birth without any history of spontaneous miscarriage, and RM women were defined as those who had a history of ≥2 consecutive miscarriages before 20 weeks gestation. The subjects from the two groups met the following inclusion criteria: (a) age between 20 to 42 years old, (b) non-smoker, (c) regular menstrual cycle (25-35 days) and normal uterine structure, (d) no use of any hormonal regimen for at least 3 months before the endometrial biopsy, (e) no hydrosalpinx by hystero-salpingogram. In addition, all the subjects recruited had normal karyotyping, normal 3-dimensional ultrasonography hysterosalpingogram, day 2 follicle-stimulating hormone < 10 IU/L, mid-luteal progesterone > 30 nmol/L, normal thyroid function, and tested negative for lupus anticoagulant and anticardiolipin IgG and IgM antibodies.
To better understand the immunological basis of RM, it would be most desirable to simultaneously quantify and localize the major immune cell types present in the endometrium at the time of implantation. This paper describes the entire protocol from sample preparation, the multiplex optimization with markers for immune cell subtypes, and the scanning of the slides, followed by data analysis with specific reference to detecting endometrial immune cells. Moreover, this paper describes how to determine the density and clustering of the immune cell types simultaneously in the endometrium.
The study was approved by the Joint Chinese University of Hong Kong-New Territories East Cluster Clinical Research Ethics Committee. Informed consent was obtained from the participants before collecting the endometrial biopsies. Refer to the introduction section for inclusion criteria of the control and RM groups.
1. Sample preparation
2. Determine the ideal concentration of antibodies for multiplex IHC using conventional IHC.
NOTE: This is important for identifying the expression level and pattern of each immune marker in the endometrium sample, and determine the staining sequence of each marker as well as their associated tyramide signal amplification (TSA) fluorophore pairings.
3. Multiplex staining method
4. Image and analysis
The overall schematic process of performing a 4-color multiplex assay for the detection of 4 endometrial immune cell types is shown in Figure 1. In brief, the protocol for this multiplex immunofluorescence staining required 8 key steps: 1. Slide preparation, 2. Epitope retrieval, 3. Blocking, 4. Primary antibody application, 5. Secondary antibody application, 6. Signal amplification, 7. Removal of antibody, and 8. Counterstain and mount. Image rendering and analysis were then conducted using the Mantra Workstation with the spectral library generated using the inForm Image Analysis software for differentiating the 4 immune cell types in the endometrium sample (Figure 2).
Four endometrial immune cell types can be identified in human endometrium samples using this multiplex staining technique: CD3+ T cells, CD20+ B cells, CD68+ macrophages, and CD56+ uNK cells (Figure 3). However, fluorophore interference must be carefully considered to obtain a clear and useable image. Although this multispectral technology using the Mantra Workstation can support up to 8-plex assays, the application of the 4 fluorophores used in this protocol demonstrated optimal performance without fluorophore interference due to the differences in emission spectra of the fluorophores. In contrast, multiplex staining involving 5-8 fluorophores often requires more attention toward fluorophore interference resulting from emittance from the shared wavelengths.
To overcome this drawback, monoplex staining would be necessary to determine the order of each antibody in the multiplex and identify the expression level and pattern of each immune marker in the endometrium sample. This can help to determine the staining sequence of the markers and their associated TSA fluorophore pairings. Once the monoplex assay has been completed for determining the order of antibodies to be applied, the next step will be to select the fluorophore for detection after multiplex staining. A unique fluorophore must be chosen for every antibody of interest. The number related to each fluorophore would roughly be the fluorescent wavelength emitted during excitation (Table 1 and Table 2). One approach to prevent fluorophore interference is to choose fluorophore pairs with wavelengths as far from each other as possible (especially for co-localizing antibodies). This can help reduce excess spectral overlap and provide a crisp image and more reliable phenotyping. Moreover, the meticulous evaluation by turning lasers on and off from the multiplex composite image in the inForm software can also help recognize the staining patterns to minimize fluorophore saturation (Figure 4).
For image analysis, the number of CD3+ T cells, CD20+ B cells, CD68+ macrophages, CD56+ uNK cells, and stromal cells in the endometrial stroma (CD3−/CD20−/CD68−/ CD56− and DAPI-stained) can be counted automatically using the inForm Tissue Finder Software 14.0 (Figure 5). Each immune cell type density was expressed as a percentage relative to the total number of stromal cells (Figure 5). Similarly, the quantification of the spatial distribution of the endometrial immune cells was based on the X and Y position of every single immune cell obtained from the InForm system (Figure 6). Using the R-language, the level of clustering of different pairs of immune cells based on the AUC can then be distinguished.
Figure 1: Staining workflow diagram. Abbreviations: BSA = bovine serum albumin; HRP = horseradish peroxidase. Please click here to view a larger version of this figure.
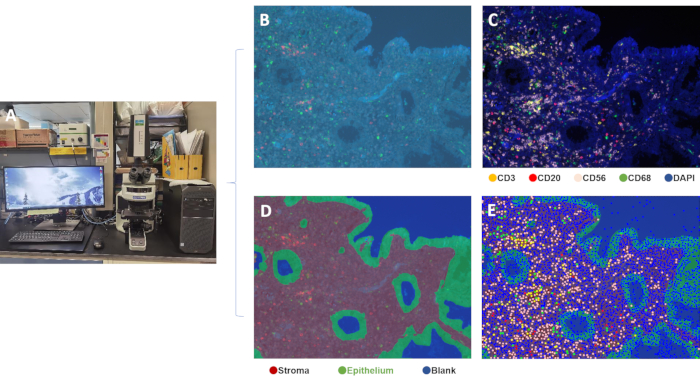
Figure 2: Workstation for image capture and analysis. (A) Mantra Imaging Workstation, (B) unprocessed Spectral image, (C) composite image, (D) tissue segmentation (epithelial and stromal compartments), (E) composite image of endometrium tissue showing four colored markers to identify different cell populations. Please click here to view a larger version of this figure.
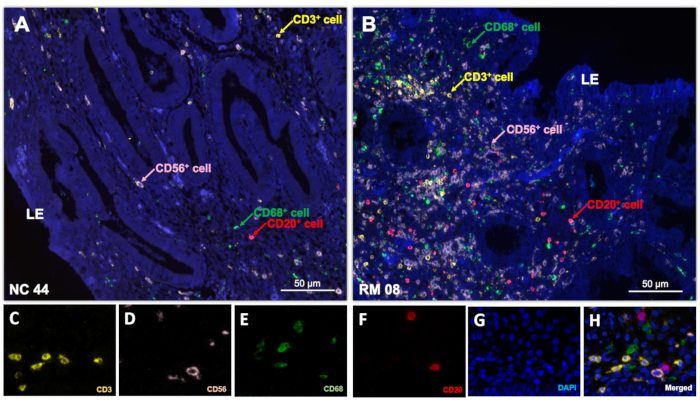
Figure 3: Spectral imaging. Multiplex immunostaining of 4 different immune cell types was performed on the endometrial biopsies from (A) a fertile control woman and (B) a woman with unexplained RM presented as single multispectral imaging. Following the production of a single-stained library, spectral unmixing could reveal imaging of single fluorophores representing (C) CD3, (D) CD56, (E) CD68, (F) CD20, (G) DAPI. A composite image was then created by incorporating all the fluorophores after multispectral imaging (H). Scale bars = 50 µm (A, B). Abbreviations: LE = luminal epithelium; DAPI = 4′,6-diamidino-2-phenylindole; RM = recurrent miscarriage. Please click here to view a larger version of this figure.
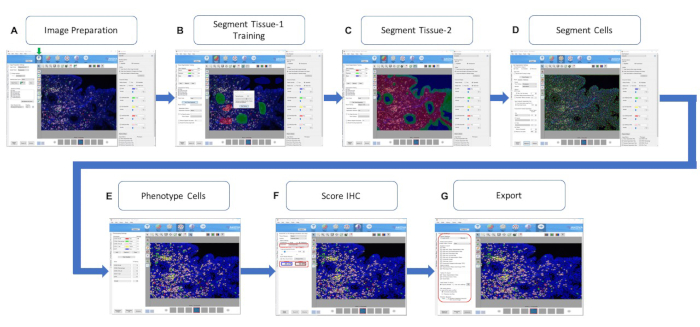
Figure 4: InForm Counts Tool. The inForm software counts tool is activated by selecting the beige box icon (indicated by ↓). (A) Image preparation, (B, C) segmenting tissue for hand-drawn training and automation, (D) segmenting individual cells, (E) phenotyping the cells based on the fluorophore intensity, (F) analysis for fluorophore intensity (the red box showing the number of positive cells in the selected fluorophore intensity), and (G) exporting the results for use (the red box indicates the export options). Abbreviation: IHC = immunohistochemical. Please click here to view a larger version of this figure.
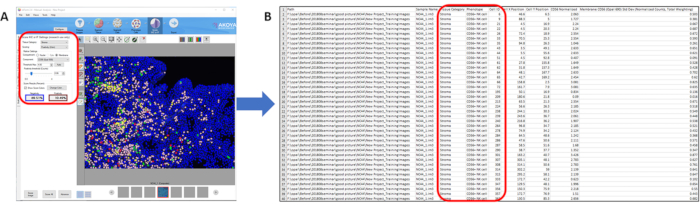
Figure 5: Cell Counting. (A) Phenotyping of the cells for automatic cell counting and (B) output of the positive-stained cells in the segmented region (e.g., stromal) for further comparison and statistical analysis. Please click here to view a larger version of this figure.
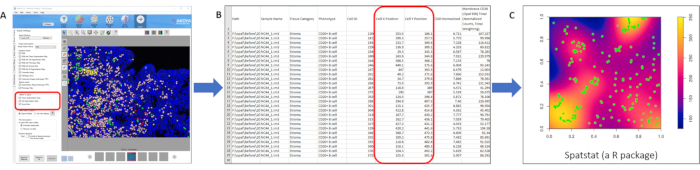
Figure 6: Measurement of spatial density. (A) Automatic detection of the position of positively stained immune cells in the segmented region (e.g., stromal), (B) output display of the coordinate of each positively stained CD20+ immune cell, and (C) determining the spatial density and localization between CD20+ cells and other immune cells in the segmented tissue regions using Spatstat. Please click here to view a larger version of this figure.
Order | Antibody | Clone | Clonality | Antibody Dilution Factor | Opals | Opal Dilution Factor |
1 | CD3 | SP7 | Monoclonal | 1 in 100 | Opal 620 | 0.111111111 |
2 | CD20 | L26 | Monoclonal | 1 in 100 | Opal 650 | 0.215277778 |
3 | CD68 | SP251 | Monoclonal | 1 in 100 | Opal 520 | 0.111111111 |
4 | CD56 | CD564 | Monoclonal | 1 in 100 | Opal 690 | 0.111111111 |
Table 1: List of antibodies, clones, and concentrations used.
Dye | Excitation maximum (nm) | Emission maximum (nm) | Expected Detection in Filter Set (name) | Expected Color |
DAPI | 350 | 470 | DAPI | Blue |
Opal 520 | 494 | 525 | FITC | Green |
Opal 620 | 588 | 616 | Cy3 and Texas Red | Amber |
Opal 650 | 627 | 650 | Texas Red and Cy5 | Orange |
Opal 690 | 676 | 694 | Texas Red and Cy5 | Clear |
Table 2: List of fluorophores with their maximum excitation and emission wavelengths, expected detection in appropriate filter sets, and observable colors.
Critical steps within the protocol
It is important to note that multiplex staining requires diligent optimization. Antigen retrieval, using citrate buffer and microwave technology, requires optimization to ensure complete antibody stripping and maintain tissue viability. As TSA reagents covalently bind to sites surrounding the antigen, they can potentially inhibit the binding of a subsequent primary antibody through steric hindrance (also known as the "umbrella effect"). This tends to occur when multiple immune markers reside in a single cell compartment and cause fluorophore interference. To identify whether there will be an effect, it would be critical to perform monoplex IHC/IF beforehand to identify any overlap in the localization of the immune cells. As single-sample staining would be required for generating the spectral library, validated spectra libraries can facilitate the discrimination of individual signals to further prevent fluorophore interference. If necessary, primary antibody concentrations and incubation times, fluorophore-antibody pairing, TSA fluorophore concentrations, and staining order may be modified to minimize fluorophore interference. Likewise, it is important to properly balance HRP concentrations in order to prevent TSA dimer formation. This can be achieved by the titration of primary and secondary antibodies. Moreover, it is of vital importance to remember that the concentrations and incubation times of primary antibodies used for multiplex staining may vary from those used in conventional chromogenic single-staining. Hence, the determination of the concentration and order of antibodies to apply for multiplex staining should be carried out beforehand.
Modifications and troubleshooting
In this study, we employed multiplex fluorescence immunohistochemical staining to simultaneously detect the interaction of four major immune cell types in endometrium biopsies from women with and without RM. This technique uses antibodies against CD3 for T cells, CD20 for B cells, CD68 for macrophages, and CD56 for uNK cells to distinguish between these cell types. Based on this method, we found that the median CD3+, CD68+, and CD56+ cell density values in the RM women were significantly higher than those of the fertile controls15. The clustering between CD56+ uNK cells and CD68+ macrophages was significantly higher in the RM group than in the fertile controls. In addition, the use of this method revealed that CD56+ uNK cells appeared to have both numerical and spatial correlation with CD68+ macrophages in both groups of women. In contrast, CD56+ uNK cells have a significant numerical but not spatial correlation with CD3+ T cells in women with RM15. This method also determines the spatial relationship of multiple immune cell types in the endometrium. However, the positivity for a specific marker can be borderline in some cases. To overcome this problem, it is advisable to include a positive control and a negative control to determine the threshold of positivity when constructing the spectral library. Additionally, the meticulous evaluation by turning lasers on and off from the multiplex composite image in the inForm software can also help recognize the staining patterns to minimize fluorophore saturation.
Limitations of the technique
Identification of fluorophore interference during data interpretation is essential to differentiate between genuine colocalization of markers and unmixing artifacts. This multiplex staining methodology utilizes TSA-based reagents driven by enzymatic amplification, which may boost the antigen marker intensity by 10-100 fold compared to conventional indirect IF methods. This generates a risk of overactive tyramide deposition, potentially resulting in an umbrella effect and/or signal bleed-through. To identify overstaining, signal levels can be visually assessed by unmixing images in inForm and hovering the cursor over bright, positive areas in a multiplex tissue image. Signal levels should usually remain below 30 and ideally within a factor 3 of each other, particularly for spectrally adjacent fluorophores. Over 5-fold differences in signals for spectrally adjacent fluorophores can lead to fluorophore interference and cause unmixing artifacts. If signal levels of any fluorophore show over 3 times the difference from the adjacent fluorophore, the TSA fluorophore concentrations need to be adjusted to achieve signal balance. Once the signal is confirmed to be in the correct range, the signal-to-background ratio should be maintained at <1:10 to ensure that the positive staining is not falsely detected from the nonspecific background.
As spectral crosstalk can also create significant fluorophore interference, the order of staining must be adjusted to separate spectrally adjacent dyes in both sequence and expression of markers. Although this multispectral technology using the Mantra Workstation supports up to 8-plex assays, the application of 4 fluorophores, namely Opal 520, 540, 620, and 690, demonstrates the best performance without fluorophore interference. The use of ≥5 fluorophores often requires more optimization and validation to avoid spectral crosstalk due to the spectral profiles of fluorophores that share proximate wavelengths. In other words, the number of targets that can be detected simultaneously by this approach is only limited by the number of wavelength bands and excitation/emission filter sets available. Hence, to rule out potential overstaining of a TSA fluorophore that blocks further application of other TSA fluorophores and/or to identify signal crosstalk, it is essential to be meticulous by turning layers on and off from the multiplex composite image in the inForm software; interpreting the staining patterns from the single IHC staining correctly; and looking for obvious loss, gain, or identical signals in one plane corresponding to localization in another plane.
Multispectral staining requires antibodies paired with specific fluorophores to simultaneously detect for multiple markers. This fluorophore-antibody pairing follows two rules: i) fluorophores assigned for co-expressed markers should be spectrally apart, and ii) more abundant targets should be paired with fluorophores with lower brightness or vice versa. The order of staining also needs to be arranged so that sequential antibodies do not co-localize in the same cell compartments in the stained cells. Therefore, other than the antibody concentrations and incubation times, which are critical factors in conventional staining methods, additional parameters, such as appropriate fluorophore-antibody pairing, TSA fluorophore concentrations, the staining sequence, and the exposure of a specific antibody to one or more microwave treatments, have to be considered for successful multiplex staining. Due to high variability in study samples, a given multiplex protocol may not generate the same result in other types of study samples.
The whole Opal multiplex sequential staining process can take from one to several days depending on the number of markers involved in the panel and the primary antibody incubation times. In contrast, standard IF methods typically allow the visualization of 4-5 markers in a single round of staining. It should be noted that the conditions optimized using the conventional IHC method need further optimization before proceeding to multiplex staining procedures, which involve additional, multiple microwave treatments, and the application of TSA fluorophores that will ultimately affect the staining intensity of each antibody. Currently, imaging approaches that utilize multispectral technologies may require expensive and dedicated instrumentation. In addition, it may only be limited to image-selected regions of interest. Hence, this may not be optimal for laboratories with limited resources and the scouting of tissues with uncertain antigen targets.
Significance with respect to existing methods
A particular strength of this current method is the capability to measure the density of multiple immune cell types in the endometrium simultaneously unlike conventional IHC methods that can only label one to two cell types in a single tissue section. Flow cytometry is another method which can analyze the relative proportions of different immune cell types in the endometrial specimen; however, it would not be able to provide spatial information between various immune cell types and the specific distribution within different endometrial compartments. Furthermore, tissue depletion is a serious concern in clinical practice, especially during clinical trials and when using biopsy samples. These two conventional methods would require a large number of specimens (either sections or cells) for optimizing the procedure and for detecting multiple immune cell types in the endometrium of women with and without RM.
As described in this protocol, the Opal workflow is designed for the detection of up to seven markers in the same tissue section by using the Mantra Workstation. In addition, species cross-reactivity during antibody selection is not a limitation of this technology. Indeed, an advantage of this technology is that it allows the use of antibodies raised in the same species for detecting up to seven markers. This approach involves detection with fluorescent TSA reagents followed by microwave treatment to remove any nonspecific staining. After microwave-based stripping, another round of staining can then be performed for additional target detection without the risk of antibody cross-reactivity. Additionally, this TSA detection method can be performed in a minimum of 3 days to combine up to 7 fluorochromes while still producing reliable results for detecting low-expression protein targets. Another advantage of multiplex staining over the traditional IHC study is its enhanced efficiency as the measurement is automated, which can eliminate subjective bias. The quantitative data generated represent the end results of the assay.
Future applications
The range of application of this multiplex protocol is immense. Importantly, this is the first paper to describe the method for the detection of multiplexed immunofluorescence marker expression using the Mantra Workstation and image analysis using the InForm 2.2.1 software for providing accurate and reproducible results in differentiating multiple immune cell populations in women with and without RM. Importantly, the localization of multiple targets in the same tissue section can provide unique insight into their cellular interactions. Ultimately, this will lead to better understanding of the immune cell microenvironment during embryo implantation in women with RM for establishing specific targeted treatment.
Moreover, our current methods helped to demonstrate that several immune cells and their interactions may be important for the function of the endometrium. This is shown by the significant changes in the density of three out of four endometrial immune cell types and a significant increase in the clustering between CD68+ and CD56+ cells. Conversely, the abnormal interactions of these immune cell types may be predisposing factors for RM. Importantly, unlike the detection of a single subtype of endometrial immune cells, the application of this multiplex IHC staining can provide an in-depth understanding of the immunologic regulation of embryo implantation. Additionally, the quantification and further understanding of spatial features in the immune microenvironment may help shed light on the biology of this disease in the context of immunotherapies.
The authors have nothing to disclose.
This study was supported by Hong Kong Obstetrical and Gynecological Trust Fund in 2018 and Hong Kong Health and Medical Research Fund (06170186, 07180226).
Amplification Diluent | Perkin Elmer | FP1498 | Fluorophore diluent buffer |
Antibody diluent | Perkin Elmer | ARD1001EA | Diluting the antibody |
CD3 | Spring Bioscience | M3072 | Primary antibody |
CD20 | Biocare Medical | CM004B | Primary antibody |
CD56 | Leica | NCL-CD56-504 | Primary antibody |
CD68 | Spring Bioscience | M5510 | Primary antibody |
Citrate Buffer Solution, pH 6.0 (10x) | Abcam | AB64214 | Antigen retrieval solution |
EMSURE Xylene (isomeric mixture) | Merck | 108297 | Dewaxing |
Ethanol absolute | Merck | 107017 | Ethyl alcohol for rehydration |
HistoCore BIOCUT Manual Rotary Leica Microtome | Leica | RM2125RTS | Sectioning of paraffin-embedded tissue |
inForm Advanced Image Analysis Software | Perkin Elmer | inForm® Tissue Finder Software 2.2.1 (version 14.0) | Data Analysis software |
Mantra® Workstation | Akoya Biosciences | CLS140089 | Spectral imaging |
Microwave | Panasonic | Inverter | Microwave stripping |
Opal 520 | Perkin Elmer | FP1487A | Appropriate tyramide based fluorescent reagent |
Opal 620 | Perkin Elmer | FP1495A | Appropriate tyramide based fluorescent reagent |
Opal 650 | Perkin Elmer | FP1496A | Appropriate tyramide based fluorescent reagent |
Opal 690 | Perkin Elmer | FP1497A | Appropriate tyramide based fluorescent reagent |
Oven | Memmert | U10 | Dewaxing |
Peroxidase Blocking Solution | DAKO | S2023 | Removal of tissue peroxidase activities |
Poly-L-lysine coated slide | FISHER SCIENTIFIC | 120-550-15 | Slide for routine histological use |
PolyHRP Broad Spectrum | Perkin Elmer | ARH1001EA | Secondary antibody |
ProLong™ Gold Antifade Mountant | ThemoFisher Scientific | P36930 | Mounting |
Spatstat | / | Version 2.1-0 | Spatial point pattern analysis |
Spectral DAPI | Perkin Elmer | FP1490A | Nucleic acid staining |
Tissue Processor | Thermo Fischer | Excelsior ES | Tissue processing for dehydration and paraffination |
Tris Buffer Saline (TBS), 10x | Cell Signaling Technology | 12498S | Washing solution |
Tween 20 | Sigma-Aldrich | P1370-1L | Nonionic detergent |