1. Construction of the Markov state model (MSM) from atomic MD simulations
- Spontaneous protein stepping pathway and initial structures collection
- Use a previously obtained 10-µs all-atom MD trajectory8 to extract 10000 frames evenly from a "forward" 1-bp stepping path (i.e., one frame for each nanosecond). The total number of frames needs to be sufficiently large to include all representative conformations.
- Prepare the transition path with 10000 frames in VMD by clicking File > Save coordinates, type protein or nucleic in selected atoms box and choose frames in Frames box, click Save to get the frames needed.
NOTE: A previously obtained 10 µs all-atom MD simulation trajectory (called "forward stepping trajectory" here) for WRKY stepping 1-bp distance on a 34-bp homogeneous poly-A DNA8 was used as the initial path to launch further conformational samplings. Note that in most of practices, however, an initial path is constructed, by performing steered or targeted MD simulations, or implementing general path-generation methods, etc.36,37,38,39. - Align the long axis of the reference DNA (from crystal structure) to the x-axis, and set the initial center of mass (COM) of the full 34-bp DNA at the origin of the coordinate space for the convenience of further data analysis. To do this, click Extensions > Tk Console in VMD, and type in the Tk console command window:
source rotate.tcl
The tcl script can be found in Supplementary File 3. - Then calculate the root-mean-square-distance (RMSD) of the protein backbone by aligning the central 10 bp DNA (A 14 to 23 and T 14' to 23') to that from the crystal structure40, and the RMSD represent geometrical measures of the systems (see Figure 1A). Do this by clicking VMD > Extensions > Analysis > RMSD trajectory tool and type nucleic and residue 14 to 23 and 46 to 55 in atom selection box, click Align and then RMSD box to calculate the RMSD values.
- Calculate the rotational degree of protein around DNA Θ(t) on the y-z plane in MATLAB by typing the command
rad2deg(atan(z/y))
with the initial angular positioning defined as Θ(0)=0, as conducted previously8. - Type the following command in MATLAB41 to use K-means methods42,43,44 and classify the 10000 structures into 25 clusters by typing:
[idx, C]=kmeans( X, 25)
here X is a 2D matrix of RMSD and rotational angle of WRKY on the DNA. Gather the structures of these 25 cluster centers for further MD simulations.
NOTE: Since the protein RMSD sampled relative to DNA covers a range of about 25 Å, we choose 25 clusters to have one cluster per angstrom.
- Conducting the 1st round of MD simulations and the simulation settings
- Build atomistic systems for the 25 structures by using GROMACS 5.1.2 software32 under parmbsc1 force field45 and by using the buildsystem.sh file from Supplementary File 2 in shell.
- Conduct 60-ns MD simulations for these 25 systems under NPT ensemble with a time step of 2 fs by typing the following command in shell:
gmx_mpi grompp -f md.mdp -c npt.gro -p topol.top -o md.tpr
gmx_mpi mdrun -deffnm md
- Clustering the 1st round MD trajectories
- Remove the first 10 ns of each simulation trajectory by typing in shell:
gmx_mpi trjcat -f md.xtc -b 10000 -e 600000 -o newtraj.xtc
and collect conformations from the 25 × 50 ns trajectories for clustering to prepare the input structures for the subsequent more extensive samplings (2nd round MD simulations).
NOTE: To reduce the impact from the initial path and to allow local equilibration, 10-ns of the initial period of simulations were removed. - Choose distance pairs between protein and DNA as input parameters for the time-independent component analysis (tICA)46,47,48 projection. Use the make_ndx command in GROMACS to do that:
gmx_mpi make_ndx -f input.pdb -o index.ndx
NOTE: Here, the protein CA atoms and the heavy atoms (NH1, NH2, OH, NZ, NE2, ND2) of residue Y119, K122, K125, R131, Y133, Q146, K144, R135, W116, R117, Y134, K118, Q121 that can form hydrogen bonds (HBs) with the DNA nucleotide were selected, which pair with the O1P O2P and N6 atoms of the DNA nucleotide (A14-20, T19-23). The selected amino acids can either form stable HBs or salt bridges with DNA. - Copy the above selected atom index from index.ndx file to a new text file (index.dat). Get the pair information between these atoms by the python script from Supplementary File 1 generate_atom_indices.py and type:
python2.6 generate_atom_indices.py index.dat > AtomIndices.txt
This generates the 415 distance pairs between protein and DNA. - Calculate the 415 distance pairs from every trajectory by typing the following command in MSMbuilder command window:
msmb AtomPairsFeaturizer -out pair_features –pair_indices AtomIndices.txt –top references.pdb –trjs "trajectories/*.xtc" –transformed pair_features –stride 5 - Conduct tICA to reduce the dimension of data onto the first 2 time-independent components (tICs) or vectors by typing:
msmb tICA -i ../tica_rc_a/tmp/ -o tica_results –n_components 2 –lag_time 10 –gamma 0.05 -t tica_results.h5
NOTE: tICA is a dimension-reduction method that calculates the eigenvalue of time-lagged correlation matrix to determine the slowest relaxing degrees of freedom of the simulation system by the equation:
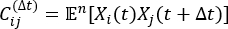
where Xi(t) is the value of the i-th reaction coordinate at time t, and Xj(t+Δt) is the value of the j-th reaction coordinate at time t+Δt. is the expectation value of the product of the Xi(t) and Xj(t + Δt) overall simulation trajectories. The directions along the slowest relaxing degrees of freedom correspond to the largest eigenvalues of the above time-lagged correlation matrix . Here, 2 tICs seem to be a minimal set to differentiate three macrostates upon our MSM construction (addressed later). One can also calculate the generalized matrix Rayleigh quotient (GMRQ) score49, for example, to explore an optimal set of components to be used.
 - Use command in MSMbuilder to cluster the projected datasets into 100 clusters by K-center43,44 method (see Figure 1B):
msmb KCenters -i ./tica_results.h5 -o kcenters_output -t kcenters_output –n_clusters 100.
Select the center structure of each cluster as the initial structure for the 2nd round of MD simulations. Maintain the simulation information of the simulated 100 structures, including positions, temperatures, pressures, etc., except for the velocities.
NOTE: After the first round of 25 simulations, the memory of the initial path has been reduced, so we generate more clusters, e.g., 100 clusters, in the second round, to substantially expand the conformational samplings.
- Remove the first 10 ns of each simulation trajectory by typing in shell:
- Conducting the 2nd round extensive MD simulations
- Conduct 60-ns MD simulations starting from these 100 initial structures after imposing random initial velocities on all the atoms. Add the random initial velocities by turning on the velocity generation in mdp file, i.e., changing the md.mdp file gen_vel = no to gen_vel = yes.
- Remove the first 10 ns of each simulation as described in step 1.3.1, collect 2,500,000 snapshots from the 100 × 50 ns trajectories evenly to construct the MSM.
NOTE: Note that in the later macrostates construction, a small number of off-path states with a particularly low population (~0.2%, on the bottom of X-Θ plane) were found. These off-path states are classified as one macrostate when the total number of macrostates is set as 3 to 6 (Figure 2B). Since such a low population macrostate includes only 3 trajectories, which were removed in the end, the results shown in this protocol were obtained indeed from 97 × 50 ns trajectories, with a total of 2,425,000 frames or snapshots.
- Clustering the 2nd round MD trajectories
- Conduct tICA for the 2nd round trajectories as done previously. Type in MSMbuilder:
msmb tICA -i ../tica_rc_a/tmp/ -o tica_results –n_components 2 –lag_time 10 –gamma 0.05 -t tica_results.h5 - Calculate the implied timescale to validate parameters for the correlation delay time Δt and microstates numbers (see Figure 1C),
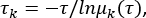
where τ represents the lag-time used for building the transition probability matrix (TPM); μk(τ) represents the kth eigenvalue of the TPM under a lag time of τ. Use the python script from Supplementary File 1 for this python BuildMSMsAsVaryLagTime.py -d ../ -f ../trajlist_num -i 50 -m 1000 -t 10 -n 20 -s 500. - Vary the lag-time τ and microstates number by changing the parameters used above:
python BuildMSMsAsVaryLagTime.py -d ../ -f ../trajlist_num -i 50 -m 1000 -t 5 10 20 30 40 -n 20 -s 20 200 400 500 800 2000
NOTE: The system is regarded as Markovian when the implied timescale curves start to level off with time-scale separation. Then, choose the Dt as the correlation delay time, and the τ the lag time where the implied timescale starts to level off to build MSM. - Accordingly, choose a comparatively large (but not too large) number of states, N = 500, and a comparatively short correlation delay time Δt =10 ns. The lag time was found to be τ =10 ns to build MSM.
- Classify the conformations into 500 clusters (see Figure 1D) by using the command:
msmb KCenters -i ./tica_results.h5 -o kcenters_output -t kcenters_output –n_clusters 500
- Conduct tICA for the 2nd round trajectories as done previously. Type in MSMbuilder:
- MSM construction
- Lump the 500 microstates into 3–6 macrostates to find out the number of macrostates which suit best according to the PCCA+ algorithm50 in MSMbuilder, by using the python script in Supplementary File 1 python msm_lumping_usingPCCAplus.py. Identify a reduced kinetic network of models for the most essential conformational changes of biomolecules, by constructing a small number of macrostates, i.e., upon kinetically lumping hundreds of microstates as described below17,51.
- Map the high-dimensional conformations to the X (protein movement along the DNA long axis) and rotational angle of the protein along the DNA for each macrostate as described in step 1.1.3 and 1.1.4 (e.g., no state with too low population < 1%; see Figure 2C). Then find the 3 macrostates that best represent the system (Figure 1E) . See Figure 2D for snapshots of the movement of protein along DNA and the protein rotation angle around DNA.
NOTE: In previous work generating the 10 μs spontaneous protein forward stepping path, we additionally conducted 5 x 4 μs equilibrium MD simulations to moderately expand the samplings. We showed the mapping of the original forward path (see Figure 2A left) and further 4-μs sampling trajectories on the forward path conducted previously (see Figure 2A right)8. The mapping of the original 100 × 50 ns (see Figure 2B left)8 and the 97 × 50 ns trajectories used in this work are shown (see Figure 2B right).
- Calculation of the mean first passage times (MFPT)
- Conduct five 10-ms Monte Carlo (MC) trajectories based on the TPM of the 500 microstate MSM with the lag time of 10 ns set as the time step of MC. Calculate MFPT52 between each pair of macrostates (Figure 3) by the python script in Supplementary File 1 python python mfpt_msm3.py.
- Calculate the average and standard error of the MFPT using the bash file in Supplementary File 2, type:
sh mfpt_analysis.bash
2. Conducting coarse-grained (CG) simulation to sample long-time dynamics
- Conduct a CG simulations by using the CafeMol 3.0 software30. See the CG simulation settings specified in the input configuration file with an extension .inp, including input structures, simulation parameters, output files, etc. Type the following command on the terminal to run the CG simulation:
cafemol XXX.inp - Specify the following blocks in the input file, with each block starting with the label <<<< and ending with >>>>.
- Set filenames block (required) to specify the working directories and input/output file store path. Type following for the filenames block for these simulations:
<<<< filenames
path = XXXXX (working path)
filename = wrky (the output file names)
OUTPUT psf pdb movie dcd rst
path_pdb = XXXXX (input native structure path)
path_ini = XXXXX (input initial structure path)
path_natinfo = XXXXX (native information file path)
path_para = XXXXX (parameter files path)
>>>>
NOTE: As the Go-model53 is utilized in the CG modeling, i.e., protein will be biased to the native conformation, so one needs to set the modeled structure as the native conformation. Here, the input crystal structure was set as the native conformation. - Set the job control block (required) to define the running mode of the simulations. Type the following command:
<<<< job_cntl
i_run_mode = 2 (= 2 the constant temperature simulation)
i_simulate_type = 1 (=1 Langevin dynamics)
i_initial_state = 2 (=2 means the initial configuration is Native configuration)
>>>>
Select the constant temperature Langevin dynamics simulations. - Set the unit and state block (required) to define the information for input structures. Type the following command:
<<<< unit_and_state
i_seq_read_style = 1 (=1 means read sequences from PDB file)
i_go_native_read_style = 1 (=1 means the native structure is from PDB file)
1 protein protein.pdb (unit&state molecular_type native_structure)
2-3 dna DNA.pdb (unit&state molecular_type native_structure)
>>>>
NOTE: The initial input structure files (protein.pdb and DNA.pdb here) are needed. The structures are written in the pdb format. Two pdb files are needed here: one is the protein structure file containing the heavy atom coordinates of WRKY (unit 1), and the other is the coordinates of 200-bp double-stranded (ds) DNA (unit 2-3). The protein is initially placed 15 Å away from the DNA. - Set the energy function block (required) defined in the energy_function block. Type the following command:
<<<< energy_function
LOCAL(1) L_GO
LOCAL(2-3) L_DNA2
NLOCAL(1/1) GO EXV ELE
NLOCAL(2-3/2-3) ELE DNA
NLOCAL(1/2-3) EXV ELE
i_use_atom_protein = 0
i_use_atom_dna = 0
i_para_from_ninfo = 1
i_triple_angle_term = 2
>>>>
NOTE: In the CG simulations, the protein is coarse-grained by the Go-model53 with each amino acid represented by a CG particle placed at its Cα position. The protein conformation will be biased then towards the native structure, or crystal structure here, under the Go potential (Figure 4A left). The DNA is described by the 3SPN.2 model54, in which each nucleotide is represented by 3 CG particle S, P, N, which correspond to sugar, phosphate, and nitrogenous base, respectively (Figure 4A right). The electrostatic and vdW interactions are considered between different chains. The electrostatic interactions between protein and DNA in the CG simulation are approximated by the Debye-Hückel potential55. The vdW repulsive energy takes the same form as in the Go model. - Set the md_information block (required) to define the simulation information. Type the following command:
<<<< md_information
n_step_sim = 1
n_tstep(1) = 500000000
tstep_size = 0.1
n_step_save = 1000
n_step_neighbor = 100
i_com_zeroing = 0
i_no_trans_rot = 0
tempk = 300.0
n_seed = -1
>>>>
The n_tstep is the simulation step. Set the tstep_size as the time length of each MD step, each CG Cafemol time step is about 200 fs30, so each MD step here is 200 × 0.1 fs in principle. Update the neighbor list every 100 MD steps (n_step_neighbor = 100). Set the simulation temperature to 300 K. Control the temperature by employing the velocity-type Verlet algorithm for updating protein structure with the Berendsen thermostat56.
NOTE: The n_step_sim is the basin number of the Go model based potential, or the local minimal number of the energy curve. A multiple-basin potential allows the protein conformation biased to different conformations so that protein conformation can change from one local minimum to another. Here only the single basin Go model is used, which means only one biased conformation (crystal structure) for protein in the simulations. Meanwhile, since there is no protein-DNA hydrogen bonding interaction, etc. modeled in the CG context, the molecular motions can be sampled even faster, i.e., > 10 times than in the atomic simulations. - Set electrostatic block (required only when electrostatic interaction is used) as the electrostatic interaction is considered among different chains, so use this block to the define the parameters for electrostatic interaction by typing:
<<<< electrostatic
cutoff_ele = 10.0
ionic_strength = 0.15
>>>>
Set the Debye length in the electrostatic interaction to 10 Å, corresponding to the solution condition. Set the ionic strength to 0.15 M, as at the physiological condition.
- Set filenames block (required) to specify the working directories and input/output file store path. Type following for the filenames block for these simulations:
Rotation-coupled sliding or 1 bp stepping of WRKY from the MSM construction
All protein conformations on the DNA are mapped to the longitudinal movement X and rotation angle of the protein COM along DNA (see Figure 3A). The linear coupling of these two degrees indicates rotation-coupled stepping of the WRKY domain protein on the DNA. The conformations can be further clustered into 3 macrostates (S1, S2, and S3) in the MSM. The forward stepping of WRKY then follows the macrostate transition S1->S2->S3. S1 refers to a metastable state initiated by the modeled structure (based on the crystal structure of WRKY-DNA complex40), with a population of ~ 6%. Note that in current modeling, the initial protein conformation was adopted from the crystal structure in which the protein binds with specific W-box DNA sequence40. Such a modeled protein-poly A-DNA complex thus leads to less favorable initial structures (S1) than the stepped or finally relaxed structures (S3). Nevertheless, one can find that the hydrogen bonds (HBs) at the protein-DNA interface recover near the center of S3 as that near the center in S1 (see Figure 3B). The HBs in the S1 state are well maintained: K125 with A15, R131, Q146 and Y133 with A16, K144 and Y119 with A17, R135 with A18 (Figure 3B top left). S3 refers to a metastable state after the 1-bp protein stepping, with almost all the HBs shifted for 1-bp distance (Figure 3B bottom), and the structures appear stable with the highest population (63%). The intermediate state S2 connects S1 and S3, with a medium-high population (~30%). We found that the R135 and K144 are quite flexible in this intermediate state and can usually break HBs with the current nucleotide and reform that with the next nucleotide (Figure 3B top right). Overall, the WRKY protein COM moved ~2.9 Å and rotated ~55° to stepping 1 bp here. The rate-limiting step for the WRKY stepping is S2->S3, which essentially allows collective breaking and reforming of the HBs and requires ~7 µs on average. In contrast, S1 to S2 can transit very fast at a time of ~0.06 µs or 60-ns (Figure 3B), involving mainly the protein COM fluctuations (e.g., due to protein orientational changes on the DNA).
Single-strand bias of WRKY during processive diffusion in the CG model
In our recent study, we found that the WRKY domain protein binds preferentially to one strand of the dsDNA, no matter during 1-bp stepping or static binding; and the single-strand bias becomes highly prominant particularly upon specific DNA sequence binding8. Meanwhile, it is not clear whether such a trend remains during the processive diffusion of the protein along DNA. Here we tried to examine the potential strand bias via the CG simulations. Interestingly, a significant single-strand DNA binding configuration has been identified in the CG simulations of the WRKY during processive diffusion. To see that, the contact numbers between protein and DNA were calculated on the respective DNA strands (see Figure 4B). A contact is considered when the distance between protein CG particle and DNA CG P (phosphate group) particle is smaller than 7 Å. The protein indeed shows bias to one of the DNA strands (e.g., ~4 contacts to one strand and ~1 contact to the other), i.e., even when detailed interactions such as HBs at the protein-DNA interface are not modeled.
The preferred DNA strand, however, can switch from time to time between the two strands of the DNA, depending on the binding orientation or configuration of the protein on the DNA. In particular, according to the contact number formed between the protein and respective strands of DNA, there are mainly 4 states here (as labeled 1, 2, 3, and 4 in Figure 4B,C). In state 1 and 3, a zinc-finger region binds toward -Y direction, and the preferred strand is the blue one. In state 2 and 3, the zinc-finger region binds toward +Y direction, and the preferred strand becomes the red one. It is also found that the zinc-figner region interacts dominantly with the DNA (see Figure 4D). Hence, the DNA strand bound closely with the zinc-finger region is indeed the preferred one. According to the above sampling, it thus appears that the strand bias persists but switches between the two DNA strands in the CG model of the processive protein diffusion.
Protein individual residual stepping in the CG simulations
It was previously noticed from our CG simulations that the stepping size of WRKY may vary on different DNA sequences8. The protein COM tends to step 1 bp on the homogeneous poly-A DNA. While on poly-AT DNA with 2 bp periodicity, the proportion of 2-bp stepping seems to increase.
Additionally, here we examined whether individual protein residues move synchronously at the protein-DNA interface. We calculated the stepping size of each highly conserved residue in the WRKY motif (WRKYGQK) for every 1000 timesteps (Figure 5A). The residual stepping size of each conserved residue can thus be measured from the CG simulations. The results indeed show that the stepping sizes of these individual residues are more synchronized on poly-A DNA than on poly-AT or random DNA sequences (Figure 5B).
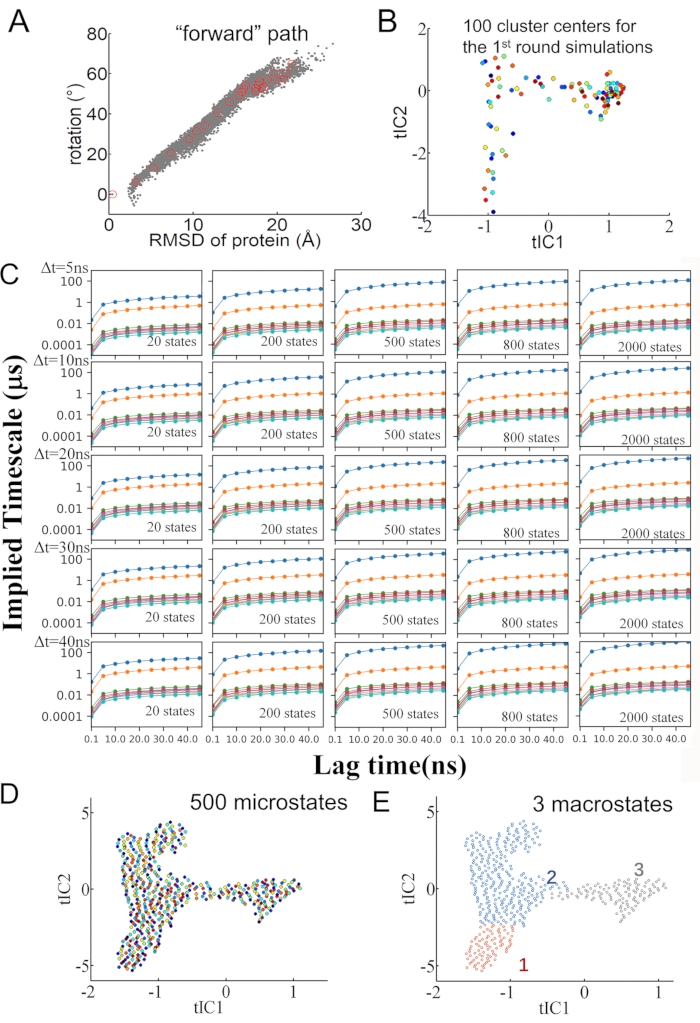
Figure 1: The conformations generation and microstates/macrostates construction. (A) The initial forward stepping path mapped on the protein-DNA RMSD and protein rotational angle around the DNA. The initial chosen 25 structures are labeled by red circles. (B) The 100 conformation cluster centers from the 1st round 25 x 50 ns MD simulation trajectories mapped on the two highest eigenvalue tICs direction. (C) Plots of the implied timescale as a function of lag-time for the MSM construction via tICA using chosen distance pairs as input. For each set, MSM was constructed by projecting the conformations onto the top 2 tICs followed by K-centers clustering to produce 20 to 2000 microstates (from left to right column) with correlation delay time for tICA chosen from 5 to 40 ns (from top to bottom row). (D) The 500 microstates constructed and (E) the further constructed 3 macrostates, with corresponding microstate centers mapped along the highest two tICs direction. Please click here to view a larger version of this figure.
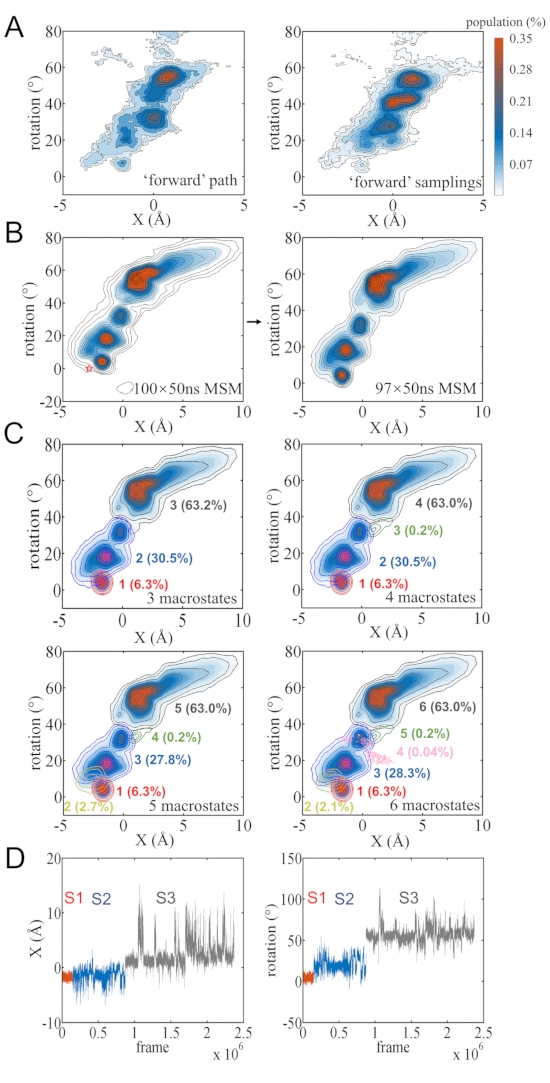
Figure 2: Construction of the macrostates. (A) The mapping of initial forward stepping path trajectory (left) and with a small number of additional micro-second trajectory samplings (right) on the protein center of mass (COM) movement along DNA long axis (X) and rotational angle around the DNA (obtained previously8). (B) The mapping of the original 100 × 50 ns trajectories and the 97 × 50 ns trajectories used in current MSM construction. (C) The construction of 3-6 macrostates and their populations from the constructed MSM are labeled on the extensive sampling maps. (D) The protein movement X and rotation angle around DNA are shown, respectively. The sampled conformations are finally lumped into 3 macrostates, with red, blue, and gray corresponding to the macrostate 1, 2, and 3, respectively. Please click here to view a larger version of this figure.
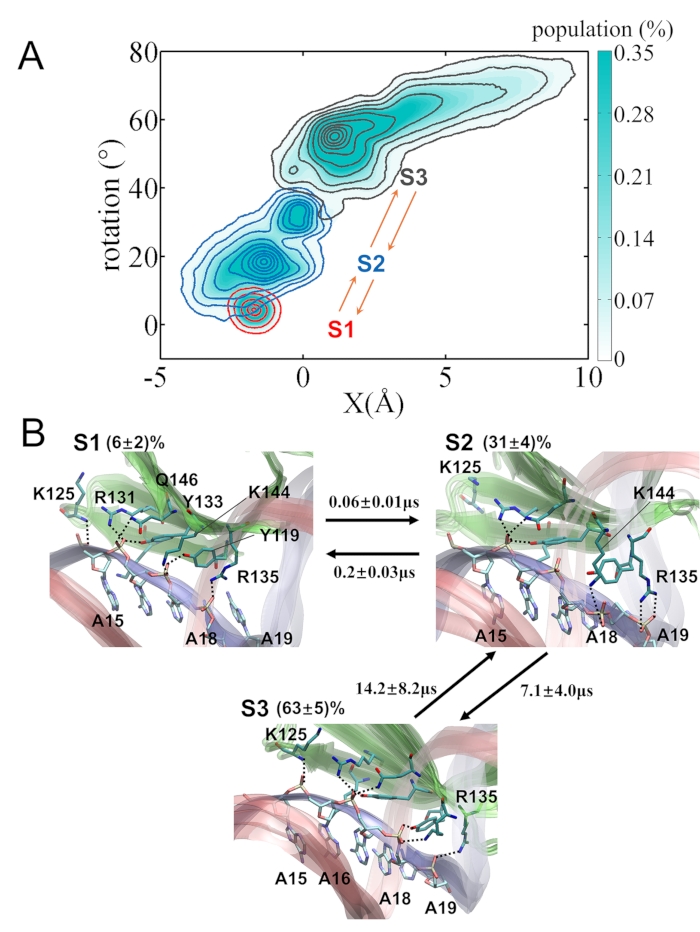
Figure 3: The MSM of the WRKY domain protein stepping on poly-A DNA. (A) The projection of the MD conformational snapshots onto coordinates of the protein COM movement X and rotational angle with respect to the DNA. The 3 macrostates S1, S2, and S3 are colored in red, blue, and gray, respectively. (B) Representative conformations and transition mean-first-passage-time (MFPT) of the constructed 3 macrostates. The key hydrogen bonds between protein and DNA are shown. Please click here to view a larger version of this figure.
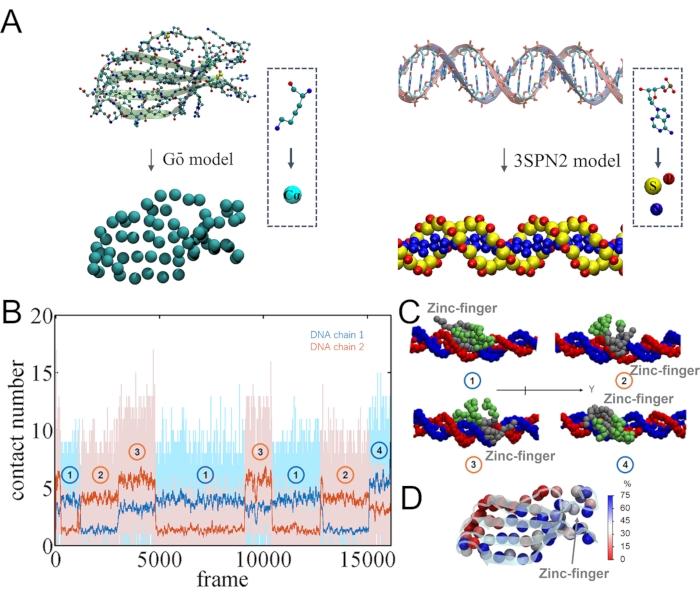
Figure 4: The coarse-grain (CG) model and contacts formed between protein and DNA strands in the CG model. (A) The coarse-graining of protein (left) and DNA (right). (B) The contact number between WRKY and each DNA strand along the simulation. (C) The molecular views of the 4 contact modes. The protein region near the zinc-finger is colored in gray, and the other region is colored in green. (D) The contact probability of each protein amino acid with DNA. When the distance between the CG particle of the amino acid and any DNA CG particles is smaller than 7 Å, the amino acid is considered to be in contact with DNA. Please click here to view a larger version of this figure.
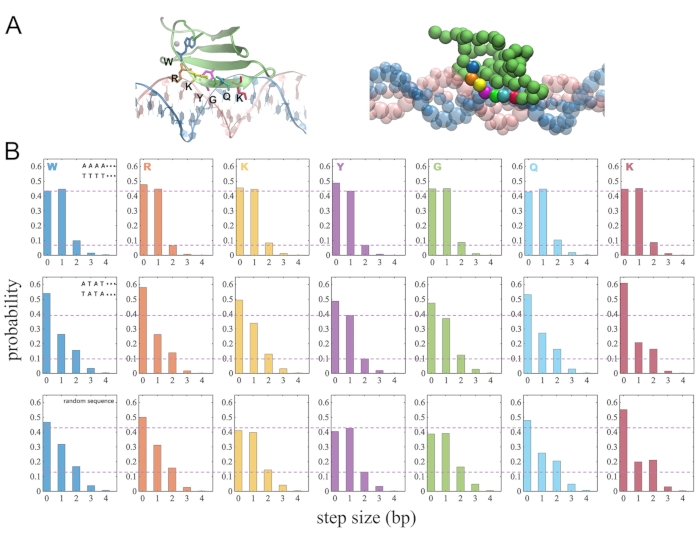
Figure 5: The diffusion step sizes of individual protein amino acid in the WRKY motif as WRKY moving along DNA. (A) The highly conserved residues (WRKYGQK) in atomic structure (left) and after coarse-graining (right). (B) The stepping size for each conserved residue on different sequences of DNA (poly-A; poly-AT; random sequences) Please click here to view a larger version of this figure.
Supplementary File 1: The python codes and software used in this protocol. MSM is built mainly by using the MSMbuilder, the necessary python codes are attached. Please click here to download this File.
Supplementary File 2: The atomistic molecular dynamics simulations are conducted by GROMACS, the commands and necessary files to build all-atom simulations are also attached. The coarse-grained simulations are conducted by CafeMol software. The simulation results are analyzed by VMD and MATLAB. Please click here to download this File.
Supplementary File 3: The tcl script to rotate and move protein in VMD. Please click here to download this File.
