1. Creation of silicone masters
NOTE: Most of the process of the design, creation, and troubleshooting of silicon masters for the repeated molding of PDMS stamps has been covered previously21, so only key differences in this new approach will be described here.
- Create the design for the photomask using AutoCAD or similar design software. Coat one side of the photomask, a thin piece of glass, with a thin layer of chrome to control UV light scattering. Design the photomask so that shining UV light through it onto the chosen photoresist will create a silicone master with the inverse of the features desired on the final PDMS stamps. See Figure 1 for the design of this mask.
NOTE: Whether the desired features or the area outside them should be made transparent on the photomask depends on the chosen photoresist. The photoresist used here is SU-8 2005 (CAUTION: flammable, skin and eye irritant; keep away from heat/flames/sparks and use protective gloves and eyewear when handling), a negative photoresist which is capable of making 5 µm tall features with near-vertical sidewalls.- Cure the negative photoresist by exposing it to UV light and removing the uncured SU-8 with a chemical solvent. Therefore, design the primary features of the mask to be transparent while the surrounding area of the mask is opaque.
- For this new removal method, design the photomask so that it is composed of two squares of 1.5 x 1.5 cm (Figure 1A), one full of an even grid of 2 µm circles spaced 6 µm center to center, and another made up of many square islands which are smaller, isolated versions of that same grid pattern (Figure 1B). Make islands of the following sizes: 6 x 6 dots, 12 x 12 dots, 25 x 25 dots, and 42 x 42 dots.
NOTE: The diameter of the adhesion points (2 µm) was chosen based on previous studies that measured cellular traction forces22,23. The mask used here is 101.6 x 101.6 mm and is coated on one side with a 0.06 µm thick layer of chrome, which is recommended because of the small features of the master. The photomask used here was commissioned from an external photomask printing company.
- Within a cleanroom, coat the chosen silicon wafer evenly with photoresist. As an optional step, surface-treat the wafer in a plasma asher before coating it with resist.
NOTE: Here, 100 mm diameter wafers are used. Treatment in a plasma asher makes the wafer more amenable to binding to SU-8 and helps prevent delamination of SU-8 from the wafer. - Perform the following steps according to the photoresist manufacturer's instructions:
- Spin the coated wafer to create the desired feature thickness, varying the spin time based on the desired thickness and the type of resist. For a 5 µm thick SU-8 2005, divide the recommended spin program into the following three steps:
- Coat the wafer with photoresist by spinning at 500 RPM for 10 s with a ramp of 100 RPM/s.
- Reduce the resist thickness to roughly 5 µm by spinning the wafer at 3,000 RPM with a ramp of 300 RPM/s for 30 s.
- Slowly decelerate the wafer after spinning by reducing the speed to 0 RMP with a ramp of 500 RPM/s for 1 s.
- Prepare the resist for UV exposure by baking it briefly on a 95 °C hot plate. Modify the time spent on the hotplate according to the desired thickness of the resist; baking time is 2 min for a 5 µm-thick SU-8 2005.
- Expose the resist to UV light to fully cure the desired features. Be wary of overexposure, as this can make SU-8 brittle and affect the overall quality of the resulting master.
- Use exposure energy of 105 mJ/cm2 for a 5 µm-thick SU-8 2005. Based on the power of the available UV lamp, calculate the exposure time by dividing the exposure energy by the power of the lamp in mW.
NOTE: As the lamp used here has a power of 8 mW, the exposure time should be 13.1 s.
- Use exposure energy of 105 mJ/cm2 for a 5 µm-thick SU-8 2005. Based on the power of the available UV lamp, calculate the exposure time by dividing the exposure energy by the power of the lamp in mW.
- To set the SU-8 features following development, bake again on a 95 °C hot plate, this time for 3 min. Wait for the desired features of the master to appear within 1 min during this baking step if the resist was exposed properly.
- Remove uncured SU-8 from the silicon wafer using SU-8 developer. Be thorough when removing the uncured SU-8, as it can get stuck between the micron-sized and spaced features on the wafer.
CAUTION: SU-8 developer is a flammable skin and eye irritant; keep it away from heat/flames/sparks and use protective gloves and eyewear when handling it. - After development, rinse with acetone to remove excess developer on the wafer and dry it completely with a nitrogen spray gun.
CAUTION: Acetone is a flammable skin and eye irritant; keep it away from flames/sparks and use protective gloves and eyewear when handling it. - Optionally, for SU-8 2005, bake on a 200 °C hot plate for 10 min.
NOTE: This hard bake adds mechanical strength to the photoresist.
- Spin the coated wafer to create the desired feature thickness, varying the spin time based on the desired thickness and the type of resist. For a 5 µm thick SU-8 2005, divide the recommended spin program into the following three steps:
- After being allowed to cool, put the wafer into a wafer carrier tray and then cast it in PDMS. First, complete a silanization treatment on the wafer to make the SU-8 features of the silicon master less likely to bind to PDMS and thus less likely to be removed from the surface of the wafer.
- To complete the silanization surface treatment, place the master and a small glass coverslip inside a desiccator designated for use with silanes only. Place 1-2 small drops of Trichloro(1H,1H,2H,2H-perfluorooctyl)silane onto the coverslip, close the desiccator, and run it under vacuum for 30 min at a pressure of 4,500 Pa24.
CAUTION: Trichloro(1H,1H,2H,2H-perfluorooctyl)silane is a flammable skin and eye irritant; keep it away from heat/flames/sparks, use protective gloves and eyewear when handling, and work under a fume hood. - Turn off the vacuum and leave the master and coverslip in the desiccator for another 30 min.
NOTE: The master is now ready for casting in PDMS.
- To complete the silanization surface treatment, place the master and a small glass coverslip inside a desiccator designated for use with silanes only. Place 1-2 small drops of Trichloro(1H,1H,2H,2H-perfluorooctyl)silane onto the coverslip, close the desiccator, and run it under vacuum for 30 min at a pressure of 4,500 Pa24.
2. Subtractive microcontact printing
- Mix PDMS in the correct ratio of curing agent to base based on the manufacturer's instructions. Let it sit at room temperature and pressure for 15 min; then, degas under vacuum for 15 min.
- Pour the PDMS into the master and put it into an incubator set to 37 °C overnight to cure.
- Remove the master from the incubator and allow it to cool to room temperature.
- While the master is cooling down, sonicate 25 mm coverslips in ethanol for 10 min. Use as many coverslips as the number of stamps being prepared.
- Thoroughly rinse 25 mm coverslips with deionized (DI) water and dry using a filtered air gun.
- Plasma treat the coverslips for 1 min using a plasma cleaner under vacuum on high (radio frequency power of 30 W). Be sure to release the vacuum slowly after treatment to prevent the coverslips from moving inside the chamber.
NOTE: Plasma treatment of the glass surface serves two purposes: it cleans the surface of the glass to remove contaminants and generates oxygen-based polar groups on the surface of the glass to make it hydrophobic25. This hydrophobicity makes the surface of the glass more amenable to protein binding. - In a room devoid of direct sunlight/overhead lighting, coat each coverslip with 100 µL of fluorescent-labeled protein solution at a concentration of at least 100 µg/mL, cover for extra protection from light and let it sit for 20 min.
NOTE: Here, fibronectin isolated from human plasma and dyed with AlexaFluor 488 is used.- To dye fibronectin, combine unlabeled fibronectin of known concentration and volume with the appropriate amount of fluorescent dye in a 1.5 mL tube. Cover the tube with aluminum foil to protect the dye from light and incubate it at room temperature for 1 h, mixing gently every 10 min by turning the tube upside down 5-10 times.
NOTE: The amount of dye required varies based on the dye used and the mass of protein being used. See Supplemental File 1 for the calculator used to determine the appropriate amount of dye for fibronectin labeled with Alexa 488. According to the manufacturer's instructions, excess dye can be filtered out with the use of desalting columns (see the Table of Materials).
- To dye fibronectin, combine unlabeled fibronectin of known concentration and volume with the appropriate amount of fluorescent dye in a 1.5 mL tube. Cover the tube with aluminum foil to protect the dye from light and incubate it at room temperature for 1 h, mixing gently every 10 min by turning the tube upside down 5-10 times.
- Rinse each coverslip thoroughly with DI water, and remove excess water from the surface by gently tapping the sides of each coverslip onto a paper towel or similarly absorbent material. Leave the coverslips uncovered in the dark for at least 30 min to allow them to dry completely.
- While the protein-coated coverslips dry, remove the PDMS stamp from the master by cutting it with a scalpel or other sharp blade.
NOTE: It is best not to try and cut through the PDMS on the first attempt, as applying that much pressure will crack the silicon wafer and damage the master. - Plasma treat the PDMS stamps for 2 min under vacuum on high (radio frequency power of 30 W).
- Within a fume hood, place the stamps in a container with a lid and coat each stamp with a very thin layer (<100 µL) of 10% (3-aminopropyl)trimethoxysilane (3-APTMS) diluted in 100% ethanol.
CAUTION: 3-APTMS is a flammable skin and eye irritant; keep it away from flames/sparks, use protective gloves and eyewear when handling, and work under a fume hood. Excessive coating of 3-APTMS solution will cause an orange film to form later in this process. This 3-APTMS surface treatment incorporates the amine functionality into the surface of the PDMS stamp, which will allow for further derivatization of the surface of the stamp later on26. - Cover the container with the stamps and allow them to sit at room temperature for 5 min.
- Using DI water, thoroughly rinse each stamp on both sides.
- Place the stamps in a clean container and coat them liberally with 2.5% glutaraldehyde in DI water.
CAUTION: Glutaraldehyde is toxic; use protective gloves and eyewear when handling and work under a fume hood). This glutaraldehyde treatment alongside the previous 3-APTMS treatment provides aldehyde functionalities on the surface of the PDMS stamps, which can react with the amine groups in the proteins to create a secondary amine linkage, which is critical to the protein removal process27. - Cover the stamps, let them sit at room temperature for 30 min, and then rinse thoroughly with DI water again. Remove excess water from the surface of stamps in the same manner as the coverslips, and allow the stamps to dry uncovered for ~30 min.
- After 30 min, check if both the protein-coated coverslips and the stamps are dry. If either is not completely dry, use a filtered air gun to dry them completely, ensuring that the coverslips are not exposed to light for an extended period.
- Once both the coverslips and stamps are dry, push the stamps pattern side down onto the coverslips with enough pressure so that the stamps come in full contact with the surface of the coverslip. Leave the stamps in contact with the coverslips for 15 min.
NOTE: Due to the covalent amide bond between the glutaraldehyde stamp with the protein layer on the glass coverslip-which is much stronger than the weak hydrophobic interactions between the protein layer and the glass coverslip-the proteins should peel off the glass according to the pattern on the PDMS stamp once it is removed. - After 15 min, carefully peel the PDMS stamps off the coverslips.
NOTE: If the removal process worked correctly, the stamps should not come off the coverslips with no resistance but should also not be so firmly stuck to the coverslips that they cannot be removed without excessive force. - Check the fidelity of the patterned coverslips using the appropriate filter on a fluorescent microscope (depending on which fluorescent dye the proteins are marked with).
- Use the patterned coverslips immediately or save and store them away from direct light.
3. Activated coverslips
NOTE: The bottom coverslips for use in the experimental chamber for PAA gels are made in this step. This bottom coverslip is specially treated to allow the PAA gel to remain securely adhered to as the top patterned coverslip is removed during the patterning process. Similar techniques are also described elsewhere10,12,15,28.
- Sonicate 30 mm coverslips in 100% ethanol for 10 min, rinse with DI water, and then thoroughly dry with a filtered air gun. Prepare up to 6 coverslips at a time per batch in a 6-well plate.
- Plasma treat the coverslips for 1 min on high (radio frequency power of 30 W) and then place each coverslip into a well of a 6 well plate.
- Coat each coverslip with a very thin layer of 5% APTMS in ethanol in a fume hood.
NOTE: An orange residue will form in case of excessive coating in this process. - Cover the 6-well plate and let the coverslips sit for 5 min.
- Rinse the coverslips (both sides) and the inside of each well thoroughly with DI water and remove excess water inside the wells.
- Place the coverslips back in the 6-well plate and add approximately 2 mL of 0.5% glutaraldehyde in DI water.
- Cover the 6-well plate and let the coverslips sit in the glutaraldehyde solution for 30 min; then, thoroughly rinse both the coverslips and the wells of each plate with DI water.
- Store the treated coverslips in DI water within the 6-well plates for up to two weeks or use them immediately. Ensure the coverslips are completely dry before use.
4. PAA gel fabrication and pattern transfer
NOTE: Once patterned coverslips are made, they must be used to transfer those protein patterns to the PAA hydrogel soon afterward (<24 h)1,29,30. The following recipe is for a PAA gel with a Young's modulus of 3.6 kPa. The amounts of bis-acrylamide, acrylamide, and DI water can be varied to adjust the stiffness of the PAA gels12.
- Just before starting to make the PAA hydrogel precursor, remove the acrylic acid N-hydroxysuccinimide (NHS)-ester from the refrigerator so it can reach room temperature before being opened. Prepare an interchangeable coverslip dish set by sterilizing it with 70% ethanol and letting it sit under UV light in a biosafety cabinet for at least 30 min before use.
CAUTION: NHS is a toxic skin and eye irritant; use protective gloves and eyewear when handling it, and work under a fume hood.- Add 1.25 mL of 40% acrylamide in DI water to a 15 mL conical tube.
CAUTION: Acrylamide is a toxic skin and eye irritant; use protective gloves and eyewear when handling it, and work under a fume hood. - Add 175 µL of bis-acrylamide solution in DI water to the same tube (step 4.1.1).
CAUTION: Bis-acrylamide is a toxic skin and eye irritant; use protective gloves and eyewear when handling it, and work under a fume hood. - Add 500 µL of 10x phosphate-buffered saline (PBS).
CAUTION: PBS is an eye irritant; use protective gloves and eyewear when handling. - Add 2.915 mL of DI water.
- Add 1.25 mL of 40% acrylamide in DI water to a 15 mL conical tube.
- Pipette 969 µL of this precursor into a 1.5 mL microcentrifuge tube, and store the rest at 4 °C for up to two weeks.
- Measure out ~50-100 mg of ammonium persulfate (APS) in another microcentrifuge tube and dilute it in DI water down to 100 mg/mL; set it aside for use later. Open the NHS ester (now at room temperature) in the hood and carefully measure up to 3 mg of NHS in a microcentrifuge tube. Dilute the NHS-ester to 1 mg/mL in 1x PBS.
CAUTION: APS is a skin and eye irritant; use protective gloves and eyewear when handling it, and work under a fume hood. Both APS and NHS-ester will hydrolyze over time, causing the activity of the chemicals in the stock solution to vary. Therefore, both these solutions must be prepared fresh every time (unlike the rest of the precursor). - Perform the next three steps in a fume hood:
- Add 2 µL of tetramethylethylenediamine (TEMED) to the microcentrifuge tube containing the 969 µL aliquot of PAA precursor.
CAUTION: TEMED is a flammable skin and eye irritant; keep it away from heat/flame/sparks, use protective gloves and eyewear when handling, and work under a fume hood. TEMED is one of two crosslinking agents critical to the polymerization of the PAA hydrogel, the other being APS. - Add 15 µL of 1 M hydrochloric acid to decrease the pH of the hydrogel solution and avoid hydrolysis of the NHS-ester.
CAUTION: Hydrochloric acid is a corrosive skin and eye irritant; use protective gloves and eyewear when handling it, and work under a fume hood. - Add 10 µL of the NHS-ester solution to the tube.
NOTE: The NHS is critical to the patterning process. It will react with amine groups in the proteins on the patterned coverslip to form a stable amide bond, which will allow the pattern to be transferred from the glass coverslip to the surface of the PAA gel as it polymerizes31.
- Add 2 µL of tetramethylethylenediamine (TEMED) to the microcentrifuge tube containing the 969 µL aliquot of PAA precursor.
- Perform these final steps in a biosafety cabinet:
- Carefully place the 30 mm coverslip within the metal part of the coverslip dish set (3-APTMS and glutaraldehyde-treated side up) and screw the plastic ring on top. Set up the patterned coverslip so it can be easily reached in the next step, still protecting it from light as much as possible.
- Pipette 5 µL of APS solution into the rest of the PAA precursor in the microcentrifuge tube, invert it to mix, and then immediately pipette 35 µL of that solution onto the 30 mm coverslip.
- Drop the patterned coverslip protein side down onto the solution, being careful not to create air bubbles in the hydrogel. Protect the hydrogel from light and allow it to polymerize for 90 min.
- Once the hydrogel has polymerized, use a razor blade or scalpel to remove the upper coverslip, ensuring that the coverslip does not slide off the gel or fall back onto the gel once it has been removed, as this will ruin the pattern on the surface of the gel.
NOTE: Do not leave the gel uncovered in an area with significant airflow (such as a biosafety cabinet). - To passivate any remaining NHS-ester in the hydrogel, add 2 mL of sterile PBS to the gel and incubate at 37 °C for 45 min. Immediately prepare the gels for experiments or store them overnight in sterile PBS at 4 °C until use.
5. Imaging
- To prepare for experiments with cells, turn on the heat (37 °C) and humidity (70%) in the microscope the afternoon before a planned experiment to allow the equipment inside the microscope chamber to equilibrate to the higher temperature.
NOTE: This step minimizes the z-drift caused by temperature fluctuations. - Just prior to the start of the experiment, turn on the chamber's CO2 source.
- To prevent x-y drift caused by the repeated movement of the microscope stage during the experiment, fix the interchangeable coverslip dish set holding the cell-seeded hydrogel to the stage with double-sided tape.
- Look over the gel to find frames of interest to image, saving each stage position of the sections to be imaged.
- In both the brightfield view and the fluorescent view corresponding to the labeled protein, set the microscope software to image each frame once every 5 min for 2 h.
6. Image analysis
NOTE: A system has been developed that can measure the deformation of the patterned PAA gels by determining the location of the traction points, interpolating the initial locations of the deformed points, and then calculating the cellular traction forces at each location. Any software system capable of performing image processing and numerical calculations can be used. The program aims to determine traction forces rapidly, eliminating user input and preprocessing procedures that would contribute to user-related errors. The code used here is available here as Supplemental Files 2-10, and these files, along with a pair of practice images, can be accessed at www.bu.edu/mml/downloads.
- In an image processing software, open all individual images taken during a timelapse experiment from each microscope view used in order, from the first to the last image captured, and turn them into a single image stack (clicking on Image | Stacks | Images to Stack). Ensure that there are two separate image stacks: one of the brightfield view of the cells and one of the fluorescent view of the pattern to which they are attached.
- If there is drifting in the fluorescent images (i.e., the island of interest moves around in the x- and/or y-direction between each frame by >1-2 µm), first process the image stack with the StackReg plugin (P. Thévenaz, Swiss Federal Institute of Technology Lausanne) to recenter each image in the stack based on the position of the first (clicking on Plugins | StackReg |Translation | OK).
NOTE: This is critical because even sub-µm drift can significantly affect the final calculation of traction forces, especially on stiffer gels where this x-y drift is outside the range of expected noise. This code will save the images after drift has been removed, which can then be made into a new image stack to be analyzed.
- If there is drifting in the fluorescent images (i.e., the island of interest moves around in the x- and/or y-direction between each frame by >1-2 µm), first process the image stack with the StackReg plugin (P. Thévenaz, Swiss Federal Institute of Technology Lausanne) to recenter each image in the stack based on the position of the first (clicking on Plugins | StackReg |Translation | OK).
- Input the brightfield and fluorescent image stacks into CTFTimelapse.m (Supplemental File 2).
- Specify the file directory where the image stacks are located on line 7.
- On lines 8 and 9, specify the names of the fluorescent image stack and the corresponding brightfield fluorescent stack, respectively.
- Specify PAA gel stiffness (Pa):
- In lines 11-14, which include a few different elastic moduli of PAA hydrogels used most often, comment out (type % at the start of the line) all but the elastic modulus of the gel in the images being analyzed. Alternatively, add the elastic modulus if not already present and comment out the rest (3658.19 Pa for test images).
- Specify dot radius (m) on line 15 (1 × 10⁻⁶ m for test images).
- Specify maximum possible dot diameter (µm) on line 16 (2.5 µm for test images).
- Specify pixel ratio (µm/pixel):
- In lines 17-20, which include a few different image pixel ratios based upon imaging setups used previously, comment out (type % at the start of the line) all but the pixel ratio of the images being analyzed. Alternatively, add the pixel ratio used if not already present and comment out the rest (0.1613 µm/pixel for test images).
- On lines 35 and 87, specify the file directory where the necessary image processing files are located.
NOTE: From the fluorescent image stack, the code determines the location of each fluorescent dot and tracks the movement of each dot between each image in the stack20. The initial position of the microcontact printed points is known because they do not deform when properly transferred to the hydrogel32.
- Wait for two figures and one dialogue box to appear once the program finds the dots. Use Figure 1 to ensure that the program has found the correct dots and did not find many dots where there were none. Use Figure 2 to choose the rectangular grid that helps the program locate and calculate cellular traction forces.
NOTE: Figure 1 is the brightfield image of the cell with the dots found by the program (which will be red) overlaid over it (see Figure 3A). Figure 2 is an image displaying the same dots shown in Figure 1 but without the brightfield image in the background.- Wait for the dialog box to prompt to Press Enter After Selecting Point-wherein each point is one of the red dots found by the program-and has one large button inside it labeled Enter.
- Choose four different dots in Figure 2 to create a rectangular grid around and including the cell/cluster on that pattern. Select each dot one by one with a left click of the mouse and confirm it by pressing Enter on the button in the aforementioned dialog box. Keep count of how many dots are between the first and second dot as well as the first and third dot, as the program will ask for these values once all four-corner dots have been selected. Enter these values into the command window (type the number of dots and click the enter button on the keyboard when prompted to).
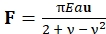
- Once the rectangular grid is chosen, wait for the script to calculate traction forces that it finds within the grid based on the locations of the fluorescent dots. Note that the script first finds the displacement vector (u) of the geometric center of each dot and then calculates the corresponding traction force vector (F) using Eq (1):
 (1)
(1)
Where E is the Young's modulus of the PAA substrate, a is the radius of the fluorescent dot markers, and ν is the Poisson's ratio of the PAA substrate32. Eq (1) assumes that the substrate is an infinite elastic half-space, that traction forces are applied at the center of each circular dot marker, and that spacing between the dot markers is sufficiently large so that their respective displacements do not interact with each other23.
NOTE: In the experiments described here, dot markers of radius a = 1 µm and 6 µm center-to-center spacing are used. Traction force arrows inside the cell/cluster pointing inwards toward the center of the cell should be present, while the area outside the cell/cluster should not have traction arrows present (see Figure 3C-E). Traction arrows pointing outward from inside the cell/cluster or many large traction arrows present outside the cell are indicative of a poorly chosen rectangular grid. - Once the correct traction field is found, select an appropriate region of interest (ROI) surrounding the cell/cluster, which includes all traction arrows within the cell using the cursor.
- To draw the ROI, left-click as many times as necessary to draw a polygon shape with as many sides as desired, adjust the shape or move the ROI after it is drawn by left-clicking on the corners or edges, respectively. Once the ROI is drawn, double left-click to move on to the next image in the stack. Repeat this for all images in the brightfield stack.
NOTE: The code will save traction force and displacement data for each time point in the same folder as the original image stacks, which can then be analyzed further.
- To draw the ROI, left-click as many times as necessary to draw a polygon shape with as many sides as desired, adjust the shape or move the ROI after it is drawn by left-clicking on the corners or edges, respectively. Once the ROI is drawn, double left-click to move on to the next image in the stack. Repeat this for all images in the brightfield stack.
PAA hydrogels with the Young's modulus of E = 3.6 kPa and the Poisson's ratio of ν = 0.445 were made for use by this subtractive micropatterning method. The hydrogels were made to be ~100 µm thick, which allows them to be imaged with the imaging setup used here while also preventing the cells from sensing the rigid coverslip below the gel, which would cause problems in studies focused on cellular rigidity sensing23,33. Gels of many other stiffness levels (up to 30 kPa) have been successfully made and imaged using the indirect micropatterning method34, so the method is not limited to the use of only 3.6 kPa hydrogels. The coverslips are treated ahead of time with glutaraldehyde to allow the gel to remain fixed to the lower coverslip when the top patterned coverslip is removed (Figure 2C,D).
To visualize and measure cellular traction forces within clusters, the 3.6 kPa hydrogels were indirectly patterned with fluorescent fibronectin (Figure 2A–D) to create island patterns of predetermined size and shape (Figure 2E). Other types of proteins can also be patterned onto these soft hydrogels21,35,36,37,38. The quality of the transferred pattern is related directly to the fidelity of the master mold from which the PDMS stamp is cast. Molds that have had SU-8 delamination will see a deterioration in the quality of the patterns made from stamps cast from these delaminated molds. For example, molds with delaminated SU-8 will often create micropatterns containing sections of unpatterned fibronectin between the predetermined islands. If cast on a gel, these patterns permit cell attachment to the gel in areas outside the island micropattern. Because of this, imaging cell clusters attached to fully or mostly intact island patterns was the priority.
Bovine vascular smooth muscle cells (BVSMCs) were seeded onto these hydrogels at a density of approximately 60-80 × 103 cells/gel to promote cluster formation and allowed to adhere for 18-24 h prior to imaging. Just prior to the experiments, cells were stained with a live-cell nucleus stain to allow living cells to be identified and determine the number of cells in each cluster. Micropattern islands with and without cells were imaged and analyzed. Imaging islands without cells allowed for the calculation of the noise present in traction force calculations for 3.6 kPa gels. These false-positive displacement measurements can then be used to determine an appropriate threshold value below which displacements should be excluded.
It has been found that 0.3 µm is usually sufficient to eliminate pattern infidelity that leads to false-positive displacement measurements. Doing so may cause the loss of low-force tractions but is essential for removing false-positive tractions. When imaging, cell clusters on mostly intact island patterns were prioritized (i.e., those not missing many if any dots) and mostly intact patterns without cells. Each ROI was imaged once every 5 min for 2 h. The microscope used to capture images of both cells and the patterned PAA gels during extended timelapse experiments was a fluorescence microscope with an automatic stage, a fluorescence light source, a camera, and standard microscope software. This microscope has a custom set of filters to observe many different colors of fluorescence. The objective used to view the cells and the patterned hydrogel is a 40x water immersion objective, NA = 1.15. This microscope is also equipped with a customized temperature (37 °C)-, humidity (70%)-, and CO2 (5%)-regulated system to keep cells viable during long experiments.
To calculate the traction forces from the images of the micropattern islands, image analysis software was used to track the displacements of the fluorescent fibronectin dots over time. Knowing the displacements of the fluorescent dots and the stiffness of the PAA gel onto which the dots are patterned, the program can determine the values of the traction forces imparted by both individual cells and clusters on the PAA substrate. However, there are two ways by which the program becomes unable to determine traction values. If too many dots within a given frame of interest are deformed, the program struggles to calculate forces, as the program relies on most of the dots in an analyzed image to be undeformed. Moreover, if two dots are too close to one another (center-to-center distance of ≤2 µm20), the displacements of the individual dots could interfere with each other, which prevents accurate determination of their actual displacement values and thus their traction values. As long as the micropatterns are designed with dots that are well spaced apart, cells should not be able to displace the dots so much that they become that close together, even on softer substrates.
Figure 3 shows the capabilities of the removal patterning method. Here, the ability of this method to fabricate isolated, well-defined island patterns of predetermined shape is shown in Figure 3B–E, where the fibronectin adhesion dots are present only within the desired area of the island. These isolated islands of adhesion dots further allow for better control of cluster shape, as shown in Figure 3A. Because the shape and size of the islands are consistent, the cell clusters that attach and grow onto them will also tend to have consistent shape, as the island patterns limit the cluster growth area. Finally, Figure 3B–E also show the ability of these islands to be used to calculate cellular traction forces and the tendency of these traction forces to change over time. Here, the traction forces of the cluster are the largest around the edges of the island. This is expected because the cells at the edges of a cluster have fewer interactions with other cells in the cluster than those in the interior of the cluster. Thus, these cells at the edges exert greater forces on the substrate in response to cytoskeletal contraction than the cells in the interior.
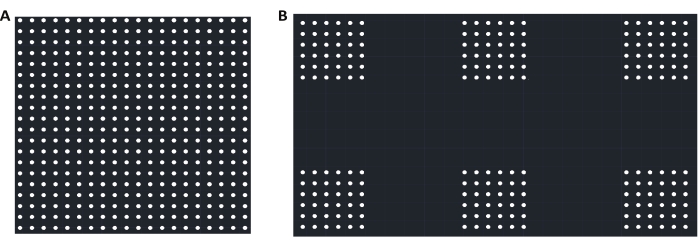
Figure 1: Design of photomask. (A) A representation of the first half of the photomask design used here, a discrete grid of 2 µm diameter dots spaced at 6 µm center-to-center. While the image shown here is just a small portion of the design, this grid fills a space of 1.5 x 1.5 cm total on the photomask. (B) A representation of the second half of the photomask design; shown here are six small islands of 6 x 6 dots. On the photomask, there are multiple different island sizes: 6 x 6 (shown here), 12 x 12, 25 x 25, and 42 x 42 dots. An equally spaced (50 µm between islands) array of each island size takes up a space of 1.5 x 0.375 cm, and the arrays of different islands are separated by 50 µm. The dots in each island are 2 µm in diameter and spaced 6 µm center-to-center. The two sections of the mask described in A and B are separated by 0.75 cm. Please click here to view a larger version of this figure.
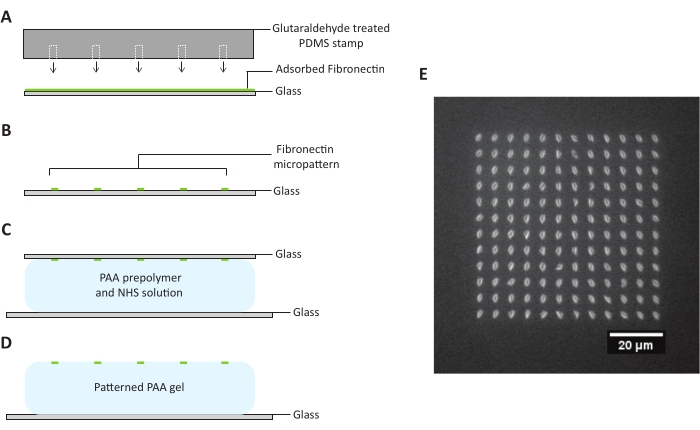
Figure 2: Subtractive microcontact printing. (A) A PDMS stamp is treated with glutaraldehyde and put in contact with a glass coverslip evenly coated with fluorescent fibronectin solution. (B) Upon removal from the coverslip, the PDMS stamp strips away most of the fluorescent fibronectin on the surface of the coverslip, leaving micron-sized dots of protein only in locations predetermined by the design of the PDMS stamp. (C) The patterned coverslip is placed in contact with a PAA prepolymer and NHS solution. (D) Once the PAA gel has been allowed to fully polymerize, the top coverslip is removed, and a pattern of fibronectin is printed onto the PAA gel surface. (E) An example of a discrete island pattern made up of evenly spaced dots on a PAA hydrogel with a Young's modulus of 3.6 kPa. Scale bar = 20 µm. Abbreviations: PDMS = polydimethylsiloxane; PAA = polyacrylamide; NHS = N-hydroxysuccinimide. Please click here to view a larger version of this figure.

Figure 3: Analysis of cells on island micropatterns. (A) A brightfield image of a cluster of 3 BVSMCs overlaid onto a fluorescent fibronectin island micropattern on a PAA hydrogel with a Young's modulus of 3.6 kPa is shown. Dots are 2 µm in diameter and are separated by 6 µm center-to-center. (B) The fluorescent pattern shows that a number of the fibronectin points in the island have been displaced due to the application of forces by the BVSMCs. (C) The traction forces applied on the adhesion points at time point 1 (start of a 2 h experiment). Direction of these force vectors is indicated by direction of the colored arrows. Their magnitude is indicated by the arrow color and its corresponding value on the color bar (all force values are in nN). Vector length is relative based on the minimum and maximum forces calculated by the program for each time point. (D) Traction forces of the same cluster at time point 13 (halfway through a 2 h experiment) (E) Traction forces of the same cluster at time point 25 (end of a 2 h experiment). Abbreviations = BVSMCs = bovine vascular smooth muscle cells; PAA = polyacrylamide. Please click here to view a larger version of this figure.
Supplemental File 1: Calculator for labeling fibronectin This is a tool for calculating the correct amount of Alexa488 fluorescent dye to use when labeling fibronectin. Please click here to download this File.
Supplemental File 2: CTFTimelapse.m This is the image processing file, which allows for the calculation of cellular traction forces as described in Section 5 (Image Analysis). This includes selecting a desired grid of dots (Steps 6.3-6.3.2) and choosing the region of interest for the CTF calculations (Steps 6.5 and 6.5.1). All of the following supplemental files are called directly by this script or one of the other functions used within it. Please click here to download this File.
Supplemental File 3: analyze_initial_image_4.m This function is called by CTFTimelapse.m, and its purpose is to locate and align the fluorescent dots on a grid from the first frame of the image stack of the deformed grid pattern to match the original undeformed grid pattern. This allows for traction force calculations for the first frame in the image stack. Please click here to download this File.
Supplemental File 4: analyze_subsequent_images.m This function is called by CTFTimelapse.m, and its purpose is to locate and align the fluorescent dots on a grid from all frames of the image stack of the deformed grid pattern after the first. This allows for traction force calculations for all frames in the image stack after the first. Please click here to download this File.
Supplemental File 5: bpass.m This function is called by both analyze_initial_image_4.m and analyze subsequent_images.m, and its purpose is to implement a real-space bandpass filter that processes the image stack of the deformed grid pattern. This filter suppresses pixel noise and long-wavelength image variations while retaining information of a characteristic size. Please click here to download this File.
Supplemental File 6: CellBoundary.m This function is called by CTFTimelapse.m, and its purpose is that it allows the program user to draw a region of interest around the cell/cluster for which traction forces are to be calculated. Please click here to download this File.
Supplemental File 7: pkfnd.m This function is called by both analyze_initial_image_4.m and analyze_subsequent_images.m, and its purpose is to find local maxima in an image with pixel-level accuracy. These peaks are used by cntrd.m to locate the fluorescent grid pattern for CTFTimelapse.m. Please click here to download this File.
Supplemental File 8: cntrd.m This function is called by both analyze_initial_image_4.m and analyze_subsequent_images.m, and its purpose is to locate the centroid of bright spots in an image to sub-pixel accuracy. This allows for location of the fluorescent grid pattern by CTFTimelaspe.m, as described in Step 6.3. Please click here to download this File.
Supplemental File 9: FourCorners.m This function is called by both analyze_initial_image_4.m and analyze_subsequent_images.m, and its purpose is to take the grid chosen by the user (Steps 6.3-6.3.2) and calculate the distance between each corner dot in two orthogonal axes. Please click here to download this File.
Supplemental File 10: track.m This function is called by both analyze_initial_image_4.m and analyze_subsequent_images.m, and its purpose is to track the movement of the dots in the fluorescent grid pattern between frames, which is essential for calculating the corresponding traction forces. Please click here to download this File.
