The Caco-2 Cell Bioassay for Measurement of Food Iron Bioavailability
Summary
The Caco-2 cell bioassay for iron (Fe) bioavailability represents a cost-effective and versatile approach to assess Fe bioavailability from foods, food products, supplements, meals, and even diet regimens. Thoroughly validated to human studies, it represents the state of the art for studies of Fe bioavailability.
Abstract
Knowledge of Fe bioavailability is critical to the assessment of the nutritional quality of Fe in foods. In vivo measurement of Fe bioavailability is limited by cost, throughput, and the caveats inherent to isotopic labeling of the food Fe. Thus, there exists a critical need for an approach that is high-throughput and cost-effective. The Caco-2 cell bioassay was developed to satisfy this need. The Caco-2 cell bioassay for Fe bioavailability utilizes simulated gastric and intestinal digestion coupled with culture of a human intestinal epithelial cell line known as Caco-2. In Caco-2 cells, Fe uptake stimulates the intracellular formation of ferritin, an Fe storage protein easily measured by enzyme-linked immunosorbent assay (ELISA). Ferritin forms in proportion to Fe uptake; thus, by measuring Caco-2 cell ferritin production, one can assess intestinal Fe uptake from simulated food digests into the enterocyte.
Via this approach, the model replicates the key initial step that determines food Fe bioavailability. Since its inception in 1998, this model approach has been rigorously compared to factors known to influence human Fe bioavailability. Moreover, it has been applied in parallel studies, with three human efficacy studies evaluating Fe biofortified crops. In all cases, the bioassay correctly predicted the relative amounts of Fe bioavailability from the factors, crops, and overall diet. This paper provides detailed methods on Caco-2 cell culture coupled with the in vitro digestion process and cell ferritin ELISA necessary to conduct the Caco-2 cell bioassay for Fe bioavailability.
Introduction
To fully understand the research need and benefit of the Caco-2 cell bioassay for Fe bioavailability, one must first understand the approaches that were in place prior to the advent of this model. The measurement of Fe bioavailability from a food or meal in vivo is a challenging task, particularly when combinations of food need to be assessed in a meal or diet. Isotopic labeling has been the most common approach for the measurement of Fe bioavailability over the past 50 years1. Isotopic labeling is used for single-meal and multiple-meal studies and is impractical for long-term studies. Stable isotopes of Fe such as 57Fe and 58Fe are the most commonly used; however, studies have been conducted with radioisotopes such as 59Fe, utilizing whole-body counting2. For plant foods, isotopic labeling has been done via extrinsic or intrinsic labeling. For extrinsic labeling, a known amount of isotope is added to the food or meal. The food is then mixed, and a 15-30 min equilibration period is incorporated into the protocol prior to the consumption. Hydroponic culture-adding the isotope to the nutrient solution to incorporate it into the plant while it grows and develops-is required for the intrinsic labeling of plant foods. The pros and cons of each approach are discussed below.
Extrinsic isotopic labeling
In the early to mid-1970s, human Fe absorption was studied by extrinsic labeling of Fe in foods, wherein a known amount of isotope is added to the known amount of Fe in the food or meal, mixed, and equilibrated for 15-30 min before measurements. Various amounts of extrinsic isotopes have been used, ranging from 1% to 100% of the intrinsic Fe, but most commonly in the range of 7%-30%3. Extrinsic labeling is based on the assumption that the extrinsic Fe isotope gets fully equilibrated with the intrinsic Fe of the food or meal. Extrinsic isotope absorption is then measured, and each atom of the extrinsic isotope is calculated to represent a given number of intrinsic Fe atoms. This calculation is based on the relative molar amounts. In 1983, multiple validation studies of the technique were summarized in a review paper4. Validation of the technique was done by simultaneously comparing the percent absorption of the extrinsic isotopic label to the percent absorption of an intrinsic isotopic label. Thus, a ratio of the extrinsic to intrinsic absorption close to 1 suggests that each pool of Fe was equally absorbed. At the time, a ratio close to 1 was also considered to represent equilibration of the extrinsic isotope with the intrinsic Fe of the food or meal. Ratios of extrinsic to intrinsic Fe absorption ranged from mean values of 0.40 to 1.62, with a mean (±SD) ratio of 1.08 ± 0.14 in 63 comparisons. It is important to note that, in all of the studies summarized in this review, none directly tested the equilibration of the extrinsic label with the intrinsic Fe. In summary, the authors of the review concluded the following:
"The extrinsic tag technique has proven valid for several foods under certain experimental conditions. But, this method cannot yet be considered proven with regards to all types of foods. The extrinsic tag method is not appropriate for monitoring iron absorption from a diet that contains insoluble forms of iron. The validity of this technique relies upon the basic assumption that the extrinsic tag exchanges completely with all endogenous nonheme food iron. At present it is not known how completely the different forms of nonheme iron are labeled by an extrinsic tag. This is important in light of studies which have suggested that iron inhibitors may affect the extrinsic tag differently than some forms of nonheme iron in foods. Research on food factors which can impair a complete isotopic exchange is scant. Thus, interpretation of bioavailability data from extrinsic tag research requires consideration of inhibitors of exchange which may be present in the food or diet."
Since 1983, only two studies have been published that evaluated the accuracy of extrinsic labeling of Fe3,5. In both these studies, the equilibration of an extrinsic isotopic label was directly compared with the intrinsic Fe of the foods, which, in these studies, were staple food crops. White, red, and black bean varieties were tested, along with lentils and maize. Using established in vitro digestion techniques and the measurement of Fe solubility and precipitation, both studies demonstrated that extrinsic isotopic labeling does not consistently result in full equilibration, with evidence that, for some bean varieties, the misequilibration can be very high depending on the amount of extrinsic isotope and seed coat color3. Despite the conclusions of the 1983 review paper, extrinsic labeling studies of beans continued6,7,8,9,10,11,12. None of these studies included testing the equilibration of the extrinsic label with the intrinsic Fe.
Intrinsic labeling
Intrinsic labeling of plant food for the assessment of Fe bioavailability eliminates the accuracy issues of equilibration in extrinsic labeling. However, this approach cannot yield large amounts of material because of the requirement of greenhouse space for hydroponic culture. Hydroponic culture is labor-intensive, requires a high quantity of expensive stable isotope, and often results in plant growth different in terms of yield and seed Fe concentration. Due to the cost, intrinsic labeling is only suitable for small-scale studies aimed at understanding mechanisms underlying Fe uptake or factors influencing Fe uptake from foods. Production of 1-2 kg of a staple food crop costs approximately $20,000-$30,000 for materials alone, depending on the isotope and hydroponic approach13,14.
Given the challenges associated with isotopic labeling, investigators sought to develop in vitro approaches. Early methods utilized simulated gastric and intestinal food, coupled with the measurement of Fe solubility or Fe dialyzability as an estimate of bioavailability15. Such studies quickly found that Fe dialyzability was not a consistent measure of bioavailability as Fe can be soluble, tightly bound to compounds and, therefore, not exchangeable, leading to the overestimation of bioavailability. To address these issues, methodology to utilize a human intestinal cell line evolved, thereby adding a living component and enabling the measurement of Fe uptake16. The human intestinal cells-Caco-2 cells-originated from a human colon carcinoma and have been widely used in nutrient uptake studies. This cell line is useful as, in culture, the cells differentiate into enterocytes that function similarly to the brush border cells of the small intestine. Studies have shown that Caco-2 cells exhibit the appropriate transporters and response to factors that influence Fe uptake17,18.
The initial studies, utilizing radioisotopes to measure Fe uptake in Caco-2 cells, were refined to measure Fe uptake based on Caco-2 cell ferritin formation. Caco-2 cell ferritin measurement enhanced sample throughput and negated issues of radioisotope handling and the equilibration of extrinsic Fe with intrinsic Fe19,20. Measurement of Fe uptake via ferritin formation enabled researchers to study a broad range of foods, including complex meals21. Thus, simulated (in vitro) digestion coupled with Caco-2 cell Fe uptake provided a better physiological assessment of Fe uptake from foods. It is important to note that this model primarily determines relative differences in Fe bioavailability. Like many useful cell lines, Caco-2 cells also have shown variability in responsiveness but have maintained consistent relative differences in Fe uptake between foods. Proper technique and careful attention to detail can improve consistent cell ferritin formation response in Caco-2 cells.
The in vitro digestion/Caco-2 cell model is also known as Caco-2 cell bioassay. This assay has been thoroughly validated via direct comparison to human and animal studies22. In addition to the direct parallel comparison of the bioassay to human efficacy trials, this model has been shown to exhibit a qualitatively similar response in Fe uptake to that of humans18,19,23. Therefore, as an in vitro approach, the Caco-2 cell bioassay warrants high credibility as a screening tool for evaluating Fe nutrition from foods. It has been widely applied to numerous foods and food products21,24,25,26,27,28.
Since its inception in 1998, the Caco-2 cell bioassay has advanced the field of Fe nutrition as it has helped identify factors that influence intestinal Fe uptake. In so doing, this model has developed and refined research objectives for more definitive and less costly human studies. One could also argue that the use of the model negates the need for some human trials.
In summary, the relative delivery of Fe from a food or meal can be measured with the Caco-2 cell bioassay. Regardless of the amount of Fe in the test meal, the bioassay defines the relative amount of Fe taken up into the enterocyte-the first step of the absorption process. This is the most important step in defining Fe bioavailability, as most often the goal is to measure with the intent to improve or, at the very least, monitor the nutritional quality of Fe in a food. Given that iron status is regulated by absorption, and thus Fe uptake is upregulated in Fe-deficient individuals to meet nutritional needs, the standard conditions of the model are designed so that Fe uptake by the cells is maximal. In this way, the bioassay provides a true measure of the potential of the food to deliver Fe.
Protocol
NOTE: As a convenient point of reference for readers, the following methodology describes the specific culture conditions and materials required for the measurement of Fe bioavailability from 20 experimental samples, plus the required quality controls, in a run of the bioassay. Increasing the number of samples beyond this capacity is not recommended due to the time required for various cell culture and in vitro digestion steps within the bioassay.
1. Choosing the amount of samples
- For solid or liquid foods, determine an amount of food that can be considered representative of the sample to be tested.
- In testing for Fe bioavailability from a bean variety, use 100-150 g of bean seed and process this amount to a homogeneous sample.
- For liquid samples such as fortified juices, milk products, and sports beverages, ensure that the food is well mixed prior to sampling.
NOTE: The amount of bean seed material mentioned above is essential to account for the inherent differences between seeds of this staple crop.
2. Preparation of samples
- Rinse off soil and dust from any food sample with distilled-deionized water before processing.
- Process the appropriate amount of sample as per the experimental objectives, such as by cooking method and milling.
NOTE: For cooking and processing, it is critical to use cookware and equipment that is not a potential source of contaminant Fe. Stainless steel equipment does not contaminate; however, equipment such as stone mill grinders, cast iron cookware, and any non-stainless steel equipment containing Fe can add significant amounts of contaminant Fe. A standard stainless steel coffee grinder is often adequate for grinding. - Lyophilize and grind to a homogeneous powder.
NOTE: Once homogenized, research has shown that three independent replications of analysis are adequate for each food being measured.- If sample homogeneity is difficult to achieve, revise the formulation or processing of the product. If this is not possible, add replications if the non-homogeneity is not severe.
- For most homogeneous solid foods, use 0.5 g of lyophilized sample per replicate. If necessary, use up to 1.0 g of sample per replicate, but check if more than 0.5 g yields a benefit in the degree of response.
NOTE: Amounts higher than 0.5 g of solid foods may clog the dialysis membrane (see below). - Use 1-2 mL of liquid samples.
NOTE: Lyophilization is often not necessary for liquid samples.
3. Caco-2 cell culture
- Stock cultures
- Acquire Caco-2 cells from a certified supplier.
- Culture the cells from stock vials at 37 °C in an incubator with a 5% CO2 air atmosphere (constant humidity) using Dulbecco's Modified Eagle's Medium (DMEM) supplemented with 25 mM HEPES (pH 7.2), 10% (v/v) fetal bovine serum (FBS), and 1% antibiotic-antimycotic solution.
- Once sufficient cells are available, usually after 7-10 days of culture, seed the cells in non-collagen-coated flasks at a density of 30,000 cells/cm2.
- Choose the flask size depending on the number of cells available and needed for seeding multiwell plates.
NOTE: In general, the T225 (225 cm2) flasks work best for experiments where 11 multiwell (6-well; 9.66 cm2/well) plates are used (10 plates for sample comparisons, 1 plate for quality controls) per bioassay. - Grow cells in flasks for 7 days, changing the medium every other day, and use on the 7th day for seeding the multiwell plates.
NOTE: It is recommended to use a passage range of no more than 10-15 passages from when the cells are started from stock culture and subsequently used in a series of experiments. Cell culture passages should be limited as a broad range of passages can result in adaptive changes in the cell line and, thus, variability in the response of the model.
- Cell culture on multiwell plates
- Seed the Caco-2 cells at a density of 50,000 cells/cm2 in 6-well collagen-coated plates.
NOTE: This step usually works best if done on a Wednesday. The following steps will make it evident why this day of the week is optimal. - Grow the cells for 12 days at 37 °C in an incubator with a 5% CO2 air atmosphere (constant humidity) using DMEM supplemented with 25 mM HEPES (pH 7.2), 10% (v/v) FBS, and 1% antibiotic-antimycotic solution.
NOTE: Culturing the cell monolayers longer than 12 days can result in cell overgrowth. Previous research has clearly shown that, under these conditions, at 12 days post seeding, the cell monolayer is mature, attached well to the plate, and optimal in the consistency of response29,30,31. Growing the cells longer, such as up to 19-21 days, results in cell overgrowth, and the media rapidly depletes in nutrients, resulting in unhealthy monolayers. - During the 12 day period, change the medium at least every 2 days on a consistent daily schedule.
- On the 12th day post seeding, replace the culture medium with 2 mL of Minimum Essential Medium (MEM [pH 7]) supplemented with 10 mM PIPES (piperazine-N,N'-bis-[2-ethanesulfonic acid]), 1% antibiotic-antimycotic solution, hydrocortisone (4 mg/L), insulin (5 mg/L), selenium (5 μg/L), triiodothyronine (34 μg/L), and epidermal growth factor (20 μg/L).
NOTE: If seeding was started on a Wednesday, then the 12th day would be a Monday. - On the following day (i.e., day 13), remove the MEM and replace it with 1 mL of MEM (pH 7).
NOTE: This step would occur on a Tuesday. This is the day when the bioassay begins; thus, the 13 day schedule yields the advantage of a consistent weekly schedule, allowing the bioassay to be conducted consistently on the same weekday.
- Seed the Caco-2 cells at a density of 50,000 cells/cm2 in 6-well collagen-coated plates.
4. In vitro digestion
- Preparation of insert rings
- Create a sterilized insert ring using a silicone O-ring fitted with an acid-washed dialysis membrane (Figure 1A).
NOTE: Prepare inserts 1 day in advance (i.e., Monday, day 12) of the day of the bioassay and store in 18 MΩ water at 4 °C until ready to use. - On the day of the bioassay (Tuesday, day 13), remove the inserts from the refrigerator, drain, and replace the water with 0.5 M HCl. Leave it at room temperature in a laminar flow hood for at least 1 h prior to use.
NOTE: This step should be done prior to removing the MEM from the culture plates. Acid washing of the membrane serves to remove possible contaminating Fe and sterilizes the insert ring and membrane. - Drain the 0.5 M HCl from the inserts and rinse with sterile 18 MΩ water. Store in sterile 18 MΩ water at room temperature in a laminar flow hood until ready to use.
- Insert a ring into each well of the 6-well plates with Caco-2 cells, thereby creating a two-chamber system. Return the plates with the inserts to the incubator.
NOTE: This step should be done just after fresh 1.0 mL of MEM is added to each well (see Step 3.2.5.).
- Create a sterilized insert ring using a silicone O-ring fitted with an acid-washed dialysis membrane (Figure 1A).
- Preparation of pepsin solution
- On the day of the experiment, prepare the pepsin solution by dissolving 0.145 g of pepsin in 50 mL of 0.1 M HCl. Shake the solution gently on a platform shaker for 30 min at room temperature.
- Preparation of pancreatin-bile solution
- On the same day as the experiment, prepare 0.1 M NaHCO3 by dissolving 2.1 g of NaHCO3 in 250 mL of 18 MΩ water.
- Mix 0.35 g of pancreatin and 2.1 g of bile extract in 175 mL of 0.1 M NaHCO3.
- Once the pancreatin and bile extract are solubilized, add 87.5 g of a weak cation exchange resin (see the Table of Materials) and mix by shaking for 30 min at room temperature.
- Pour the slurry into a large column and collect the eluate.
- Elute the column with an additional 70 mL of 0.1 M NaHCO3, collecting this volume into the pancreatin bile solution.
NOTE: The purpose of the resin is to remove contaminant Fe commonly found in the pancreatin-bile extracts.
- Initiate in vitro digestion.
- Weigh out the sample in a sterile 50 mL centrifuge tube (polypropylene), followed by the addition of 10 mL of physiological saline at pH 2, containing 140 mM NaCl and 5 mM KCl.
- Initiate the gastric digestion process by adding 0.5 mL of the prepared porcine pepsin solution to the sample and incubate on a rocking shaker at a low, gentle setting for 1 h at 37 °C.
- Following this period, initiate the intestinal digestion process of each sample by adjusting the pH to 5.5-6.0 with 1.0 M NaHCO3.
- Add 2.5 mL of the pancreatin-bile solution to each sample tube and adjust the pH to 6.9-7.0 with 1.0 M NaHCO3.
- Once the pH is adjusted, equalize the volume in each tube using 140 mM NaCl, 5 mM KCl (pH 6.7) solution, measuring the weight of the tube with a target value of 15 g.
NOTE: For some foods, one may need to bring the total volume to 16 g or 17 g, depending on the buffering capacity of the foods. - Transfer 1.5 mL of each intestinal digest into the upper chamber (i.e., containing the insert ring with the dialysis membrane) of a corresponding well of the 6-well culture plate containing the Caco-2 cells (Figure 1B).
- Replace the plate cover and incubate at 37 °C (5% CO2 air atmosphere) on a rocking shaker at 6 oscillations/min for 2 h.
- Remove the insert ring with the digest and add an additional 1 mL of MEM (pH 7) to each well.
- Return the cell culture plate to the incubator (37 °C; 5% CO2 air atmosphere) for an additional 22 h.
- After 22 h, remove the cell culture medium and add 2.0 mL of 18 MΩ water to the cell monolayer.
NOTE: The water will osmotically lyse the cells. - Harvest the entire cell lysate into standard polypropylene microcentrifuge tubes or similar for subsequent cell protein and cell ferritin analyses.
5. Measurement of Caco-2 cell ferritin and cell protein
- Use the cell lysate from Step 4.4.10. for the measurement of cell ferritin and protein.
- To measure the ferritin content of the Caco-2 cells, follow the kit's instructions (see the Table of Materials), with the exception of increasing the incubation time from 30 min to 2 h for the mouse anti-ferritin antibody-horseradish peroxidase (HRP) conjugate.
- To measure cell protein, follow the instructions provided in the cell protein kit (see the Table of Materials).
Representative Results
Identification and measurement of Fe bioavailability in staple food crops
One of the primary reasons for developing this model was to identify factors that influence Fe bioavailability in staple food crops and provide a tool for plant breeders that would enable them to identify and develop varieties with enhanced Fe bioavailability. The common bean (Phaseolus vulgaris) has been targeted globally as a crop for Fe biofortification; thus, the model has been applied extensively to evaluate the nutritional quality of Fe in a broad range of bean market classes and bean breeding programs. For example, yellow beans are an emerging market class in the United States. In regions such as East Africa, they are highly popular and are widely known to be fast-cooking and considered by many to be "easy to digest." Recent studies with the Caco-2 cell bioassay have demonstrated that certain varieties of yellow beans can have high Fe bioavailability relative to other color classes (Figure 2). In this study, the Manteca varieties were identified as being high in Fe bioavailability relative to reference controls of the white and red-mottled color classes. Moreover, the results were consistent across two consecutive harvest years. Such comparisons are simply not feasible in other models, particularly in vivo models, due to the high cost and much lower throughput of animal and human trials.
Evaluation of food processing effects on Fe bioavailability
The Caco-2 cell bioassay can also be applied to evaluate food processing effects on Fe bioavailability. For example, the results in Figure 3 are from an analysis of beans and bean-based pasta of multiple color classes. The results demonstrate how processing the beans into a flour increased Fe bioavailability from white (Snowdon, Alpena, and Samurai) and yellow (Canario) bean varieties. For the cranberry (Etna), red kidney (Red Hawk), and black (Zenith) varieties, Fe bioavailability decreased in the pasta flour preparations. Related analyses demonstrated that processing the beans into a flour disrupted the cotyledon cell walls of the beans, thus making the intracellular Fe accessible for uptake. Iron uptake increased in the white and yellow bean pasta as the seed coats of these varieties did not contain polyphenolic compounds that inhibit Fe bioavailability. In contrast, the seed coats of cranberry, red kidney, and black beans contain high levels of inhibitory polyphenols, thus decreasing Fe uptake. These results clearly indicate the usefulness of the model in exposing factors that can influence the nutritional quality of Fe, which otherwise would go undetected.
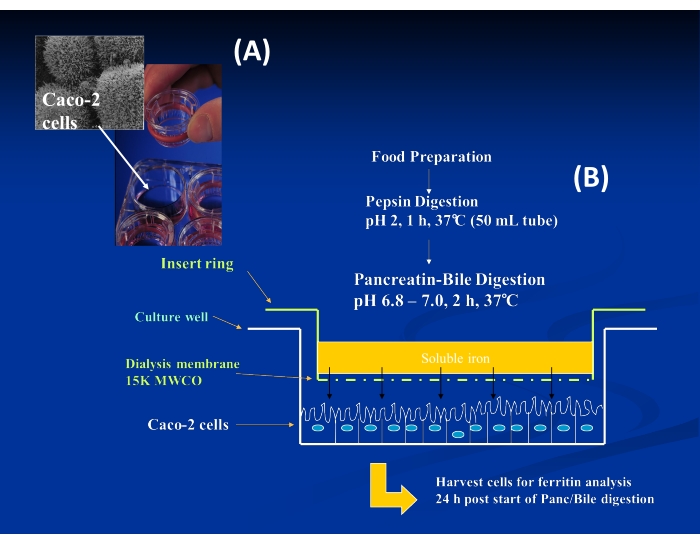
Figure 1: Insert ring setup for Caco-2 cell Fe uptake. (A) Image of Caco-2 cells and insert ring with attached dialysis membrane. (B) Diagram of the overall procedure for in vitro digestion coupled with Caco-2 cell Fe uptake within a single well of the multi-well plate. Please click here to view a larger version of this figure.
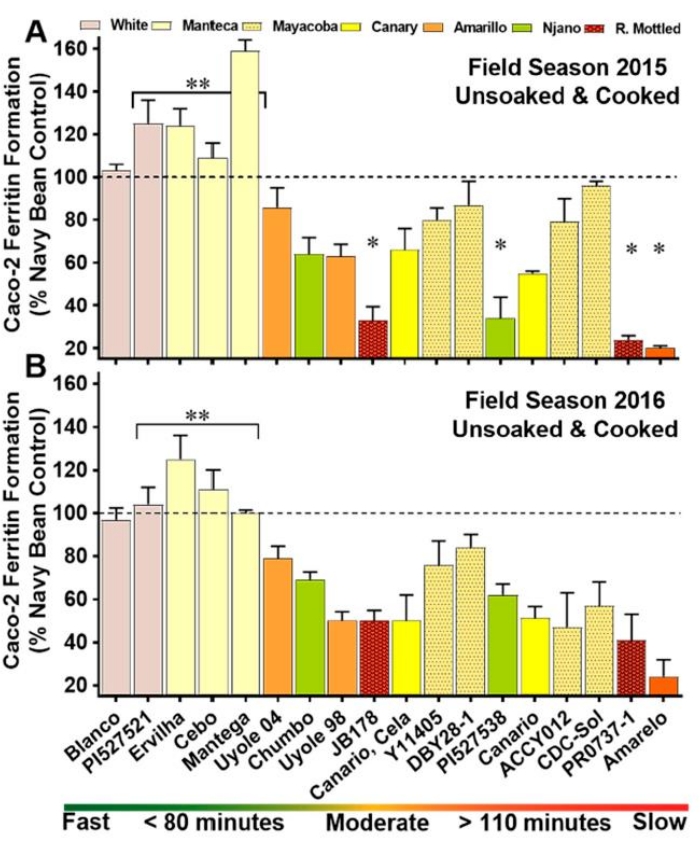
Figure 2: Iron bioavailability scores of unsoaked and cooked whole-seed genotypes in a diverse panel of yellow beans. (A) Field season 2015; (B) field season 2016. Values are means (standard deviation) of triplicate measurements from two field replicates per genotype (n = 6). Genotypes are categorized on the x-axis by cooking class, ranked from the fastest-cooking genotype to the slowest-cooking entry. *Significantly lower (p < 0.05) iron bioavailability score than the other YBP entries. **Significantly higher (p < 0.05) iron bioavailability scores than the other YBP genotypes. This figure was modified from32. Please click here to view a larger version of this figure.
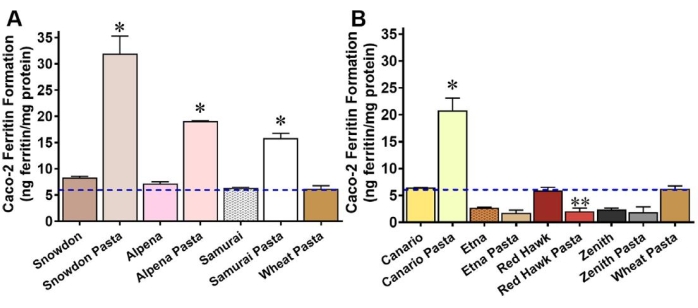
Figure 3: Iron bioavailability expressed as Caco-2 cell ferritin formation (nanogram of ferritin per milligram of cell protein) of bean varieties and their corresponding bean-based spaghettis. (A) Three white bean varieties and their corresponding bean-based spaghettis; (B) four colored bean varieties and their corresponding bean-based spaghettis. Values are the means (± standard deviation) of six measurements from each variety. The blue hyphenated line indicates the iron bioavailability of a non-fortified durum wheat pasta control extruded, cooked, and processed in the same manner as the bean-based spaghettis. *Significantly (p ≤ 0.05) higher Caco-2 cell ferritin formation than whole beans after cooking. **Significantly (p ≤ 0.05) lower Caco-2 cell ferritin formation than whole beans after cooking. This figure was modified from33. Please click here to view a larger version of this figure.
Discussion
Since its inception, numerous studies have been published that describe this method for the Caco-2 cell bioassay. The basic conditions have remained relatively unchanged since the initial publication in 199818. However, over the past 20 years, numerous technical details have been refined and standardized to yield unprecedented consistency in the response of the bioassay. Careful and precise adherence to the cell culture and in vitro digestion conditions are the key to the consistent and sensitive response of the bioassay.
From our experience in training numerous individuals in the use of this method, the most common struggle is the proper culture of the Caco-2 cells. Consistent culture of healthy monolayers is key to healthy and responsive Caco-2 cell monolayers. If cell protein levels are not highly consistent from well to well and not within the range of cell protein listed in the protocol, the investigator should reexamine the cell culture conditions for deviation from the protocol. Alternatively, low-level microorganism contamination may exist, the cell culture incubator may not be operating properly, or the cell culture medium may not be properly formulated.
The in vitro digestion process is another source of potential problems. Removal of contaminant Fe from the digestive enzymes is critical. Despite manufacturer claims, it is prudent to periodically check the Fe concentration of the enzymes and make sure that the Fe removal process (see protocol) is effective. If Fe contamination is present in the digestive enzymes, then the baseline digest quality control will yield cell ferritin values in excess of the recommended range.
An experienced and trained investigator should be able to analyze 20 experimental samples, plus the quality controls, in a single run of the bioassay. Thus, approximately 12 six-well plates are needed for each run of the bioassay. Higher numbers of samples per bioassay are not recommended as the timing for pH titration during the digestion process can be too long, leading to potential inconsistency between sample digestion times.
The disadvantages of this model are relatively few. It requires investigators who are highly skilled in cell culture and capable of precise attention to detail and protocol. Laboratory space must be clean of sources of Fe contamination, and reagents and other materials should be routinely monitored for Fe contamination. Thus, the user should have the capability or access to instrumentation for the measurement of Fe concentration. This model is only a relative or semi-quantitative measure. However, with the proper use of reference controls, the model can provide some quantitative estimates of Fe absorption. Indeed, a conversion equation of absorption ratios of control versus test material has been generated19.
The bioassay works according to the following principle: Caco-2 cells produce more ferritin protein in response to increases in cellular Fe concentrations. Therefore, Fe bioavailability is proportional to the increase in Caco-2 cell ferritin production. This increase is expressed as a ratio of cell ferritin to total Caco-2 cell protein (nanogram of ferritin per milligram of total cell protein) after exposure to a digested sample19. Ferritin measurements are made using an ELISA kit (see the Table of Materials) tested for response in this bioassay. Total cell protein concentrations are quantified using a protein assay kit. As mentioned previously, under the conditions used for this method, typical Caco-2 cell protein levels in a six-well plate range from 2.0 mg to 2.6 mg of cell protein per well. Values outside of this range indicate unhealthy cell cultures, possible overgrowth of cells, or poor cell seeding technique. Within a given run of the bioassay, values should only vary up to 0.2 mg per well. Furthermore, under the seeding densities and culture conditions used in this methodology, there is substantial brush border enzyme activity at 13 days post seeding, indicating maturation of most, if not all, of the cell monolayer28,29,30. Monitor cell monolayers throughout the 13 days prior to use for contamination or stress, such as vacuole formation or gaps in monolayer formation. If such conditions are evident, the cells should not be considered valid for use in the bioassay.
To monitor the responsiveness of the Caco-2 bioassay, each experiment should be run with several quality controls, including a blank digest, containing only the physiologically balanced saline and the gastrointestinal enzymes. These controls ensure that there is no Fe contamination in the bioassay. Ferritin values of Caco-2 cells exposed to the blank digest typically range from 1 ng to 6 ng of ferritin/mg cell protein. Baseline ferritin in this range also indicates that the cells are at relatively low Fe status and, thus, should exhibit maximal sensitivity to available Fe.
For the initial 15 years of use, additional quality controls included 1) a blank digest with FeCl3 (66 µM) and 2) a blank digest of FeCl3 (66 µM) plus the addition of 1.3 mM ascorbic acid. Ferritin values for the FeCl3 digest were typically in the range of 30-50 ng of ferritin/mg cell protein, and the FeCl3 digest with ascorbic acid was in the range of 250-400 ng of ferritin/mg cell protein. In more recent years, the blank digest remains a quality control; however, we have switched to using a food sample with and without ascorbic acid at a ratio of 20:1, ascorbate:Fe. The food sample used was a white bean flour that contains approximately 65 µg Fe/g of sample. These quality controls give a narrower and more consistent range of response, yielding 20-30 ng of ferritin/mg of cell protein for the white bean flour and 70-150 ng of ferritin/mg of cell protein for the white bean flour plus ascorbate. It should be noted that the new range of values are from the referenced kit in the Table of Materials, which tends to be slightly lower than the now-defunct Ramco ELISA kit. As of the publication of this manuscript, only 2-3 months of data have been acquired with the referenced kit.
It is important to recognize the results and cell culture conditions that indicate an invalid or suboptimal run of the bioassay. First, as stated in the methods, if the blank digest conditions yield cell ferritin concentrations higher than the suggested range, this could be indicative of Fe contamination of the cell culture media, the digestive enzymes, or the dialysis membrane. Acceptable Fe concentrations for the cell culture media and the digestive enzymes are <20 µg Fe/mL. Values outside the range for the other quality controls, particularly if they are on the low side, also indicate that the validity of the results is questionable.
In summary, this model is highly sensitive to bioavailable Fe, as the cell culture conditions are designed to create cells of low Fe status; thus, their mechanisms for Fe uptake are highly upregulated. It is a robust model capable of high throughput. Any food or diet that can be fed to humans can be assessed in this model and, therefore, the bioassay has a broad range of applications. Plant breeders can use this model to measure Fe bioavailability in staple foods, identifying traits and chromosomal regions that affect Fe bioavailability. Food scientists can apply the model to determine optimal formulations and evaluate the effects of processing to ensure adequate Fe bioavailability. Nutritionists can use the model to evaluate and monitor dietary Fe bioavailability from individual foods, food combinations, and even diet plans. It has been thoroughly validated to human trials, correctly predicting the direction and magnitude of effects in every application. Thus, by combining simulated digestion with intestinal epithelial cell Fe uptake, this model represents the critical first step in the Fe absorption process and is, therefore, capable of predicting the delivery or bioavailability of Fe from foods.
Disclosures
The authors have nothing to disclose.
Acknowledgements
The author is deeply grateful for the technical efforts of Yongpei Chang and Mary Bodis. The extremely successful application of this model in the field of nutrition is a direct result of their expertise and attention to detail. The development of this model was funded entirely by the United States Department of Agriculture, Agricultural Research Service.
Materials
| 0.5 M HCl | Fisher Scientific | A508-4 Hydrochloric Acid TraceMetal Grade | |
| 18 megaohm water | Also known as distilled, deionized water | ||
| 3,3′,5-Triiodo-L-thyronine sodium salt | Sigma Aldrich Co | T6397 | |
| 6-well plates | Costar | 3506 | Use for bioassay experiments |
| ascorbic acid | Sigma Aldrich Co | A0278 | |
| bile extract | Sigma Aldrich Co | B8631 | |
| Caco-2 cells | American Type Culture Collection | HTB-37 | HTB-37 is a common variety. |
| Cell culture flasks T225 | Falcon | 353138 | |
| Cell culture flasks T25 | Corning | 430639 | |
| Cell culture flasks T75 | Corning | 430641U | |
| Chelex-100 | Bio-Rad Laboratories Inc | 142832 | Known as the weak cation exchange resin in the protocol |
| collagen | Corning | 354236 | |
| dialysis membrane | Spectrum Laboratories | Spectra/Por 7 Pretreated RC Dialysis Tubing 15,000 MWCO | Spectra/Por 7 Pretreated RC Dialysis Tubing 15,000 MWCO |
| Dulbecco’s Modified Eagle’s Medium | Gibco | 12100046 | DMEM |
| epidermal growth factor | Sigma Aldrich Co | E4127-5X.1MG | |
| Ferritin ELISA Assay Kit | Eagle Biosciences | FRR31-K01 | |
| fetal bovine serum | R&D Systems | S12450 | Optima |
| HEPES | Sigma Aldrich Co | H3375 | |
| Hydrocortisone-Water Soluble | Sigma Aldrich Co | H0396 | |
| insert ring | Corning Costar | not sold | Transwell, for 6 well plate, without membrane |
| insulin | Sigma Aldrich Co | I2643 | |
| KCl | Sigma Aldrich Co | P9333 | |
| large column | VWR International | KT420400-1530 | |
| Minimum Essential Medium | Gibco | 41500034 | MEM |
| NaCl | Fisher Scientific | S271 | |
| pancreatin | Sigma Aldrich Co | P1750 | |
| PIPES disodium salt | Sigma Aldrich Co | Piperazine-1,4-bis(2-ethanesulfonic acid) disodium salt P3768 | |
| porcine pepsin | Sigma Aldrich Co | P6887 or (P7012-25G Sigma | |
| protein assay kit | Bio-Rad Laboratories Inc | Bio-Rad DC protein assay kit 500-0116 | Measurement of Caco-2 cell protein |
| silicone o rings | Web Seal, Inc Rochester NY | 2-215S500 | |
| sodium bicarbonate | Fisher Scientific | S233 | |
| Sodium selenite | Sigma Aldrich Co | S5261 | |
| ZellShield | Minerva Biolabs | 13-0050 | Use at 1% as antibiotic/antimycotic ordered through Thomas Scientific |
References
- Fairweather-Tait, S. J., Dainty, J. Use of stable isotopes to assess the bioavailability of trace elements: a review. Food Additives Contaminants. 19 (10), 939-947 (2002).
- Hadley, K. B., Johnson, L. K., Hunt, J. R. Iron absorption by healthy women is not associated with either serum or urinary prohepcidin. American Journal of Clinical Nutrition. 84 (1), 150-155 (2006).
- Glahn, R. P., Cheng, Z., Giri, S. Extrinsic labeling of staple food crops with isotopic iron does not consistently result in full equilibration: revisiting the methodology. Journal of Agricultural and Food Chemistry. 63 (43), 9621-9628 (2015).
- Consaul, J. R., Lee, K. Extrinsic tagging in iron bioavailability research: a critical review. Journal of Agricultural and Food Chemistry. 31 (4), 684-689 (1983).
- Jin, F., Cheng, Z., Rutzke, M. A., Welch, R. M., Glahn, R. P. Extrinsic labeling method may not accurately measure Fe absorption from cooked pinto beans (Phaseolus vulgaris): comparison of extrinsic and intrinsic labeling of beans. Journal of Agricultural and Food Chemistry. 56 (16), 6881-6885 (2008).
- Junqueira-Franco, M. V. M., et al. Iron absorption from beans with different contents of iron, evaluated by stable isotopes. Clinical Nutrition ESPEN. 25, 121-125 (2018).
- Petry, N., Egli, I., Zeder, C., Walczyk, T., Hurrell, R. Polyphenols and phytic acid contribute to the low iron bioavailability from common beans in young women. Journal of Nutrition. 140 (11), 1977-1982 (2010).
- Petry, N., et al. Stable iron isotope studies in Rwandese women indicate that the common bean has limited potential as a vehicle for iron biofortification. Journal of Nutrition. 142 (3), 492-497 (2012).
- Petry, N., Egli, I., Campion, B., Nielsen, E., Hurrell, R. Genetic reduction of phytate in common bean (Phaseolus vulgaris L.) seeds increases iron absorption in young women. Journal of Nutrition. 143 (8), 1219-1224 (2013).
- Petry, N., et al. Phytic acid concentration influences iron bioavailability from biofortified beans in Rwandese women with low iron status. Journal of Nutrition. 144 (11), 1681-1687 (2014).
- Petry, N., Boy, E., Wirth, J. P., Hurrell, R. F. Review: The potential of the common bean (Phaseolus vulgaris) as a vehicle for iron biofortification. Nutrients. 7 (2), 1144-1173 (2015).
- Petry, N., et al. In Rwandese women with low iron status, iron absorption from low-phytic acid beans and biofortified beans is comparable, but low-phytic acid beans cause adverse gastrointestinal symptoms. Journal of Nutrition. 146 (5), 970-975 (2016).
- Donangelo, C. M., et al. Iron and zinc absorption from two bean (Phaseolus vulgaris L.) genotypes in young women. Journal of Agricultural and Food Chemistry. 51 (17), 5137-5143 (2003).
- Dellavalle, D. M., Glahn, R. P., Shaff, J. E., O’Brien, K. O. Iron absorption from an intrinsically labeled lentil meal is low but upregulated in women with poor iron status. Journal of Nutrition. 145 (10), 2253-2257 (2015).
- Miller, D. D., Schricker, B. R., Rasmussen, R. R., Van Campen, D. An in vitro method for estimation of iron availability from meals. American Journal of Clinical Nutrition. 34 (10), 2248-2256 (1981).
- Glahn, R. P., Wien, E. M., Van Campen, D. R., Miller, D. D. Caco-2 cell iron uptake from meat and casein digests parallels in vivo studies: use of a novel in vitro method for rapid estimation of iron bioavailability. Journal of Nutrition. 126 (1), 332-339 (1996).
- Martini, L. A., Tchack, L., Wood, R. J. Iron treatment downregulates DMT1 and IREG1 mRNA expression in Caco-2 cells. Journal of Nutrition. 132 (4), 693-696 (2002).
- Glahn, R. P., Wortley, G. M., South, P. K., Miller, D. D. Inhibition of iron uptake by phytic acid, tannic acid, and ZnCl2: studies using an in vitro digestion/Caco-2 cell model. Journal of Agricultural and Food Chemistry. 50 (2), 390-395 (2002).
- Glahn, R. P., Lee, O. A., Yeung, A., Goldman, M. I., Miller, D. D. Caco-2 cell ferritin formation predicts nonradiolabeled food iron availability in an in vitro digestion/Caco-2 cell culture model. Journal of Nutrition. 128 (9), 1555-1561 (1998).
- Yun, S., Habicht, J. P., Miller, D. D., Glahn, R. P. An in vitro digestion/Caco-2 cell culture system accurately predicts the effects of ascorbic acid and polyphenolic compounds on iron bioavailability in humans. Journal of Nutrition. 134 (10), 2717-2721 (2004).
- Pachón, H., Stoltzfus, R. J., Glahn, R. P. Homogenization, lyophilization or acid-extraction of meat products improves iron uptake from cereal-meat product combinations in an in vitro digestion/Caco-2 cell model. British Journal of Nutrition. 101 (6), 816-821 (2009).
- Tako, E., Bar, H., Glahn, R. P. The combined application of the Caco-2 cell bioassay coupled with in vivo (Gallus gallus) feeding trial represents an effective approach to predicting Fe bioavailability in humans. Nutrients. 8 (11), 732-757 (2016).
- Engle-Stone, R., Yeung, A., Welch, R., Glahn, R. Meat and ascorbic acid can promote Fe availability from Fe-phytate but not from Fe-tannic acid complexes. Journal of Agricultural and Food Chemistry. 53 (26), 10276-10284 (2005).
- Tako, E., Blair, M. W., Glahn, R. P. Biofortified red mottled beans (Phaseolus vulgaris L.) in a maize and bean diet provide more bioavailable iron than standard red mottled beans: studies in poultry (Gallus gallus) and an in vitro digestion/Caco-2 model. Nutrition Journal. 10, 113 (2011).
- Pachón, H., Stoltzfus, R. J., Glahn, R. P. Chicken thigh, chicken liver, and iron-fortified wheat flour increase iron uptake in an in vitro digestion/Caco-2 cell model. Nutrition Research. 28 (12), 851-858 (2008).
- Beasley, J. T., et al. Metabolic engineering of bread wheat improves grain iron concentration and bioavailability. Plant Biotechnology Journal. 17 (8), 1514-1526 (2019).
- Zhu, L., Glahn, R. P., Nelson, D., Miller, D. D. Comparing soluble ferric pyrophosphate to common iron salts and chelates as sources of bioavailable iron in a Caco-2 cell culture model. Journal of Agricultural and Food Chemistry. 57 (11), 5014-5019 (2009).
- Wortley, G., Leusner, S., Good, C., Gugger, E., Glahn, R. Iron availability of a fortified processed wheat cereal: a comparison of fourteen iron forms using an in vitro digestion/human colonic adenocarcinoma (Caco-2) cell model. British Journal of Nutrition. 93 (1), 65-71 (2005).
- Jumarie, C., Malo, C. Alkaline phosphatase and peptidase activities in Caco-2 cells: differential response to triiodothyronine. In Vitro Cellular and Developmental Biology – Animal. 30 (11), 753-760 (1994).
- Engle, M. J., Goetz, G. S., Alpers, D. H. Caco-2 cells express a combination of colonocyte and enterocyte phenotypes. Journal of Cellular Physiology. 174 (3), 362-369 (1998).
- Ferruzza, S., Rossi, C., Sambuy, Y., Scarino, M. L. Serum-reduced and serum-free media for differentiation of Caco-2 cells. Alternatives to Animal Experimentation. 30 (2), 159-168 (2013).
- Wiesinger, J. A., Cichy, K. A., Tako, E., Glahn, R. P. The fast cooking and enhanced iron bioavailability properties of the Manteca yellow bean (Phaseolus vulgaris L). Nutrients. 10 (11), 1609 (2018).
- Wiesinger, J. A., Cichy, K. A., Hooper, S. D., Hart, J. J., Glahn, R. P. Processing white or yellow dry beans (Phaseolus vulgaris L.) into a heat treated flour enhances the iron bioavailability of bean-based pastas. Journal of Functional Foods. 71, 104018 (2020).
