1. Cell culture
- Culture human lung adenocarcinoma cell line A549, and human monocytic cell line THP-1 in RPMI1640 media supplemented with 10% FBS and 1% penicillin-streptomycin at 37 °C in a humidified chamber with 5% CO2.
- Culture MRC-5 human lung fibroblast cells in DMEM medium supplemented with 10% FBS and 1% penicillin-streptomycin solution at 37 °C in a humidified chamber with 5% CO2.
2. Preparation of multicellular tumor spheroids using A549 lung adenocarcinoma cell line, MRC5 fibroblasts, and THP-1 monocytes
NOTE: The multicellular tumorigenic and non-tumorigenic 3D spheroids were prepared using the hanging drop method in a 90 mm cell culture dish. A detailed description of these spheroids' development is given below. All cell culture reagents such as complete medium, PBS, and 0.25% trypsin-EDTA solution should be pre-warmed at 37 °C before use unless stated otherwise.
- Preparation of cell suspension
- Grow A549 and MRC5 adherent cells (5 x 10⁶ cells each) in DMEM complete growth medium (Dulbecco's modified eagle medium [DMEM] + 10% fetal bovine serum [FBS] + 1% penicillin-streptomycin) in T25 flasks at 37 °C in a humidified chamber with 5% CO2.
- For THP-1 cells, grow the cell suspension (5 x 10⁶ cells) in complete growth medium (RPMI1640 + 10% FBS + 1% penicillin-streptomycin) in T25 flasks. For better growth, place the T25 flasks at 37 °C in a humidified chamber with 5% CO2 in a standing position.
- After 3 days, at 80%-85% confluency, wash the A549 and MRC5 cells with calcium- and magnesium-free PBS (phosphate buffer saline) by adding 1 mL of PBS (25-30 °C) in each flask for 1 min and aspirating it.
- Harvest the A549 and MRC5 cells from the flask by incubating them with 500 µL of 0.25% trypsin-EDTA solution for 5 min at 37 °C in a humidified incubator with 5% CO2. Immediately after, add 4 mL of complete growth media to inactivate the trypsin.
- Collect the cell suspension from the T25 flask into a 15 mL tube and pellet it down at 125 x g for 5 min. Remove the supernatant and resuspend the cells in 5 mL of complete growth medium.
- Establishment of multicellular tumor spheroids
NOTE: All steps of the tumor spheroid formation should be performed inside the biosafety cabinet in order to maintain sterile conditions. The maximum volume of the cell suspension has been standardized as a drop of 25 µL to prepare a droplet such that it will not fall down while inverting the lids.- Count A549, MRC5, and THP-1 cell numbers using a cell counter. For each spheroid droplet (25 µL) maintain the following cell numbers: 5,000 A549 cells, 4,000 MRC5 cells, and 1,000 THP-1 cells, following the protocol described by Arora et al.7. Calculate the cell numbers accordingly for a 1 mL volume.
NOTE: Spheroids were initially prepared with three different cell counts per spheroid (i.e., 5000, 8000, and 10,000). Also, different cell ratios of tumor cells/fibroblasts/monocytes (1:1:1, 2:2:1, 4:2:1, 5:2:1, and 5:4:1) were checked. Finally, a successful 3D multicellular spheroid formation was seen with a ratio of 5:4:1 and was used for the study. Fibroblast concentration was increased based on its proportion in the tumor microenvironment, which further enhanced the rigidity of the tumor spheroids. The detailed procedure was reported in a recent publication by Arora et al.7. - Prepare the cell suspension at a ratio of 5 (A549, 2 x 10⁵ cells/mL) to 4 (MRC5, 1.6 x 10⁵ cells/mL) to 1 (THP-1, 5 x 10⁴ cells/mL) and make up the volume to 1 mL with complete DMEM.
- Place a drop of 25 µL of cell suspension mixture onto the cover of a 90 mm culture dish (approximately 50 drops/90 mm dish). Fill the bottom of the 90 mm culture dish with 10 mL of sterile water.
- Carefully invert the lid over the water-filled hydration chamber and place the dish in a cell culture incubator for 3 days.
- Monitor the spheroids under the microscope at 10x magnification on day 4. To acquire images, switch on the power switch, place the 60 mm dish carefully on the stage, and select the magnification (10x). Adjust the lenses and examine the cells to analyze the cell aggregation and proliferation. Press the Freeze and Save buttons provided on the microscope to capture the image.
- Change the growth media on day 4 by carefully aspirating 20 µL of medium from each droplet and replacing it with a fresh complete growth medium.
- Count A549, MRC5, and THP-1 cell numbers using a cell counter. For each spheroid droplet (25 µL) maintain the following cell numbers: 5,000 A549 cells, 4,000 MRC5 cells, and 1,000 THP-1 cells, following the protocol described by Arora et al.7. Calculate the cell numbers accordingly for a 1 mL volume.
3. Live-dead analysis of tumor spheroids
- On day 7 and 10, carefully invert the 90 mm dish in the biosafety cabinet and use a 200 µL pipette to collect spheroids from each droplet. Collect five spheroids each in a 1.5 mL tube.
- Add 500 µL of 1x PBS to the 1.5 mL tube containing spheroids and centrifuge at 125 x g for 5 min. Discard the supernatant carefully and resuspend the spheroids in 200 µL of 1x PBS. Do not pipette rigorously to avoid spheroid disintegration.
- Pipette out the spheroids using a 200 µL pipette on a 60 mm dish for calcein-AM and propidium iodide staining.
- Put 5 µL of 1 µM calcein-AM solution and 5 µL of 2 mg/mL propidium iodide solution on the spheroids. Incubate for 10 min. After completion of the incubation period, wash the spheroids gently with 1x PBS twice.
- Place the 60 mm dish containing spheroids under the fluorescent inverted microscope, observe, and capture images at 10x magnification by selecting the fluorescence option in the microscope software and selecting the FITC (green fluorescence channel; excitation 490 nm, emission 515 nm) for calcein and Texas red channel (TXR; excitation 535 nm, emission 617 nm).
- For acquiring the image, switch on Ctr Adv, which is switch 1, followed by switching on the CPU. Wait for the software system to boot. When booted, place the 60 mm dish carefully on the stage and select the magnification (10x) and fluorescent channels (FITC, TXR). Adjust the lenses and scan for the image.
- To view the image in the system, select the option Live and view the image. Adjust the intensity of fluorescence for appropriate optimization. Save the image by clicking the Save button.
NOTE: At this stage, spheroids will be visible through the naked eye. Under the light microscope, spheroids will appear as round, rigid spheres at 10x magnification. Multiple spheroids can be collected at once using a 200 µL pipette.
4. Disintegration and cell suspension of tumor spheroids
- Collect 200 tumor spheroids each on day 7 and 10, using a 1 mL pipette in a 15 mL tube.
NOTE: Before collection, carefully check the shape and form of a single spheroid after transferring it onto a microscopic slide or on a 30 mm dish and observe under the microscope. - Pellet the spheroids by centrifugation at 125 x g for 5 min. Aspirate the supernatant carefully without disturbing the tumor spheroids.
- Carefully wash the spheroids with 200 µL of PBS, centrifuge at 125 x g for 5 min, and cautiously discard the supernatant.
- For the spheroid disintegration, add 400 µL of 0.25% trypsin-EDTA solution and keep at 37 °C for 10 min. Perform vigorous pipetting for complete disintegration of the spheroids.
- Neutralize trypsin by adding 1 mL of complete DMEM growth medium. Centrifuge at 125 x g for 5 min and discard the supernatant carefully.
- Resuspend the pellet in 1 mL of complete DMEM medium and count the total number of cells.
5. Cancer-associated fibroblast (CAF) isolation through microbeads
- For the isolation of CAFs from the tumor spheroids, resuspend 1 x 10⁷ cells in 80 µL of cold magnetic activated cell sorting (MACS) buffer (PBS at pH 7.2 containing 0.5% bovine serum albumin [BSA] and 2 mM ethylenediamine tetraacetic acid [EDTA]).
- Incubate the cell suspension (containing 1 x 10⁷ cells) with 20 µL of anti-fibroblast microbeads. Mix well by gently tapping the tube and incubate for 30 min at room temperature.
- Wash the cells with 1 mL of cold MACS buffer, centrifuge at 125 x g for 5 min, and aspirate the supernatant. Resuspend the cells in 500 µL of MACS buffer.
- For magnetic bead-based cell separation, prepare the MACS column by rinsing it with 3 mL of MACS buffer.
- Place the cell suspension into the column followed by the collection of flow-through containing the unlabeled cell population.
- Wash the column three times with 3 mL of MACS buffer. Remove the column from the separator and place it on the collection tube.
- Collect the anti-fibroblast microbead-labeled cells by adding 5 mL of MACS buffer and firmly pushing the plunger into the column.
- Centrifuge the labeled cells at 125 x g for 5 min. Proceed with the isolated fibroblasts for downstream applications.
6. Flow cytometry-based analysis of ACTA2 expression in isolated CAFs
- Count the number of isolated CAFs and use approximately 6 x 10⁴ cells. Wash the cells once with PBS, centrifuge at 125 x g for 5 min, and aspirate the supernatant.
- Add 100 µL of cell permeabilization buffer (PBS + 0.5% BSA + 0.3% v/v Triton X-100) and incubate the cells at 4 °C for 30 min.
- Vortex the cells intermittently to maintain a single cell suspension. Centrifuge and resuspend the cells in 100 µL of cell permeabilization buffer.
- Add 2 µL of APC conjugated anti-human α-SMA antibody and incubate at 4 °C for 45 min. Following incubation, add 1 mL of permeabilization buffer and centrifuge at 125 x g for 5 min to remove excess antibody.
- Resuspend the pellet in 400 µL of permeabilization buffer for flow cytometric analysis. Acquire a total of 10,000 events of each sample in a flow cytometer. Select ACTA2 positive cells after distinguishing the populations of cells based on their forward and side scatter, selecting the singlet population followed by selecting the ACTA2 positive cells which appear as a single peak on the single parameter histogram.
7. JC-1 staining to determine mitochondrial membrane potential
- Count the number of isolated CAFs and use approximately 6 x 10⁴ cells for 5,5,6,6'-tetrachloro-1,1',3,3' tetraethylbenzimi-dazoylcarbocyanine iodide (JC-1) staining using flow cytometry.
- Wash the cells thoroughly with PBS, centrifuge at 125 x g for 5 min, aspirate the supernatant, and add 100 µL of cell staining buffer.
- Add JC-1 dye at a working concentration of 2 µM and incubate at room temperature for 30 min. On termination of the incubation, wash the cells with PBS, centrifuge at 125 x g for 5 min, and resuspend in a final volume of 400 µL.
- Acquire a total of 20,000 events of each sample in a flow cytometer. Quantify the mitochondrial membrane potential by measuring the red-shifted JC-1 aggregates on the FL-2 channel and the green-shifted monomers on the FL-1 channel.
8. DCFDA staining to estimate cellular reactive oxygen species (ROS) levels
- Use the whole spheroids (50 numbers) as well as the isolated CAFs (6 x 10⁴ cells) from the spheroids for 2',7'-dichlorodihydrofluorescein diacetate (DCFDA) staining.
- Wash the cells thoroughly with PBS, centrifuge at 125 x g for 5 min, aspirate the supernatant, and add 100 µL of cell staining buffer.
- Add DCFDA dye at a working concentration of 1 µM and incubate at room temperature for 30 min. Wash the cells twice with PBS, centrifuge at 125 x g for 5 min, and then resuspend in a final volume of 400 µL.
- Acquire a total of 20,000 events of each sample in a flow cytometer. Assess the ROS levels by measuring the fluorescence at day 7 and day 10 for the spheroids as well as the isolated CAFs.
9. RT-qPCR analysis of CAF markers and glycolytic genes
- Extract RNA from the sorted CAFs using a single-cell lysis kit following the manufacturer's protocol. Prepare cDNA from 100 ng of RNA using a cDNA synthesis kit following the manufacturer's guidelines.
- Perform RT-qPCR to analyze the relative CAF markers (ACTA28 and COL1A29) and glycolytic gene (GLUT110 and MCT411) expression. Perform melt curve analysis after the final extension to ensure the specificity of the products. Normalize the data using the expression of GAPDH as the reference gene. The primer sequences used for RT-qPCR are listed in Supplementary Table 1.
10. Extraction and quantification of the cellular protein from CAFs
NOTE: Perform all steps of protein extraction on ice to avoid protein degradation.
- Resuspend approximately 4 x 10⁶ CAF cells in 100 µL of ice-cold RIPA lysis buffer (containing 30 mM HEPES, 150 mM NaCl, 1% NP-40, 0.1% SDS, and 0.5% sodium deoxycholate with 5 mM of Halt protease and phosphatase inhibitor cocktail, and 5 mM of EDTA at pH 7.4).
- Vortex rigorously for proper cell lysis. Sonicate the cell suspension at 20 Hz frequency, 20% amplitude for 15 s, and 3x pulse.
- After sonication, centrifuge the protein extract at 13,000 x g for 15 min at 4 °C. Transfer the supernatant to a pre-chilled 1.5 mL tube. Perform the BCA protein assay to quantify protein.
11. Spectrophotometric analysis of enzymatic activities in CAFs
NOTE: The following enzyme activities are analyzed in tumor spheroid derived CAFs.
- Measurement of succinate dehydrogenase activity
- To evaluate the activity of succinate dehydrogenase (SDH) in CAFs, prepare SHE buffer with 250 mM sucrose, 10 mM 4-(2-hydroxyethyl)-1-piperazineethanesulfonic acid (HEPES), and 1 mM ethylene glycol-bis(β-aminoethyl ether)-N,N,N′,N′-tetraacetic acid(EGTA) and adjust the pH to 7.3. Add 0.4 mM phenazine methosulfate (PMS), 0.2 mM 2,6-dichloroindophenol (DCPIP), 50 mM MgCl2, 0.02% Triton X-100, and 1 mM cyanide in the SHE buffer and keep at 37 °C.
- Extract the cellular protein from the CAFs as described in step 10 (2 x 10⁶ cells). In each well of a 96-well plate, incubate 100 µL of 0.1 mg cellular protein with 100 µL of SHE reaction mixture at 37 °C for 15 min.
- To start the enzymatic activity, add 10 mM succinate12. Calculate the enzyme activity in nM/min/mL by measuring the changes in absorbance at 600 nm.
- The conversion factor for DCIP is 0.0215 A/nM based on its molar extinction coefficient12. Calculate the relative activity of SDH by using the mentioned formula:
Relative activity (nM/min/mL/enzyme) = X
X  X V
X V
Where ΔA/min = rate of enzymatic reaction (Ainitial– Afinal)/(timefinal– A/mininitial), Ve = volume of sample, and V = volume of the reaction.
- Estimation of cytochrome c oxidase activity
- To evaluate the cytochrome c oxidase (COX) activity in CAFs, add 0.2 mg/mL of cellular protein in a KME reaction buffer solution containing KME buffer (125 mM KCl, 20 mM 3-(N-morpholino)propane sulfonic acid [MOPS], and 1 mM EGTA, pH 7.4), 0.02 % Triton X-100, and 5 mM sodium ascorbate.
- In a separate tube, mix 50 µM horse heart cytochrome c with 5 mM sodium ascorbate and incubate at 37 °C for 5 min13. After the incubation, add 20 µL of reduced cytochrome c to 500 µL of KME reaction buffer solution containing cellular protein.
- Calculate the enzyme activity in units/µL by measuring the changes in absorbance at 550 nm. The absorption of cytochrome c at 550 nm changes with its oxidation state. The difference in extinction coefficients (mM) between reduced and oxidized cytochrome c is 21.84 at 550 nm14. Calculate the amount of enzyme activity in the cellular lysate as:
Units/µL =
Where ΔA/min = A/minsample-A/minblank and 21.84 = ΔԑmM between oxidized cytochrome c and reduced cytochrome c at 550 nm
- Assessment of lactate dehydrogenase activity
- Perform a lactate dehydrogenase (LDH) assay using a lactate dehydrogenase cell assay kit following the manufacturer's instructions.
- Add LDH test reagent (10 µL) to 0.5 mg/mL of cellular proteins and incubate for 5 min at 37 °C. On termination of the incubation, measure the absorbance at 45 nm every 1 min for 8 min.
- Prepare the NADH standards for colorimetric detection using 0 (blank), 2.5, 5, 7.5, 10, and 12.5 nM/well of NADH followed by the addition of LDH test reagent to a final volume of 50 µL.
- Plot the differences in absorbance between Tinitial and Tfinal to the NADH standard curve to determine the amount of NADH generation. Assess the activity of LDH by using the mentioned formula:
LDH activity = X sample dilution factor
Where B = amount (nmole) of NADH generated between Tinitial and Tfinal, reaction time = Tfinal – Tinitial (min), and Ve = sample volume (mL) added to well.
Figure 1 shows the development of multicellular tumor spheroids using three different cell populations-A549 (lung adenocarcinoma), MRC-5 (fibroblasts), and THP-1 (monocytes)-by the hanging drop method as observed on day 7 and day 10 under the microscope. On day 7, spheroids were compact and rigid with a 260 ± 5.3 µm diameter, and on day 10, spheroids were 480 ± 7.5 µm in diameter (Figure 1A upper panel, Figure 1B-D).The day 7 and day 10 spheroids were tight aggregates and mostly uniform in size and diameter as observed in the whole batch analysis. The compactness and rigidity peak of the 3D multicellular spheroid was noticed around day 10 (Figure 1A upper panel, Figure 1B-D). The cell viability was assessed by calcein-AM/PI staining. A decrease in propidium iodide fluorescence (red) and an increase in calcein-AM fluorescence (green) from day 7 to day 10 was observed, indicating cell proliferation in the 3D microenvironment (Figure 1A,E). The spheroids were also assessed for hypoxic characteristics using Image-iT Red hypoxia staining; a hypoxic core at the center of the day 10 spheroids was found (Figure 1F). Furthermore, a marked upregulation of E-cadherin gene expression was observed in day 7 and day 10 spheroids compared to day 4 (Figure 1G), suggesting cell compactness and rigidity. Also, an increase in MKi67 gene expression with the increase in days of tumor spheroid formation (Figure 1H) indicates cell growth and proliferation.
Cancer-associated fibroblasts (CAFs) were isolated from the day 10 tumor spheroids using anti-fibroblast microbeads as described by the diagrammatic overview in Figure 2A. Isolated fibroblasts from these tumor spheroids are approximately 69% ACTA2 positive (Figure 2B). At the mRNA level, isolated fibroblasts showed nearly threefold (Figure 2C) and tenfold (Figure 2D) upregulation in ACTA2 and COL1A2 (collagen type 1 alpha 2 chain) gene expressions, respectively, as compared to the normal MRC-5 fibroblasts, suggesting the role of microenvironmental clues in CAF transformation/activation within these tumor spheroids.
To evaluate the cellular reactive oxygen species (ROS) levels in the activated CAFs, the ROS levels in the tumor spheroids were examined first by using the 2',7'-dichlorofluoresceindiacetate (DCFDA), which diffused into the cells and deacetylated by the cellular esterases followed by the ROS dependent oxidation into the fluorescent molecule 2',7'-dichlorofluorescein (DCF). A significant increase in ROS levels in the day 10 tumor spheroids was observed when compared to day 7, suggesting the possible involvement of ROS generation on CAF activation (Figure 3A,B). A significant increase was observed in cellular ROS levels in CAFs isolated from day 7 and day 10 tumor spheroids (Figure 3C). Moreover, an alteration of mitochondrial membrane potential was noticed as indicated by the JC-1 staining (Figure 3D). Collectively, these results suggest a change in mitochondrial membrane potential and oxidative stress in the activated CAFs isolated from tumor spheroids.
To analyze whether the increased ROS levels and mitochondrial membrane depolarization in the CAFs are causally linked with the upregulation of certain glycolytic targets for producing the reverse Warburg effect on cancer cells in the tumor microenvironment, the relative gene expression of GLUT1 and MCT4 was examined. An induction of GLUT1 (Figure 4A) and MCT4 (Figure 4B) gene expression was observed in CAFs when compared to normal fibroblasts. This observation is in line with previous studies in this field that showed an increased abundance of GLUT1 and MCT4 levels in CAFs11. GLUT1 is responsible for transporting glucose into the cells, whereas MCT4 extrudes lactate from the cells, and therefore, this trend seems fairly logical for CAF biology. Since mitochondrial dysfunction is markedly correlated with the alteration of various mitochondrial enzyme activities, the different mitochondrial enzyme activities in the isolated CAFs were analyzed. Significant induction of lactate dehydrogenase (LDH) enzyme activity in CAFs compared to the normal fibroblasts was observed (Figure 4C), suggesting high lactate production, high oxidative mitochondrial stress, and reverse Warburg effect in activated CAFs. Next, cytochrome c oxidase (COX) enzyme activity was examined in CAFs as the enhancement of cellular ROS levels is known to increase COX expression and activity through the NF-kB dependent pathway15. An induction of COX activity was observed in CAFs compared with the normal fibroblasts (Figure 4D), suggesting the involvement of ROS-dependent signaling in the conversion of CAFs from normal fibroblasts. The mitochondrial succinate dehydrogenase (SDH) enzyme activity in CAFs was also assessed and found its notable induction compared to normal fibroblasts (Figure 4E).
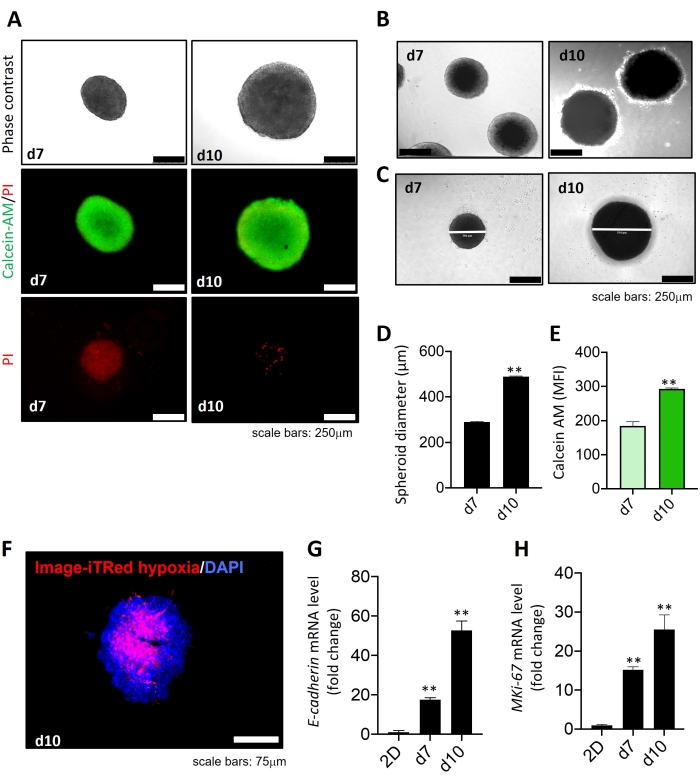
Figure 1: Development of multicellular tumor spheroids and live-dead analysis. (A) Upper panel: Microscopic images of multicellular 3D tumor spheroids comprised of A549 (lung adenocarcinoma cells), MRC-5 (fibroblasts), and THP-1 (monocytes) on day 7 and day 10. Middle and lower panel: Merged image of calcein-AM and propidium iodide (PI) staining (middle panel) and propidium iodide staining (lower panel) on day 7 and day 10 tumor spheroids. (B) Phase contrast images of day 7 and day 10 tumor spheroids captured at 10x objective. (C,D) Representative images and quantitative analysis of day 7 (d7) and day 10 (d10) spheroids showing measurement of spheroid diameter. (E) Quantitative analysis of calcein-AM labeled cells at day 7 and day 10 tumor spheroids. (F) Immunofluorescence staining of Image-iTRed hypoxia staining in day 10 spheroid sections (6 µm). DAPI was used for nuclei counterstaining. (G,H) RT-qPCR analysis of E cadherin (G) and MKi67 (cell proliferation marker) (H) mRNA levels in day 7 and day 10 of tumor spheroids. Two-dimensional culture of MRC-5 was considered as control. All experiments were performed in triplicates (n = 3). Data represented as mean ± standard deviation (S.D. **p < 0.01 for test (day 7 spheroid) versus control (2D culture MRC-5) using student t-test. Please click here to view a larger version of this figure.
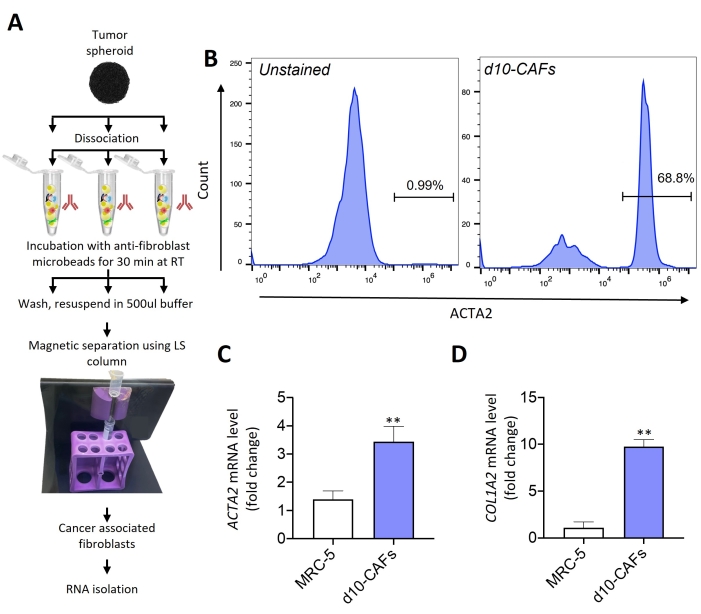
Figure 2: Analysis of CAF characteristics in isolated fibroblasts from tumor spheroids. (A) Diagrammatic overview of the protocol for the isolation of fibroblasts from the multicellular tumor spheroids at day 10 using anti-fibroblast microbeads with the help of a magnetic cell sorter followed by the RNA isolation for flow cytometric and gene expression analysis. (B) Flow cytometric analysis depicting an increase in ACTA2 protein expression in isolated fibroblasts. (C,D) RT-qPCR analysis of ACTA2 (C) and COL1A2 (D) mRNA levels in the isolated fibroblasts from day 10 tumor spheroids. All experiments were performed in triplicates (n = 3). Data represented as mean ± S.D. **p < 0.01 for test (isolated CAFs) versus control (MRC-5) using student t-test. Please click here to view a larger version of this figure.
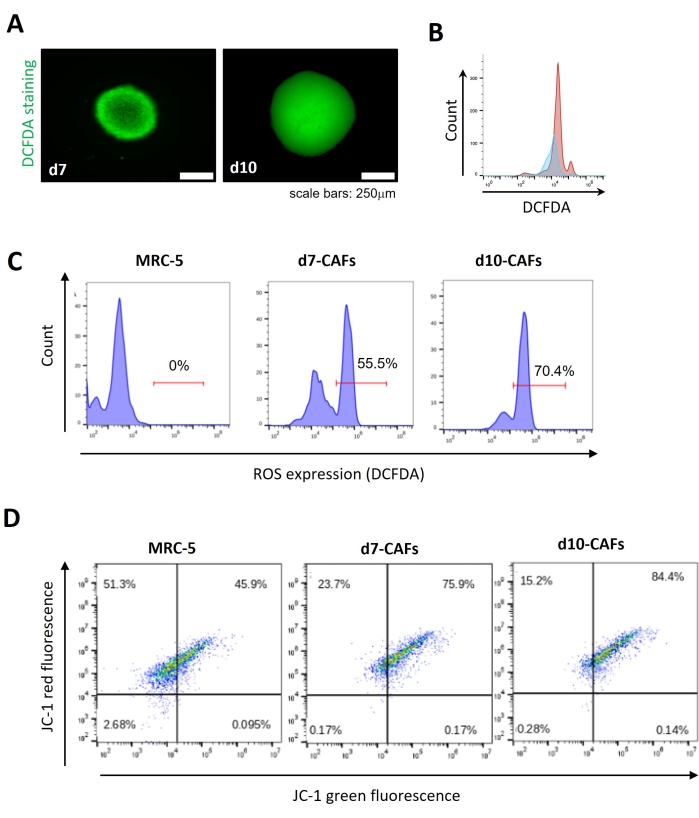
Figure 3: Analysis of reactive oxygen species (ROS) levels and JC1 staining in isolated CAFs. (A) Immunofluorescence images showing reactive oxygen species (ROS) levels in day 7 and day 10 spheroids by DCFDA staining. (B) Flow cytometric analysis representing the number of DCFDA positive cells. X-axis presents DCFDA and Y-axis presents cell count. (C) The abundance of DCFDA positive CAFs isolated from day 7 and day 10 spheroids by flow cytometry. MRC-5 cells in 2D culture were used as control. (D) Flow cytometric assay of JC-1 staining for analyzing mitochondrial membrane potential in isolated CAFs from day 7 and day 10 tumor spheroids. MRC-5 cells in 2D culture were used as control. All experiments were performed in triplicates (n = 3). Data represented as mean ± S.D. Please click here to view a larger version of this figure.
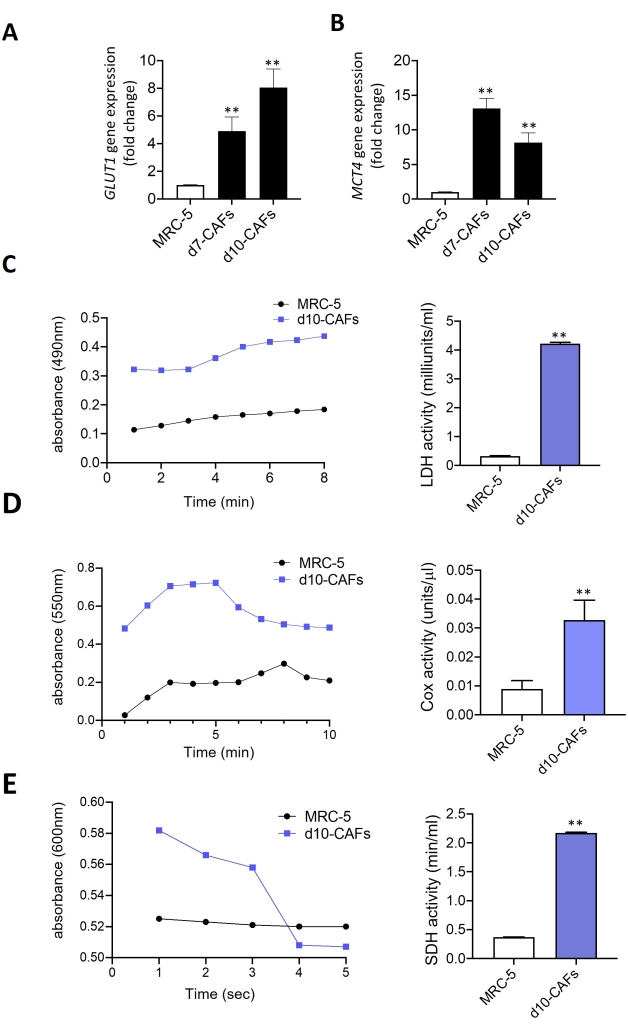
Figure 4: Measurement of mitochondrial enzyme activities in isolated CAFs. (A,B) RT-qPCR analysis of GLUT1 (A) and MCT4 (B) mRNA levels in isolated CAFs from day 7 and day 10 tumor spheroids compared with the normal fibroblasts (MRC-5). (C–E) Lactate dehydrogenase (LDH) enzyme activity (C), cytochrome c oxidase (COX) enzyme activity (D), and succinate dehydrogenase (SDH) enzyme activity (E) were measured in normal fibroblasts and isolated CAFs from day 10 tumor spheroids. All experiments were performed in triplicates (n = 3). Data represented as mean ± S.D. **p < 0.01 significance for test (isolated CAFs) versus control (MRC-5) using student t-test. Please click here to view a larger version of this figure.
Supplementary Table 1: List of forward (F) and reverse (R) primers for RT-qPCR analysis. Please click here to download this File.
